Downtown (Downtown Glendora) neighborhood in Glendora, California (CA), 91741 detailed profile
Settings
X


Business Search - 14 Million verified businesses
Area: 0.230 square miles
Population: 3,061
Population density:
| Downtown (Downtown Glendora): | 13,312 people per square mile |
| Glendora: | 2,721 people per square mile |

- 1,24939.3%Hispanic or Latino
- 1,03632.6%White
- 3129.8%Two or more races
- 2477.8%Black
- 2307.2%Asian
- 953.0%Some other race
- 70.2%Native Hawaiian and Other
Pacific Islander

Median household income in 2022:
| Downtown (Downtown Glendora): | $98,657 |
| Glendora: | $106,718 |
Distribution of median household income
![Distribution of median household income]()
- 59Less than $10,000
- 48$10,000 to $19,999
- 66$20,000 to $29,999
- 149$30,000 to $39,999
- 46$40,000 to $49,999
- 68$50,000 to $59,999
- 100$60,000 to $74,999
- 137$75,000 to $99,999
- 77$100,000 to $124,999
- 198$125,000 to $149,999
- 131$150,000 to $199,999
- 100$200,000 or more

Distribution of owner-occupied house/condo value
![Distribution of owner-occupied house/condo value]()
- 41Less than $50,000
- 107$50,000 to $99,999
- 11$100,000 to $149,999
- 23$400,000 to $499,999
- 154$500,000 to $749,999
- 101$750,000 to $999,999
- 31$1,000,000 or more

Distribution of rent paid by renters
![Distribution of rent paid by renters]()
- 5Less than $100
- 16$100 to $199
- 48$200 to $299
- 4$700 to $799
- 45$800 to $899
- 5$900 to $999
- 35$1,000 to $1,249
- 73$1,250 to $1,499
- 156$1,500 to $1,999
- 475$2,000 or more

Median rent in 2022:
| Downtown (Downtown Glendora): | $1,973 |
| Glendora: | $1,931 |
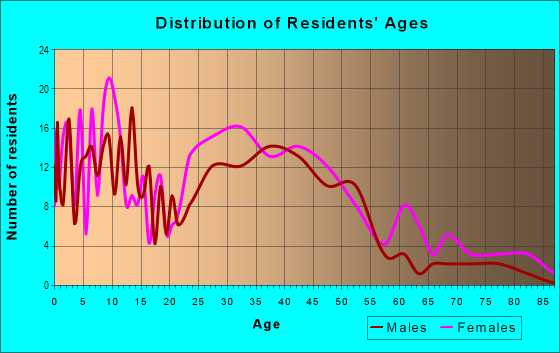
| Males: | 1,492 |
| Females: | 1,569 |
Males:
| This neighborhood: | 30.4 years |
| Whole city: | 39.9 years |
| This neighborhood: | 37.6 years |
| Whole city: | 40.8 years |
Average household size:
| Downtown (Downtown Glendora): | 3.0 people |
| Glendora: | 34.0 people |
Percentage of family households:
| Downtown (Downtown Glendora): | 51.9% |
| Glendora: | 52.7% |
| Here: | 38.5% |
| Glendora: | 57.8% |
Percentage of married-couple families with children (among all households):
| Downtown (Downtown Glendora): | 21.5% |
| Glendora: | 26.1% |
Percentage of single-mother households (among all households):
| Downtown (Downtown Glendora): | 4.2% |
| Glendora: | 3.6% |
Percentage of never married males 15 years old and over:
Percentage of never married females 15 years old and over:
| Downtown (Downtown Glendora): | 26.5% |
| Glendora: | 17.4% |
Percentage of never married females 15 years old and over:
| Downtown (Downtown Glendora): | 20.2% |
| city: | 16.0% |
Percentage of people that speak English not well or not at all:
| Downtown (Downtown Glendora): | 5.1% |
| Glendora: | 3.7% |
Percentage of people born in this state:
Percentage of people born in another U.S. state:
Percentage of native residents but born outside the U.S.:
Percentage of foreign born residents:
| Here: | 68.8% |
| Glendora: | 67.2% |
Percentage of people born in another U.S. state:
| Downtown (Downtown Glendora): | 12.4% |
| Glendora: | 13.1% |
Percentage of native residents but born outside the U.S.:
| Here: | 1.7% |
| city: | 1.1% |
Percentage of foreign born residents:
| Here: | 17.2% |
| Glendora: | 18.6% |

Owner-occupied
Renter-occupied


- Rooms in owner-occupied houses and condos in Downtown <
> - 21 room
- 472 rooms
- 553 rooms
- 384 rooms
- 635 rooms
- 986 rooms
- 377 rooms
- 188 rooms
- 289+ rooms

- Rooms in renter-occupied apartments in Downtown <
> - 1131 room
- 432 rooms
- 1583 rooms
- 2114 rooms
- 1625 rooms
- 636 rooms
- 417 rooms
- 88 rooms
- 269+ rooms
Owner-occupied
Renter-occupied

- Bedrooms in owner-occupied houses and condos in Downtown <
> - 2no bedroom
- 621 bedroom
- 1032 bedrooms
- 1343 bedrooms
- 784 bedrooms
- 115+ bedrooms

- Bedrooms in renter-occupied apartments in Downtown <
> - 113no bedroom
- 1801 bedroom
- 3362 bedrooms
- 1593 bedrooms
- 134 bedrooms
- 265+ bedrooms
Average number of cars or other vehicles available in houses/condos:
Average number of cars or other vehicles available in apartments:
| This neighborhood: | 2.3 |
| Glendora: | 2.4 |
Average number of cars or other vehicles available in apartments:
| Here: | 1.9 |
| city: | 1.9 |
Percentage of units with a mortgage:
| Downtown (Downtown Glendora): | 63.6% |
| Glendora: | 66.7% |
Average estimated value of detached houses in 2022 (35.0% of all units):
| Downtown (Downtown Glendora): | $761,899 |
| California: | $988,808 |

- Year house built in Downtown <
> - 02020 or later
- 3382010 to 2019
- 252000 to 2009
- 411990 to 1999
- 921980 to 1989
- 801970 to 1979
- 1111960 to 1969
- 2041950 to 1959
- 1021940 to 1949
- 1641939 or earlier

City-data.com crime index for city in 2020 (higher means more crime):
| City: | 171.1 |
| U.S. average: | 219.5 |
Travel time to work (commute)
![Travel time to work (commute)]()
- 30Less than 5 minutes
- 775 to 9 minutes
- 13010 to 14 minutes
- 11515 to 19 minutes
- 15420 to 24 minutes
- 5725 to 29 minutes
- 21630 to 34 minutes
- 2335 to 39 minutes
- 8340 to 44 minutes
- 13945 to 59 minutes
- 9160 to 89 minutes
- 4490 or more minutes

Means of transportation to work
![Means of transportation to work]()
- 70.1%1,078Drove a car alone
- 17.8%274Carpooled
- 1.9%29Bus
- 3.0%46Subway or elevated rail
- 1.3%20Long-distance train or commuter rail
- 0.7%11Light rail, streetcar or trolley
- 0.4%6Motorcycle
- 0.5%7Bicycle
- 1.2%18Walked
- 2.7%42Other means
- 7.4%114Worked at home

Time leaving home to go to work
![Time leaving home to go to work]()
- 5112:00 a.m. to 4:59 a.m.
- 845:00 a.m. to 5:29 a.m.
- 815:30 a.m. to 5:59 a.m.
- 1796:00 a.m. to 6:29 a.m.
- 636:30 a.m. to 6:59 a.m.
- 1877:00 a.m. to 7:29 a.m.
- 607:30 a.m. to 7:59 a.m.
- 1798:00 a.m. to 8:29 a.m.
- 578:30 a.m. to 8:59 a.m.
- 759:00 a.m. to 9:59 a.m.
- 1410:00 a.m. to 10:59 a.m.
- 811:00 a.m. to 11:59 a.m.
- 3712:00 p.m. to 3:59 p.m.
- 664:00 p.m. to 11:59 p.m.

Occupations of males:
- Percentage of males in management occupations (except farmers):
Here: 13.7% city: 13.1%
- Percentage of males in business and financial operations occupations:
Here: 2.2% city: 5.5%
- Percentage of males in architecture and engineering occupations:
Here: 2.6% city: 3.6%
- Percentage of males in education, training, and library occupations:
Here: 4.0% city: 4.0%
- Percentage of males in arts, design, entertainment, sports, and media occupations:
Here: 2.3% city: 4.2%
- Percentage of males in healthcare practitioners and technical occupations:
Here: 4.6% city: 4.6%
- Percentage of males in service occupations:
Here: 19.8% city: 12.0%
- Percentage of males in sales and office occupations:
Here: 17.1% city: 18.6%
- Percentage of males in construction, extraction, and maintenance occupations:
Here: 12.4% city: 9.3%
- Percentage of males in production occupations:
Here: 2.8% city: 4.9%
- Percentage of males in transportation occupations:
Here: 9.1% city: 4.0%
- Percentage of males in material moving occupations:
Here: 4.4% city: 3.9%
Occupations of females:
- Percentage of females in management occupations (except farmers):
Here: 5.4% city: 9.7%
- Percentage of females in business and financial operations occupations:
Here: 4.9% city: 5.5%
- Percentage of females in computer and mathematical occupations:
Here: 2.0% city: 1.3%
- Percentage of females in life, physical, and social science occupations:
Here: 2.4% city: 0.9%
- Percentage of females in community and social services occupations:
Here: 3.3% city: 2.3%
- Percentage of females in legal occupations:
Here: 2.3% city: 1.0%
- Percentage of females in education, training, and library occupations:
Here: 7.0% city: 10.6%
- Percentage of females in arts, design, entertainment, sports, and media occupations:
Here: 5.3% city: 2.2%
- Percentage of females in healthcare practitioners and technical occupations:
Here: 10.9% city: 11.0%
- Percentage of females in service occupations:
Here: 11.3% city: 14.7%
- Percentage of females in sales and office occupations:
Here: 37.0% city: 33.7%
- Percentage of females in production occupations:
Here: 5.3% city: 2.4%
- Percentage of females in material moving occupations:
Here: 2.8% city: 3.2%
Education in this neighborhood (subdivision or community):
- Percentage of people 3 years and older in K-12 schools:
Downtown (Downtown Glendora): 21.7% Glendora: 17.2%
- Percentage of people 3 years and older in undergraduate colleges:
Downtown (Downtown Glendora): 6.4% Glendora: 7.5%
- Percentage of people 3 years and older in grad. or professional schools:
Downtown (Downtown Glendora): 3.8% Glendora: 1.4%
- Percentage of students K-12 enrolled in private schools:
Downtown (Downtown Glendora): 33.8% Glendora: 14.9%
Percentage of population below poverty level:
| Downtown (Downtown Glendora): | 7.1% |
| Glendora: | 7.2% |
Median year owner moved in (as recorded in 2022):
| Downtown (Downtown Glendora): | 2002 |
| Glendora: | 2005 |
Percentage of married-couple families with both working:
| Downtown (Downtown Glendora): | 79.4% |
| Glendora: | 65.2% |

- 77.9%Utility gas
- 11.7%Electricity
- 4.2%Bottled, tank, or LP gas
- 2.6%Solar energy
- 2.0%No fuel used
- 1.6%Coal or coke
Roads and streets:
S Glendora Ave
Length: 0.43 miles
Directions: N-S, SE-NW
Address range: 100 to 499
Directions: N-S, SE-NW
Address range: 100 to 499
E Carroll Ave
Length: 0.42 miles
Direction: E-W
Address range: 100 to 499
Direction: E-W
Address range: 100 to 499
E Foothill Blvd
Length: 0.42 miles
Direction: E-W
Address range: 100 to 499
Direction: E-W
Address range: 100 to 499
E Ada Ave
Length: 0.42 miles
Direction: E-W
Address range: 100 to 499
Direction: E-W
Address range: 100 to 499
S Wabash Ave
Length: 0.38 miles
Direction: N-S
Address range: 100 to 499
Direction: N-S
Address range: 100 to 499
S Minnesota Ave
Length: 0.38 miles
Direction: N-S
Address range: 100 to 499
Direction: N-S
Address range: 100 to 499
S Vista Bonita Ave
Length: 0.35 miles
Direction: N-S
Address range: 100 to 413
Direction: N-S
Address range: 100 to 413
E Meda Ave
Length: 0.27 miles
Direction: E-W
Address range: 100 to 399
Direction: E-W
Address range: 100 to 399
S Cullen Ave
Length: 0.25 miles
Direction: N-S
Address range: 100 to 299
Direction: N-S
Address range: 100 to 299
E Walnut Ave
Length: 0.24 miles
Direction: E-W
Address range: 200 to 460
Direction: E-W
Address range: 200 to 460
E Lemon Ave
Length: 0.23 miles
Direction: E-W
Address range: 200 to 499
Direction: E-W
Address range: 200 to 499
N Glendora Ave
Length: 0.17 miles
Direction: N-S
Address range: 100 to 199
Direction: N-S
Address range: 100 to 199
N Wabash Ave
Length: 0.17 miles
Direction: N-S
Address range: 100 to 199
Direction: N-S
Address range: 100 to 199
N Vista Bonita Ave
Length: 0.17 miles
Direction: N-S
Address range: 100 to 199
Direction: N-S
Address range: 100 to 199
E Dalton Ave
Length: 0.15 miles
Directions: E-W, SW-NE
Address range: 400 to 499
Directions: E-W, SW-NE
Address range: 400 to 499
E Myrtle Ave
Length: 0.15 miles
Direction: E-W
Address range: 400 to 499
Direction: E-W
Address range: 400 to 499
Sycamore Ave
Length: 0.15 miles
Direction: E-W
Address range: 400 to 499
Direction: E-W
Address range: 400 to 499
N Cullen Ave
Length: 0.14 miles
Direction: N-S
Address range: 100 to 220
Direction: N-S
Address range: 100 to 220
S Pasadena Ave
Length: 0.13 miles
Direction: N-S
Address range: 300 to 499
Direction: N-S
Address range: 300 to 499
N Pasadena Ave
Length: 0.06 miles
Direction: N-S
Address range: 100 to 199
Direction: N-S
Address range: 100 to 199
N Minnesota Ave
Length: 0.06 miles
Direction: N-S
Address range: 100 to 199
Direction: N-S
Address range: 100 to 199
Other features:
Little Dalton Wash
Length: 0.44 miles
Directions: E-W, SW-NE
Directions: E-W, SW-NE