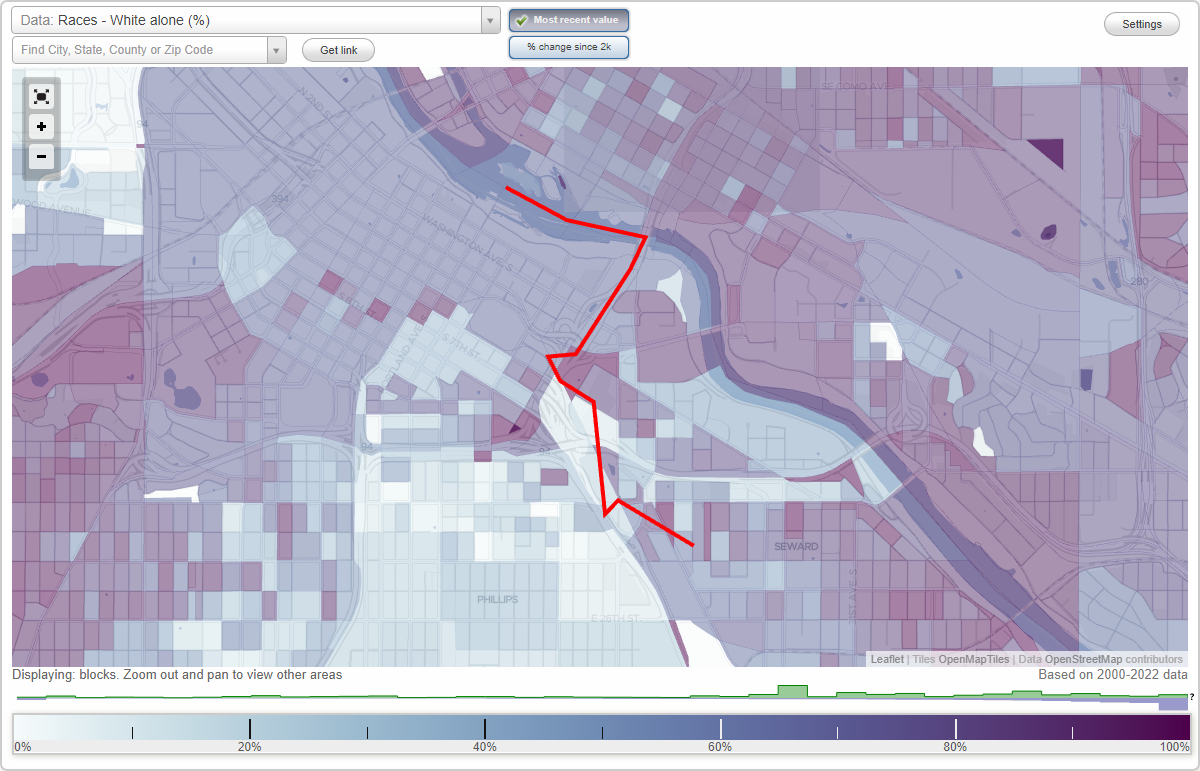
Downtown East neighborhood in Minneapolis, Minnesota (MN), 55415 detailed profile
Settings
X

Business Search - 14 Million verified businesses
Area: 0.384 square miles
Population: 2,542
Population density:
| Downtown East: | 6,623 people per square mile |
| Minneapolis: | 7,744 people per square mile |

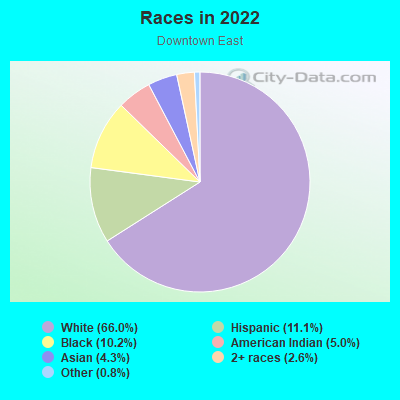
- 1,73866.0%White
- 29311.1%Hispanic or Latino
- 26810.2%Black
- 1315.0%American Indian
- 1144.3%Asian
- 692.6%Two or more races
- 210.8%Some other race
Distribution of median household income
![Distribution of median household income]()
- 152Less than $10,000
- 155$10,000 to $19,999
- 236$20,000 to $29,999
- 85$30,000 to $39,999
- 147$40,000 to $49,999
- 143$50,000 to $59,999
- 190$60,000 to $74,999
- 86$75,000 to $99,999
- 38$100,000 to $124,999
- 45$125,000 to $149,999
- 89$150,000 to $199,999
- 66$200,000 or more

Distribution of owner-occupied house/condo value
![Distribution of owner-occupied house/condo value]()
- 21$100,000 to $149,999
- 57$150,000 to $199,999
- 57$200,000 to $249,999
- 48$250,000 to $299,999
- 41$300,000 to $399,999
- 41$400,000 to $499,999
- 62$500,000 to $749,999
- 37$750,000 to $999,999
- 8$1,000,000 or more

Distribution of rent paid by renters
![Distribution of rent paid by renters]()
- 82Less than $100
- 74$100 to $199
- 99$200 to $299
- 113$300 to $399
- 29$400 to $499
- 113$500 to $599
- 118$600 to $699
- 156$700 to $799
- 109$800 to $899
- 207$900 to $999
- 260$1,000 to $1,249
- 127$1,250 to $1,499
- 122$1,500 to $1,999
- 207$2,000 or more

Median rent in 2022:
| Downtown East: | $1,043 |
| Minneapolis: | $1,159 |
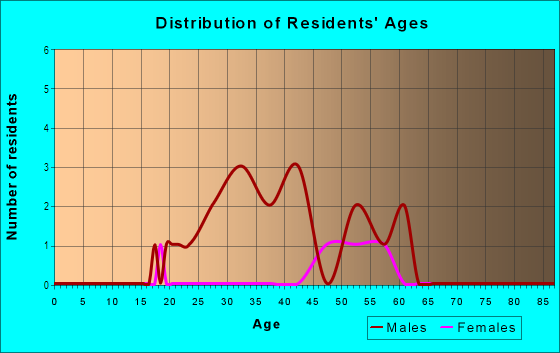
| Males: | 1,455 |
| Females: | 1,086 |
Males:
| This neighborhood: | 40.8 years |
| Whole city: | 33.3 years |
| This neighborhood: | 42.3 years |
| Whole city: | 33.2 years |
Average household size:
| Downtown East: | 1.4 people |
| Minneapolis: | 2.1 people |
Percentage of family households:
| Downtown East: | 20.4% |
| Minneapolis: | 34.1% |
| Here: | 16.1% |
| Minneapolis: | 29.8% |
Percentage of married-couple families with children (among all households):
| Downtown East: | 40.0% |
| Minneapolis: | 31.8% |
Percentage of single-mother households (among all households):
| Downtown East: | 16.3% |
| Minneapolis: | 10.5% |
Percentage of never married males 15 years old and over:
Percentage of never married females 15 years old and over:
| Downtown East: | 37.4% |
| Minneapolis: | 27.0% |
Percentage of never married females 15 years old and over:
| Downtown East: | 23.3% |
| city: | 25.4% |
Percentage of people that speak English not well or not at all:
| Downtown East: | 0.0% |
| Minneapolis: | 3.8% |
Percentage of people born in this state:
Percentage of people born in another U.S. state:
Percentage of native residents but born outside the U.S.:
Percentage of foreign born residents:
| Here: | 49.3% |
| Minneapolis: | 51.9% |
Percentage of people born in another U.S. state:
| Downtown East: | 37.6% |
| Minneapolis: | 31.8% |
Percentage of native residents but born outside the U.S.:
| Here: | 1.5% |
| city: | 1.5% |
Percentage of foreign born residents:
| Here: | 11.7% |
| Minneapolis: | 14.7% |
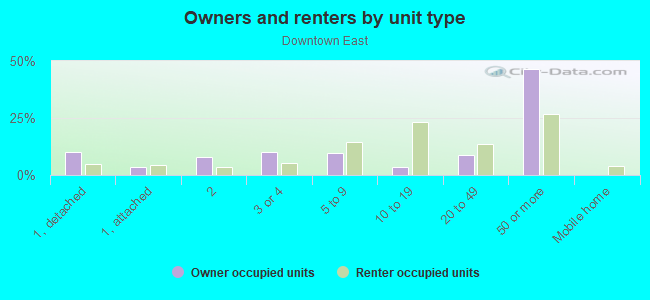
Owner-occupied
Renter-occupied

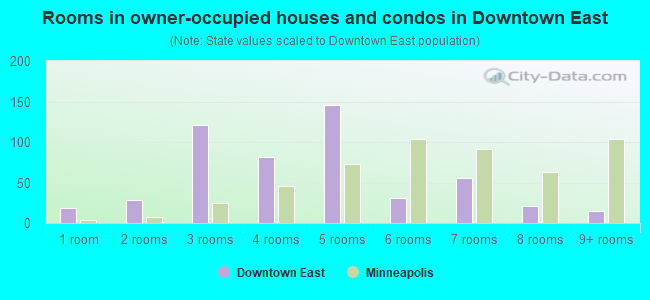
- Rooms in owner-occupied houses and condos in Downtown East
- 191 room
- 292 rooms
- 1213 rooms
- 814 rooms
- 1465 rooms
- 316 rooms
- 567 rooms
- 218 rooms
- 159+ rooms
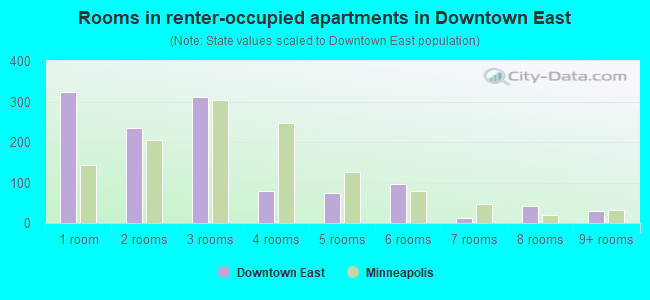
- Rooms in renter-occupied apartments in Downtown East
- 3241 room
- 2342 rooms
- 3103 rooms
- 804 rooms
- 755 rooms
- 976 rooms
- 127 rooms
- 418 rooms
- 299+ rooms
Owner-occupied
Renter-occupied
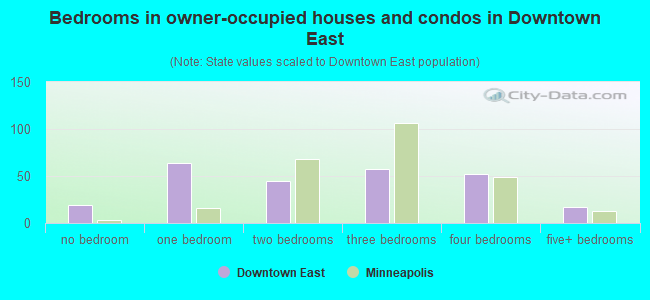
- Bedrooms in owner-occupied houses and condos in Downtown East
- 19no bedroom
- 641 bedroom
- 452 bedrooms
- 573 bedrooms
- 524 bedrooms
- 175+ bedrooms
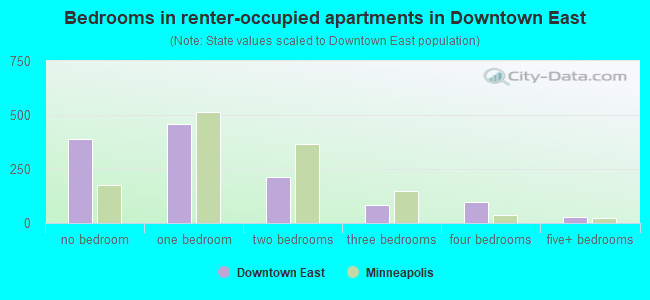
- Bedrooms in renter-occupied apartments in Downtown East
- 387no bedroom
- 4571 bedroom
- 2112 bedrooms
- 833 bedrooms
- 994 bedrooms
- 295+ bedrooms
Average number of cars or other vehicles available in houses/condos:
Average number of cars or other vehicles available in apartments:
| This neighborhood: | 1.4 |
| Minneapolis: | 1.6 |
Average number of cars or other vehicles available in apartments:
| Here: | 0.9 |
| city: | 1.1 |
Percentage of units with a mortgage:
| Downtown East: | 68.0% |
| Minneapolis: | 71.8% |
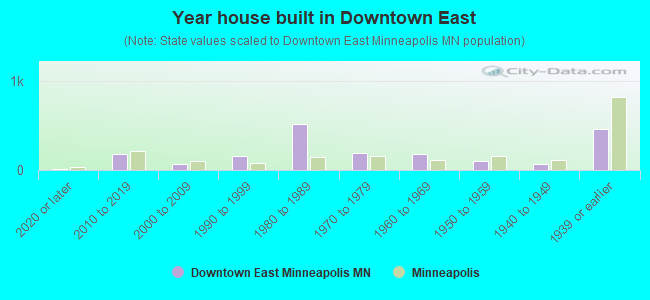
- Year house built in Downtown East
- 152020 or later
- 1752010 to 2019
- 672000 to 2009
- 1521990 to 1999
- 5151980 to 1989
- 1881970 to 1979
- 1771960 to 1969
- 981950 to 1959
- 661940 to 1949
- 4561939 or earlier
City-data.com crime index for city in 2020 (higher means more crime):
| City: | 600.2 |
| U.S. average: | 219.5 |
Travel time to work (commute)
![Travel time to work (commute)]()
- 75Less than 5 minutes
- 2935 to 9 minutes
- 44210 to 14 minutes
- 37915 to 19 minutes
- 41320 to 24 minutes
- 29025 to 29 minutes
- 19830 to 34 minutes
- 5735 to 39 minutes
- 6240 to 44 minutes
- 6845 to 59 minutes
- 5360 to 89 minutes
- 7090 or more minutes

Means of transportation to work
![Means of transportation to work]()
- 49.5%690Drove a car alone
- 3.9%55Carpooled
- 9.0%125Bus
- 5.8%81Subway or elevated rail
- 0.7%10Long-distance train or commuter rail
- 5.0%70Light rail, streetcar or trolley
- 1.9%26Taxi
- 1.6%23Motorcycle
- 8.1%113Bicycle
- 16.2%226Walked
- 1.6%23Other means
- 13.6%190Worked at home

Time leaving home to go to work
![Time leaving home to go to work]()
- 6512:00 a.m. to 4:59 a.m.
- 395:00 a.m. to 5:29 a.m.
- 755:30 a.m. to 5:59 a.m.
- 1176:00 a.m. to 6:29 a.m.
- 1236:30 a.m. to 6:59 a.m.
- 2877:00 a.m. to 7:29 a.m.
- 4427:30 a.m. to 7:59 a.m.
- 3138:00 a.m. to 8:29 a.m.
- 1408:30 a.m. to 8:59 a.m.
- 2079:00 a.m. to 9:59 a.m.
- 10110:00 a.m. to 10:59 a.m.
- 7111:00 a.m. to 11:59 a.m.
- 23612:00 p.m. to 3:59 p.m.
- 1584:00 p.m. to 11:59 p.m.

Occupations of males:
- Percentage of males in management occupations (except farmers):
Here: 6.4% city: 12.1%
- Percentage of males in business and financial operations occupations:
Here: 7.4% city: 9.1%
- Percentage of males in computer and mathematical occupations:
Here: 5.1% city: 8.4%
- Percentage of males in architecture and engineering occupations:
Here: 11.5% city: 4.6%
- Percentage of males in life, physical, and social science occupations:
Here: 2.3% city: 2.0%
- Percentage of males in community and social services occupations:
Here: 1.7% city: 1.8%
- Percentage of males in legal occupations:
Here: 2.1% city: 2.0%
- Percentage of males in education, training, and library occupations:
Here: 12.3% city: 5.2%
- Percentage of males in arts, design, entertainment, sports, and media occupations:
Here: 2.2% city: 4.0%
- Percentage of males in healthcare practitioners and technical occupations:
Here: 1.3% city: 3.6%
- Percentage of males in service occupations:
Here: 9.8% city: 12.6%
- Percentage of males in sales and office occupations:
Here: 16.7% city: 15.3%
- Percentage of males in farming, fishing, and forestry occupations:
Here: 5.1% city: 0.3%
- Percentage of males in construction, extraction, and maintenance occupations:
Here: 5.6% city: 3.3%
- Percentage of males in production occupations:
Here: 5.8% city: 5.8%
- Percentage of males in transportation occupations:
Here: 6.7% city: 4.1%
- Percentage of males in material moving occupations:
Here: 5.3% city: 3.6%
Occupations of females:
- Percentage of females in management occupations (except farmers):
Here: 16.0% city: 11.4%
- Percentage of females in business and financial operations occupations:
Here: 2.6% city: 9.8%
- Percentage of females in architecture and engineering occupations:
Here: 2.2% city: 1.2%
- Percentage of females in community and social services occupations:
Here: 1.4% city: 3.8%
- Percentage of females in legal occupations:
Here: 2.7% city: 2.3%
- Percentage of females in education, training, and library occupations:
Here: 13.5% city: 10.6%
- Percentage of females in arts, design, entertainment, sports, and media occupations:
Here: 5.9% city: 5.6%
- Percentage of females in healthcare practitioners and technical occupations:
Here: 6.0% city: 8.3%
- Percentage of females in service occupations:
Here: 32.5% city: 17.8%
- Percentage of females in sales and office occupations:
Here: 15.1% city: 18.7%
- Percentage of females in production occupations:
Here: 3.2% city: 2.7%
- Percentage of females in material moving occupations:
Here: 1.4% city: 1.5%
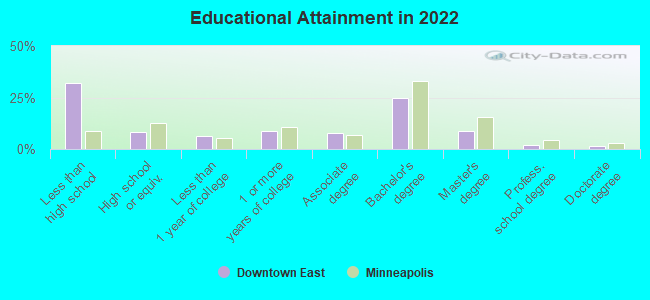
Education in this neighborhood (subdivision or community):
- Percentage of people 3 years and older in K-12 schools:
Downtown East: 10.4% Minneapolis: 14.0%
- Percentage of people 3 years and older in undergraduate colleges:
Downtown East: 19.1% Minneapolis: 8.6%
- Percentage of people 3 years and older in grad. or professional schools:
Downtown East: 7.8% Minneapolis: 2.9%
- Percentage of students K-12 enrolled in private schools:
Downtown East: 23.1% Minneapolis: 14.1%
Percentage of population below poverty level:
| Downtown East: | 23.0% |
| Minneapolis: | 17.2% |
Median year owner moved in (as recorded in 2022):
Median year renter moved in (as recorded in 2022):
| Downtown East: | 2009 |
| Minneapolis: | 2012 |
Median year renter moved in (as recorded in 2022):
| Downtown East: | 2016 |
| Minneapolis: | 2021 |
Percentage of married-couple families with both working:
| Downtown East: | 100.0% |
| Minneapolis: | 73.9% |
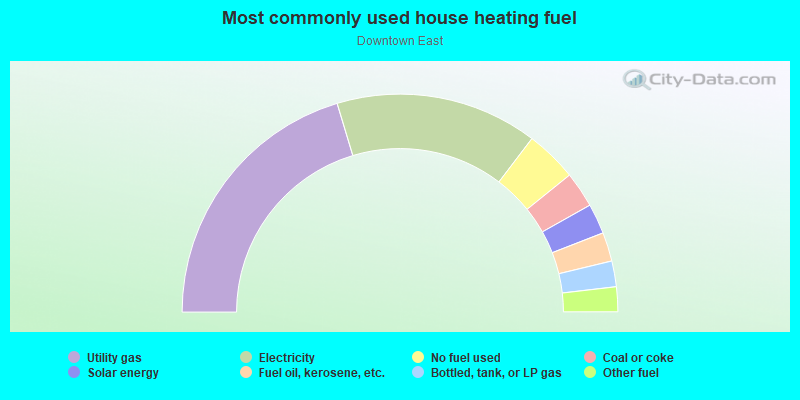
- 40.7%Utility gas
- 30.0%Electricity
- 7.7%No fuel used
- 5.3%Coal or coke
- 4.5%Solar energy
- 4.3%Fuel oil, kerosene, etc.
- 3.8%Bottled, tank, or LP gas
- 3.7%Other fuel
Limited-access highways (interstate or state) in this neighborhood:
I- 35
Length: 0.43 miles
Directions: N-S, SW-NE
Directions: N-S, SW-NE
Highways in this neighborhood:
State Hwy 122
Length: 0.30 miles
Directions: E-W, SE-NW
Directions: E-W, SE-NW
Roads and streets:
Washington Ave S
Length: 0.68 miles
Direction: SE-NW
Address range: 700 to 1292
Direction: SE-NW
Address range: 700 to 1292
S 2nd St
Length: 0.56 miles
Direction: SE-NW
Address range: 800 to 1299
Direction: SE-NW
Address range: 800 to 1299
S 5th St
Length: 0.47 miles
Directions: E-W, SE-NW
Address range: 900 to 1399
Directions: E-W, SE-NW
Address range: 900 to 1399
6th St S
Length: 0.46 miles
Direction: SE-NW
Address range: 900 to 1350
Direction: SE-NW
Address range: 900 to 1350
11th Ave S
Length: 0.44 miles
Direction: SW-NE
Address range: 201 to 599
Direction: SW-NE
Address range: 201 to 599
4th St S
Length: 0.42 miles
Directions: E-W, SE-NW
Address range: 700 to 1099
Directions: E-W, SE-NW
Address range: 700 to 1099
3rd St S
Length: 0.41 miles
Directions: E-W, SE-NW
Address range: 700 to 999
Directions: E-W, SE-NW
Address range: 700 to 999
12th Ave S
Length: 0.31 miles
Direction: SW-NE
Address range: 100 to 599
Direction: SW-NE
Address range: 100 to 599
10th Ave S
Length: 0.28 miles
Direction: SW-NE
Address range: 200 to 499
Direction: SW-NE
Address range: 200 to 499
W River Pkwy
Length: 0.27 miles
Direction: E-W
Direction: E-W
Park Ave N (Co Rd 33)
Length: 0.26 miles
Direction: SW-NE
Address range: 200 to 491
Direction: SW-NE
Address range: 200 to 491
S 3rd St
Length: 0.20 miles
Direction: SE-NW
Address range: 1000 to 1199
Direction: SE-NW
Address range: 1000 to 1199
Chicago Ave S
Length: 0.18 miles
Direction: SW-NE
Address range: 200 to 399
Direction: SW-NE
Address range: 200 to 399
9th Ave S
Length: 0.17 miles
Direction: SW-NE
Address range: 200 to 599
Direction: SW-NE
Address range: 200 to 599
Norm McGrew Pl
Length: 0.06 miles
Direction: SW-NE
Address range: 300 to 399
Direction: SW-NE
Address range: 300 to 399
13th Ave S
Length: 0.06 miles
Direction: SW-NE
Address range: 500 to 599
Direction: SW-NE
Address range: 500 to 599