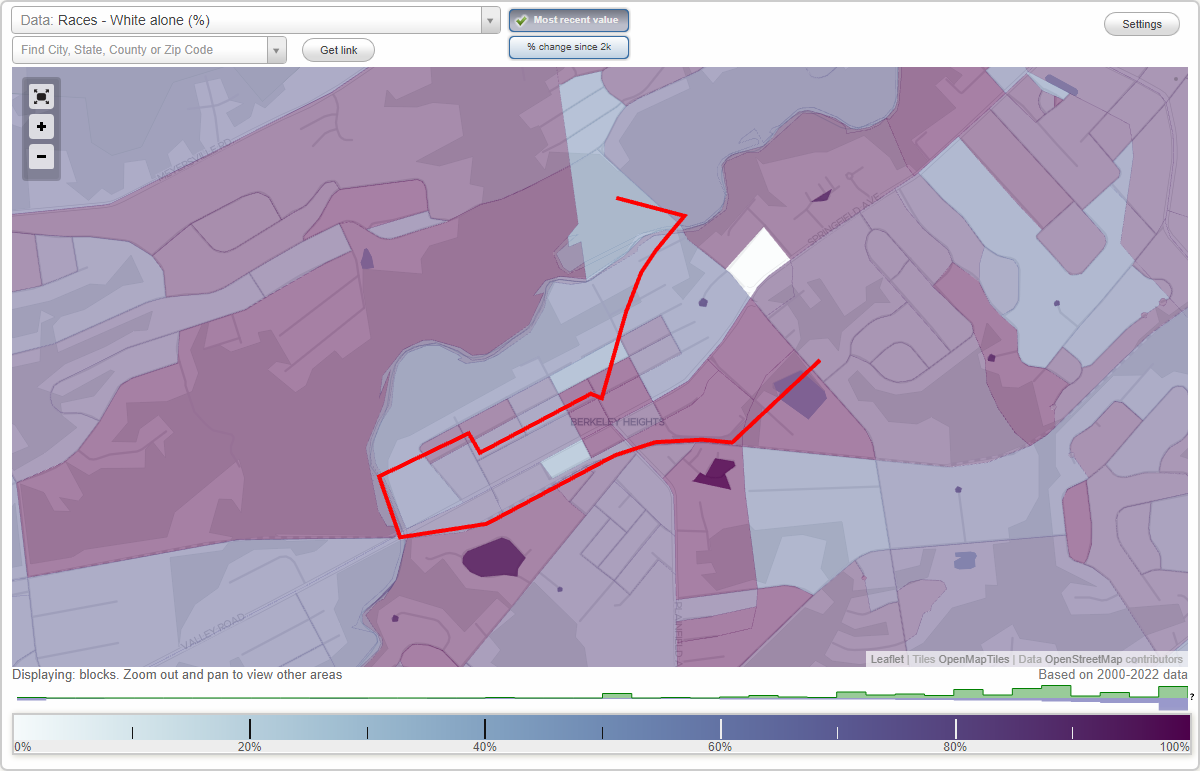
Downtown (Downtown Section) neighborhood in Berkeley Heights, New Jersey (NJ), 07922 detailed profile
Settings
X

Business Search - 14 Million verified businesses
Area: 0.185 square miles
Population: 307
Population density:
| Downtown (Downtown Section): | 1,657 people per square mile |
| Berkeley Heights: | 2,141 people per square mile |

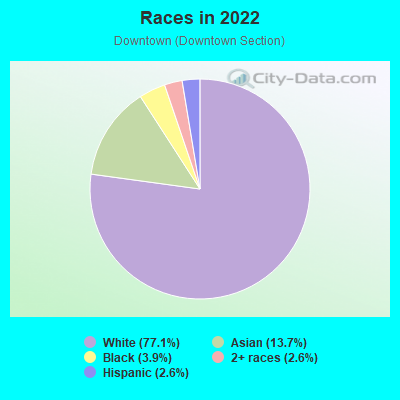
- 23677.1%White
- 4213.7%Asian
- 123.9%Black
- 82.6%Two or more races
- 82.6%Hispanic or Latino
Median household income in 2022:
| Downtown (Downtown Section): | $183,288 |
| New Jersey: | $96,346 |
Distribution of median household income
![Distribution of median household income]()
- 10Less than $10,000
- 24$10,000 to $19,999
- 17$20,000 to $29,999
- 15$30,000 to $39,999
- 11$40,000 to $49,999
- 10$50,000 to $59,999
- 25$60,000 to $74,999
- 16$75,000 to $99,999
- 35$100,000 to $124,999
- 31$125,000 to $149,999
- 9$150,000 to $199,999
- 16$200,000 or more

Distribution of owner-occupied house/condo value
![Distribution of owner-occupied house/condo value]()
- 8$50,000 to $99,999
- 40$150,000 to $199,999
- 6$200,000 to $249,999
- 10$250,000 to $299,999
- 17$300,000 to $399,999
- 10$400,000 to $499,999
- 52$500,000 to $749,999
- 28$750,000 to $999,999
- 28$1,000,000 or more

Distribution of rent paid by renters
![Distribution of rent paid by renters]()
- 22$400 to $499
- 1$1,000 to $1,249
- 2$1,250 to $1,499
- 1$1,500 to $1,999
- 18$2,000 or more

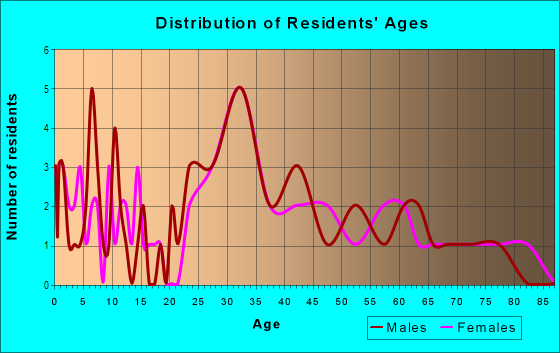
| Males: | 163 |
| Females: | 143 |
| Males: | 43.1 years |
| Females: | 45.5 years |
Average household size:
| Downtown (Downtown Section): | 2.9 people |
| New Jersey: | 2.6 people |
Percentage of family households:
| Downtown (Downtown Section): | 65.5% |
| New Jersey: | 47.0% |
| Here: | 54.2% |
| New Jersey: | 49.9% |
Percentage of married-couple families with children (among all households):
| Downtown (Downtown Section): | 36.9% |
| New Jersey: | 51.5% |
Percentage of single-mother households (among all households):
| Downtown (Downtown Section): | 4.0% |
| New Jersey: | 7.6% |
Percentage of never married males 15 years old and over:
Percentage of never married females 15 years old and over:
| Downtown (Downtown Section): | 21.8% |
| New Jersey: | 18.2% |
Percentage of never married females 15 years old and over:
| Downtown (Downtown Section): | 6.2% |
| New Jersey: | 16.6% |
Percentage of people that speak English not well or not at all:
| Downtown (Downtown Section): | 0.0% |
| New Jersey: | 6.5% |
Percentage of people born in this state:
Percentage of people born in another U.S. state:
Percentage of native residents but born outside the U.S.:
Percentage of foreign born residents:
| Here: | 60.2% |
| New Jersey: | 50.7% |
Percentage of people born in another U.S. state:
| Downtown (Downtown Section): | 25.3% |
| New Jersey: | 23.4% |
Percentage of native residents but born outside the U.S.:
| Here: | 1.1% |
| New Jersey: | 2.4% |
Percentage of foreign born residents:
| Here: | 13.4% |
| New Jersey: | 23.5% |
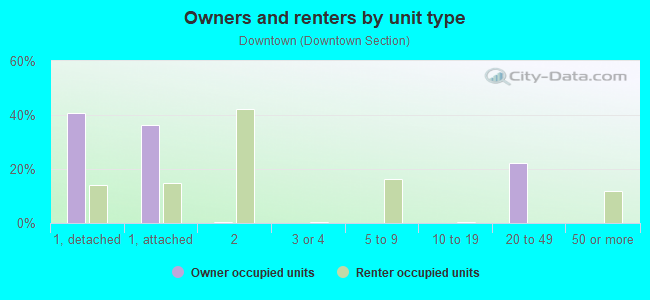
Owner-occupied
Renter-occupied

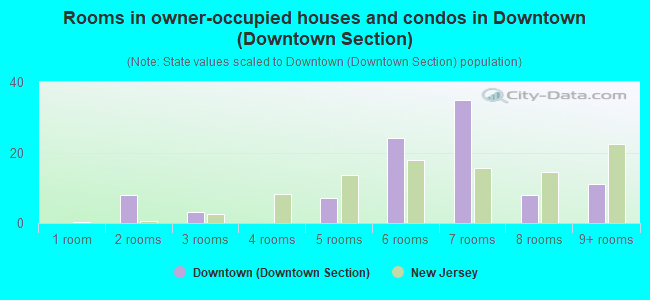
- Rooms in owner-occupied houses and condos in Downtown <
> - 01 room
- 82 rooms
- 33 rooms
- 04 rooms
- 75 rooms
- 246 rooms
- 357 rooms
- 88 rooms
- 119+ rooms
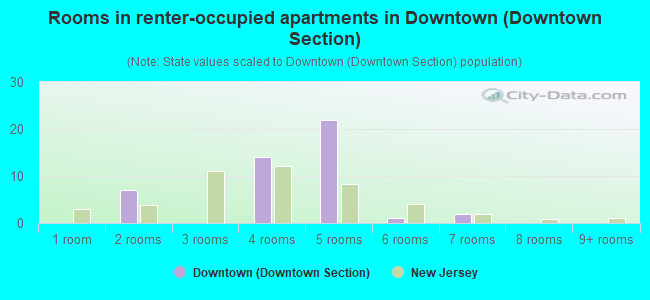
- Rooms in renter-occupied apartments in Downtown <
> - 01 room
- 72 rooms
- 03 rooms
- 144 rooms
- 225 rooms
- 16 rooms
- 27 rooms
- 08 rooms
- 09+ rooms
Owner-occupied
Renter-occupied
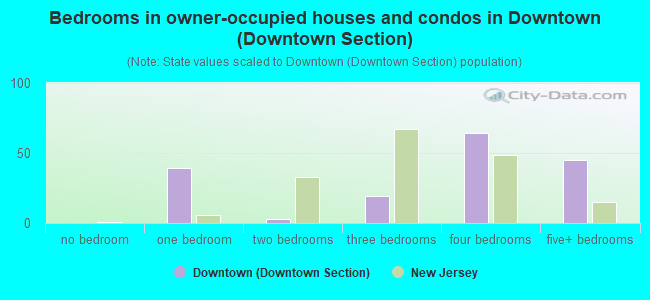
- Bedrooms in owner-occupied houses and condos in Downtown <
> - 0no bedroom
- 391 bedroom
- 32 bedrooms
- 193 bedrooms
- 644 bedrooms
- 455+ bedrooms
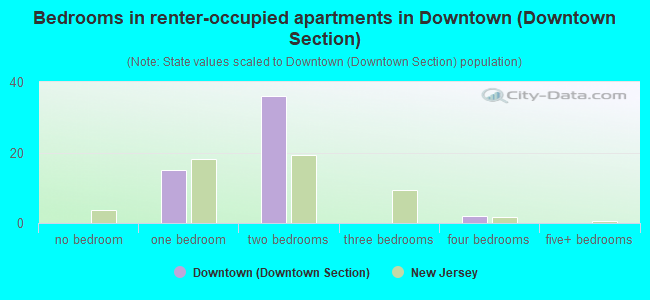
- Bedrooms in renter-occupied apartments in Downtown <
> - 0no bedroom
- 151 bedroom
- 362 bedrooms
- 03 bedrooms
- 24 bedrooms
- 05+ bedrooms
Average number of cars or other vehicles available in houses/condos:
Average number of cars or other vehicles available in apartments:
| This neighborhood: | 1.8 |
| New Jersey: | 2.0 |
Average number of cars or other vehicles available in apartments:
| Here: | |
| New Jersey: |
Percentage of units with a mortgage:
| Downtown (Downtown Section): | 68.3% |
| New Jersey: | 63.3% |
Average estimated value of detached houses in 2022 (75.2% of all units):
| Downtown (Downtown Section): | $669,274 |
| New Jersey: | $537,591 |
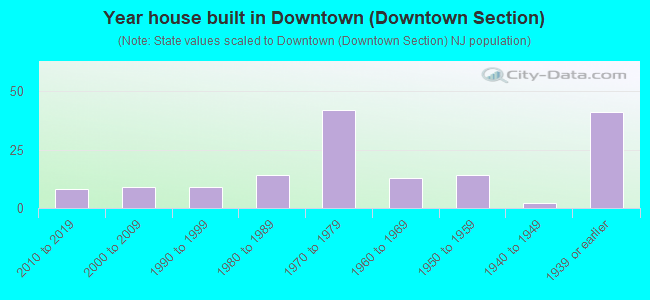
- Year house built in Downtown <
> - 02020 or later
- 82010 to 2019
- 92000 to 2009
- 91990 to 1999
- 141980 to 1989
- 421970 to 1979
- 131960 to 1969
- 141950 to 1959
- 21940 to 1949
- 411939 or earlier
City-data.com crime index for place in 2020 (higher means more crime):
| City: | 12.6 |
| U.S. average: | 219.5 |
Travel time to work (commute)
![Travel time to work (commute)]()
- 1Less than 5 minutes
- 85 to 9 minutes
- 810 to 14 minutes
- 2615 to 19 minutes
- 2120 to 24 minutes
- 1025 to 29 minutes
- 2230 to 34 minutes
- 335 to 39 minutes
- 440 to 44 minutes
- 845 to 59 minutes
- 860 to 89 minutes
- 1390 or more minutes

Means of transportation to work
![Means of transportation to work]()
- 69.0%116Drove a car alone
- 10.1%17Carpooled
- 2.4%4Subway or elevated rail
- 10.7%18Long-distance train or commuter rail
- 18.4%31Walked
- 5.9%10Other means
- 18.4%31Worked at home

Time leaving home to go to work
![Time leaving home to go to work]()
- 45:00 a.m. to 5:29 a.m.
- 15:30 a.m. to 5:59 a.m.
- 76:00 a.m. to 6:29 a.m.
- 76:30 a.m. to 6:59 a.m.
- 187:00 a.m. to 7:29 a.m.
- 297:30 a.m. to 7:59 a.m.
- 288:00 a.m. to 8:29 a.m.
- 198:30 a.m. to 8:59 a.m.
- 79:00 a.m. to 9:59 a.m.
- 310:00 a.m. to 10:59 a.m.
- 411:00 a.m. to 11:59 a.m.
- 312:00 p.m. to 3:59 p.m.
- 14:00 p.m. to 11:59 p.m.

Occupations of males:
- Percentage of males in management occupations (except farmers):
Here: 9.2% New Jersey: 13.9%
- Percentage of males in business and financial operations occupations:
Here: 37.1% New Jersey: 6.9%
- Percentage of males in computer and mathematical occupations:
Here: 5.2% New Jersey: 6.5%
- Percentage of males in life, physical, and social science occupations:
Here: 2.7% New Jersey: 1.2%
- Percentage of males in education, training, and library occupations:
Here: 2.4% New Jersey: 3.6%
- Percentage of males in arts, design, entertainment, sports, and media occupations:
Here: 4.3% New Jersey: 2.0%
- Percentage of males in service occupations:
Here: 13.7% New Jersey: 12.9%
- Percentage of males in sales and office occupations:
Here: 11.7% New Jersey: 15.3%
- Percentage of males in construction, extraction, and maintenance occupations:
Here: 11.3% New Jersey: 8.1%
- Percentage of males in material moving occupations:
Here: 11.1% New Jersey: 4.7%
Occupations of females:
- Percentage of females in management occupations (except farmers):
Here: 21.7% New Jersey: 10.4%
- Percentage of females in community and social services occupations:
Here: 10.7% New Jersey: 2.6%
- Percentage of females in education, training, and library occupations:
Here: 12.5% New Jersey: 11.4%
- Percentage of females in healthcare practitioners and technical occupations:
Here: 16.8% New Jersey: 9.6%
- Percentage of females in sales and office occupations:
Here: 9.1% New Jersey: 26.7%
- Percentage of females in production occupations:
Here: 26.5% New Jersey: 2.7%
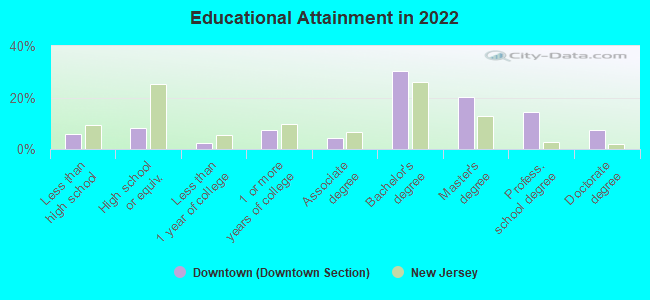
Education in this neighborhood (subdivision or community):
- Percentage of people 3 years and older in K-12 schools:
Downtown (Downtown Section): 17.3% New Jersey: 16.6%
- Percentage of people 3 years and older in undergraduate colleges:
Downtown (Downtown Section): 8.7% New Jersey: 4.9%
- Percentage of people 3 years and older in grad. or professional schools:
Downtown (Downtown Section): 7.7% New Jersey: 1.6%
- Percentage of students K-12 enrolled in private schools:
Downtown (Downtown Section): 19.2% New Jersey: 12.7%
Percentage of population below poverty level:
| Downtown (Downtown Section): | 1.8% |
| New Jersey: | 9.7% |
Median year owner moved in (as recorded in 2022):
| Downtown (Downtown Section): | 2002 |
| New Jersey: | 2008 |
Percentage of married-couple families with both working:
| Downtown (Downtown Section): | 204.3% |
| New Jersey: | 72.0% |
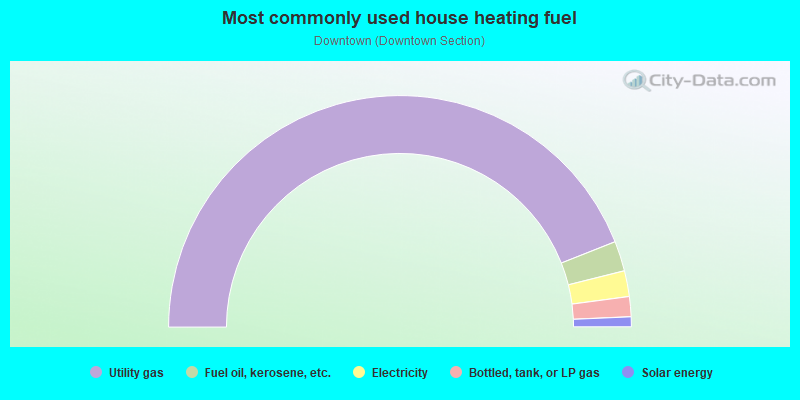
- 88.1%Utility gas
- 4.2%Fuel oil, kerosene, etc.
- 3.6%Electricity
- 2.8%Bottled, tank, or LP gas
- 1.4%Solar energy
Roads and streets:
Other features:
Passaic Riv (Passaic Riv)
Length: 0.01 miles
Directions: N-S, SE-NW
Directions: N-S, SE-NW
Roads and streets:
State Rte 512 (Springfield Ave)
Length: 1.17 miles
Directions: E-W, SW-NE
Address range: 339 to 745
Directions: E-W, SW-NE
Address range: 339 to 745
Washington St
Length: 0.73 miles
Direction: E-W
Address range: 73 to 348
Direction: E-W
Address range: 73 to 348
Sherman Ave
Length: 0.55 miles
Directions: E-W, SE-NW
Address range: 2 to 230
Directions: E-W, SE-NW
Address range: 2 to 230
Lone Pine Dr
Length: 0.23 miles
Directions: E-W, SE-NW
Directions: E-W, SE-NW
Snyder Ave
Length: 0.17 miles
Direction: SE-NW
Address range: 96 to 160
Direction: SE-NW
Address range: 96 to 160
Plainfield Ave
Length: 0.16 miles
Direction: SE-NW
Address range: 100 to 126
Direction: SE-NW
Address range: 100 to 126
River Rd
Length: 0.13 miles
Direction: SE-NW
Address range: 43 to 99
Direction: SE-NW
Address range: 43 to 99
Passaic Ave
Length: 0.12 miles
Direction: SE-NW
Address range: 91 to 140
Direction: SE-NW
Address range: 91 to 140
Summit Ave
Length: 0.12 miles
Direction: SE-NW
Address range: 101 to 154
Direction: SE-NW
Address range: 101 to 154
Station St
Length: 0.12 miles
Direction: SE-NW
Address range: 78 to 198
Direction: SE-NW
Address range: 78 to 198
Lincoln St
Length: 0.12 miles
Direction: E-W
Address range: 54 to 99
Direction: E-W
Address range: 54 to 99
Railroad features:
Norfolk Southern Rlwy (Conrail RR)
Length: 0.42 miles
Directions: E-W, SW-NE
Directions: E-W, SW-NE
Other features:
Passaic Riv (Passaic Riv)
Length: 0.01 miles
Directions: N-S, SE-NW
Directions: N-S, SE-NW