Creston neighborhood in Trenton, New Jersey (NJ), 08619 detailed profile
Settings
X


Business Search - 14 Million verified businesses
Area: 0.264 square miles
Population: 1,080
Population density:
| Creston: | 4,094 people per square mile |
| Trenton: | 11,709 people per square mile |

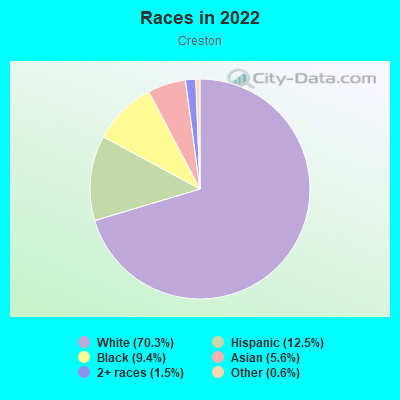
- 76470.3%White
- 13612.5%Hispanic or Latino
- 1029.4%Black
- 615.6%Asian
- 161.5%Two or more races
- 70.6%Some other race
Median household income in 2022:
| Creston: | $111,082 |
| Trenton: | $52,508 |
Distribution of median household income
![Distribution of median household income]()
- 21Less than $10,000
- 16$10,000 to $19,999
- 28$20,000 to $29,999
- 90$30,000 to $39,999
- 21$40,000 to $49,999
- 79$50,000 to $59,999
- 26$60,000 to $74,999
- 86$75,000 to $99,999
- 80$100,000 to $124,999
- 29$125,000 to $149,999
- 28$150,000 to $199,999
- 32$200,000 or more

Distribution of owner-occupied house/condo value
![Distribution of owner-occupied house/condo value]()
- 7Less than $50,000
- 2$50,000 to $99,999
- 31$100,000 to $149,999
- 16$150,000 to $199,999
- 64$200,000 to $249,999
- 83$250,000 to $299,999
- 49$300,000 to $399,999
- 13$400,000 to $499,999
- 45$500,000 to $749,999
- 7$1,000,000 or more

Distribution of rent paid by renters
![Distribution of rent paid by renters]()
- 5$300 to $399
- 19$900 to $999
- 10$1,000 to $1,249
- 155$1,250 to $1,499
- 60$1,500 to $1,999
- 16$2,000 or more

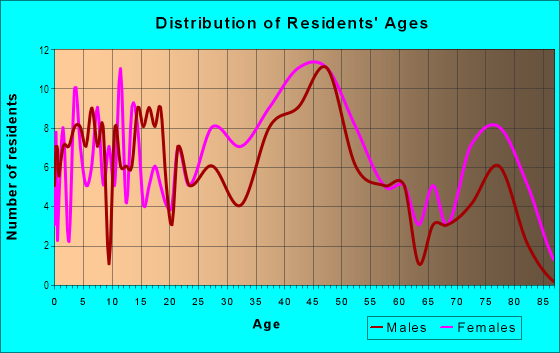
| Males: | 460 |
| Females: | 620 |
Males:
| This neighborhood: | 45.3 years |
| Whole city: | 35.5 years |
| This neighborhood: | 51.1 years |
| Whole city: | 32.1 years |
Average household size:
| Creston: | 14.0 people |
| Trenton: | 2.9 people |
Percentage of family households:
| Creston: | 49.6% |
| Trenton: | 48.7% |
| Here: | 49.2% |
| Trenton: | 25.8% |
Percentage of married-couple families with children (among all households):
| Creston: | 29.5% |
| Trenton: | 11.8% |
Percentage of single-mother households (among all households):
| Creston: | 11.7% |
| Trenton: | 15.3% |
Percentage of never married males 15 years old and over:
Percentage of never married females 15 years old and over:
| Creston: | 8.7% |
| Trenton: | 27.3% |
Percentage of never married females 15 years old and over:
| Creston: | 14.7% |
| city: | 22.6% |
Percentage of people that speak English not well or not at all:
| Creston: | 1.3% |
| Trenton: | 14.2% |
Percentage of people born in this state:
Percentage of people born in another U.S. state:
Percentage of native residents but born outside the U.S.:
Percentage of foreign born residents:
| Here: | 67.5% |
| Trenton: | 47.4% |
Percentage of people born in another U.S. state:
| Creston: | 25.2% |
| Trenton: | 11.5% |
Percentage of native residents but born outside the U.S.:
| Here: | 0.3% |
| city: | 7.1% |
Percentage of foreign born residents:
| Here: | 7.0% |
| Trenton: | 33.9% |
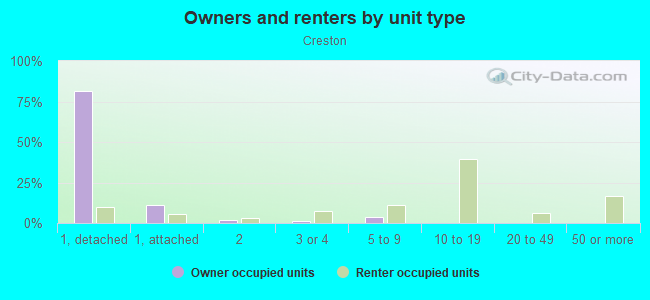
Owner-occupied
Renter-occupied

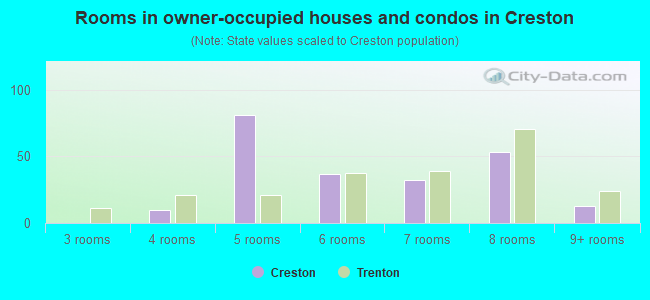
- Rooms in owner-occupied houses and condos in Creston
- 01 room
- 02 rooms
- 03 rooms
- 104 rooms
- 815 rooms
- 376 rooms
- 327 rooms
- 538 rooms
- 139+ rooms
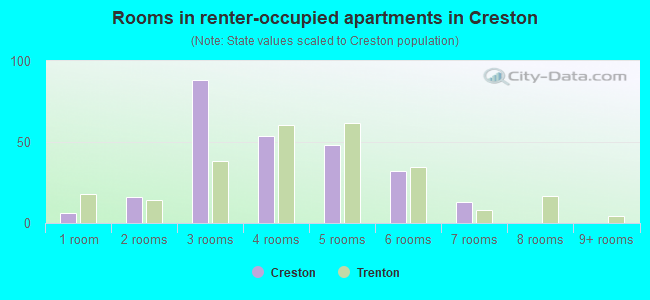
- Rooms in renter-occupied apartments in Creston
- 61 room
- 162 rooms
- 883 rooms
- 544 rooms
- 485 rooms
- 326 rooms
- 137 rooms
- 08 rooms
- 09+ rooms
Owner-occupied
Renter-occupied
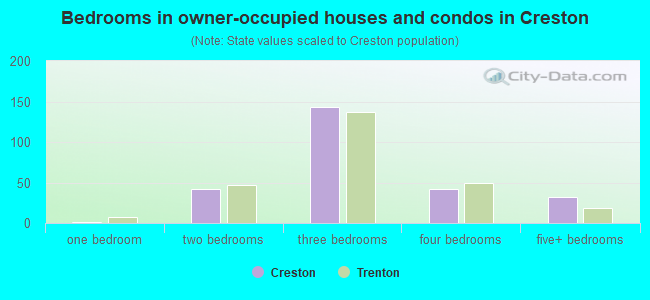
- Bedrooms in owner-occupied houses and condos in Creston
- 0no bedroom
- 11 bedroom
- 422 bedrooms
- 1433 bedrooms
- 424 bedrooms
- 325+ bedrooms
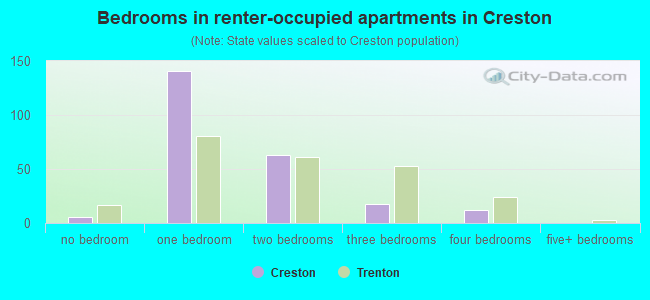
- Bedrooms in renter-occupied apartments in Creston
- 6no bedroom
- 1411 bedroom
- 632 bedrooms
- 183 bedrooms
- 124 bedrooms
- 05+ bedrooms
Average number of cars or other vehicles available in houses/condos:
Average number of cars or other vehicles available in apartments:
| This neighborhood: | 1.6 |
| Trenton: | 2.0 |
Average number of cars or other vehicles available in apartments:
| Here: | 1.6 |
| city: | 0.9 |
Percentage of units with a mortgage:
| Creston: | 75.1% |
| Trenton: | 53.8% |
Average estimated value of detached houses in 2022 (53.0% of all units):
| Creston: | $295,880 |
| Trenton: | $325,819 |
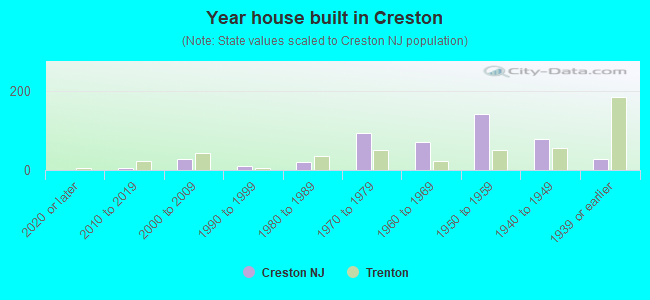
- Year house built in Creston
- 02020 or later
- 62010 to 2019
- 272000 to 2009
- 91990 to 1999
- 211980 to 1989
- 941970 to 1979
- 701960 to 1969
- 1421950 to 1959
- 791940 to 1949
- 271939 or earlier
City-data.com crime index for city in 2020 (higher means more crime):
| City: | 500.5 |
| U.S. average: | 219.5 |
Travel time to work (commute)
![Travel time to work (commute)]()
- 20Less than 5 minutes
- 755 to 9 minutes
- 8310 to 14 minutes
- 10515 to 19 minutes
- 10120 to 24 minutes
- 1925 to 29 minutes
- 4130 to 34 minutes
- 635 to 39 minutes
- 4640 to 44 minutes
- 1145 to 59 minutes
- 3560 to 89 minutes
- 1190 or more minutes

Means of transportation to work
![Means of transportation to work]()
- 80.9%398Drove a car alone
- 4.3%21Carpooled
- 1.0%5Bus
- 3.0%15Long-distance train or commuter rail
- 1.2%6Taxi
- 1.8%9Motorcycle
- 0.6%3Walked
- 1.6%8Other means
- 14.6%72Worked at home

Time leaving home to go to work
![Time leaving home to go to work]()
- 612:00 a.m. to 4:59 a.m.
- 85:00 a.m. to 5:29 a.m.
- 615:30 a.m. to 5:59 a.m.
- 516:00 a.m. to 6:29 a.m.
- 556:30 a.m. to 6:59 a.m.
- 667:00 a.m. to 7:29 a.m.
- 907:30 a.m. to 7:59 a.m.
- 538:00 a.m. to 8:29 a.m.
- 378:30 a.m. to 8:59 a.m.
- 389:00 a.m. to 9:59 a.m.
- 510:00 a.m. to 10:59 a.m.
- 311:00 a.m. to 11:59 a.m.
- 4212:00 p.m. to 3:59 p.m.
- 354:00 p.m. to 11:59 p.m.

Occupations of males:
- Percentage of males in management occupations (except farmers):
Here: 11.8% city: 5.8%
- Percentage of males in business and financial operations occupations:
Here: 6.6% city: 2.1%
- Percentage of males in computer and mathematical occupations:
Here: 6.2% city: 1.2%
- Percentage of males in education, training, and library occupations:
Here: 3.0% city: 2.5%
- Percentage of males in arts, design, entertainment, sports, and media occupations:
Here: 12.1% city: 1.3%
- Percentage of males in healthcare practitioners and technical occupations:
Here: 2.4% city: 1.0%
- Percentage of males in service occupations:
Here: 19.8% city: 26.4%
- Percentage of males in sales and office occupations:
Here: 8.1% city: 9.1%
- Percentage of males in construction, extraction, and maintenance occupations:
Here: 8.1% city: 13.2%
- Percentage of males in production occupations:
Here: 7.5% city: 8.6%
- Percentage of males in transportation occupations:
Here: 5.7% city: 10.2%
- Percentage of males in material moving occupations:
Here: 3.0% city: 10.1%
Occupations of females:
- Percentage of females in management occupations (except farmers):
Here: 4.0% city: 5.1%
- Percentage of females in business and financial operations occupations:
Here: 8.9% city: 3.3%
- Percentage of females in computer and mathematical occupations:
Here: 3.8% city: 1.9%
- Percentage of females in architecture and engineering occupations:
Here: 1.8% city: 0.0%
- Percentage of females in community and social services occupations:
Here: 2.7% city: 3.2%
- Percentage of females in education, training, and library occupations:
Here: 18.0% city: 6.6%
- Percentage of females in service occupations:
Here: 15.2% city: 30.2%
- Percentage of females in sales and office occupations:
Here: 39.1% city: 28.8%
- Percentage of females in transportation occupations:
Here: 4.4% city: 3.2%
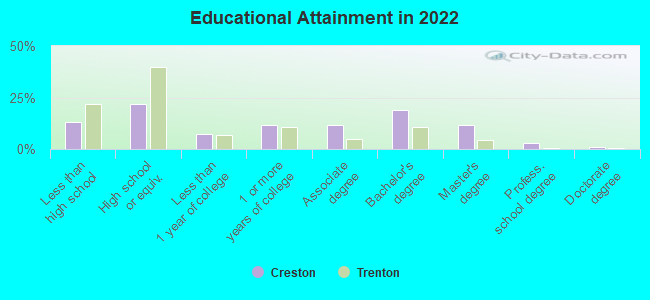
Education in this neighborhood (subdivision or community):
- Percentage of people 3 years and older in K-12 schools:
Creston: 22.4% Trenton: 18.5%
- Percentage of people 3 years and older in undergraduate colleges:
Creston: 4.1% Trenton: 3.7%
- Percentage of people 3 years and older in grad. or professional schools:
Creston: 0.8% Trenton: 0.4%
- Percentage of students K-12 enrolled in private schools:
Creston: 41.0% Trenton: 5.9%
Percentage of population below poverty level:
| Creston: | 3.5% |
| Trenton: | 20.7% |
Median year owner moved in (as recorded in 2022):
| Creston: | 2003 |
| Trenton: | 2007 |
Percentage of married-couple families with both working:
| Creston: | 47.7% |
| Trenton: | 69.9% |
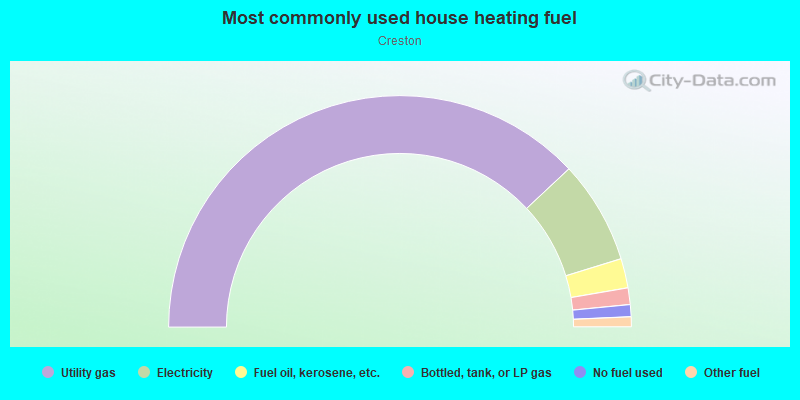
- 76.0%Utility gas
- 14.4%Electricity
- 4.1%Fuel oil, kerosene, etc.
- 2.3%Bottled, tank, or LP gas
- 1.7%No fuel used
- 1.4%Other fuel
Limited-access highways (interstate or state) in this neighborhood:
I- 295
Length: 0.39 miles
Direction: N-S
Direction: N-S
Highways in this neighborhood:
Nottingham Way (State Rte 33)
Length: 0.93 miles
Direction: E-W
Address range: 1 to 2609
Direction: E-W
Address range: 1 to 2609
Roads and streets:
Eaton Ave
Length: 0.62 miles
Directions: E-W, N-S
Address range: 1 to 336
Directions: E-W, N-S
Address range: 1 to 336
Lowell Ave
Length: 0.54 miles
Direction: E-W
Address range: 1 to 399
Direction: E-W
Address range: 1 to 399
Elmore Ave
Length: 0.51 miles
Direction: E-W
Address range: 1 to 299
Direction: E-W
Address range: 1 to 299
Erie Ave
Length: 0.51 miles
Directions: E-W, N-S, SW-NE
Address range: 1 to 499
Directions: E-W, N-S, SW-NE
Address range: 1 to 499
Fenwood Ave
Length: 0.47 miles
Direction: E-W
Address range: 1 to 399
Direction: E-W
Address range: 1 to 399
Grayson Ave
Length: 0.37 miles
Direction: N-S
Address range: 1 to 299
Direction: N-S
Address range: 1 to 299
Saybrook Ave
Length: 0.36 miles
Directions: N-S, SE-NW
Address range: 1 to 299
Directions: N-S, SE-NW
Address range: 1 to 299
Crescent Ave
Length: 0.36 miles
Direction: N-S
Address range: 1 to 499
Direction: N-S
Address range: 1 to 499
Natrona Ave
Length: 0.33 miles
Directions: E-W, N-S, SE-NW, SW-NE
Address range: 1 to 299
Directions: E-W, N-S, SE-NW, SW-NE
Address range: 1 to 299
Winslow Ave
Length: 0.29 miles
Direction: N-S
Address range: 1 to 399
Direction: N-S
Address range: 1 to 399
Hamilton Ave
Length: 0.23 miles
Directions: E-W, SW-NE
Address range: 2504 to 2699
Directions: E-W, SW-NE
Address range: 2504 to 2699
Clifford Ave
Length: 0.22 miles
Directions: N-S, SE-NW
Address range: 1 to 408
Directions: N-S, SE-NW
Address range: 1 to 408
White Horse Ave (Mercerville-Whitehorse Rd, Whitehorse Mercerville Rd)
Length: 0.03 miles
Direction: N-S
Address range: 2425 to 2499
Direction: N-S
Address range: 2425 to 2499
Other features:
Branch of Pond Run
Length: 0.09 miles
Direction: E-W
Direction: E-W
Pond Run Br
Length: 0.08 miles
Direction: E-W
Direction: E-W