Cooper Grant neighborhood in Camden, New Jersey (NJ), 08102 detailed profile
Settings
X

Business Search - 14 Million verified businesses
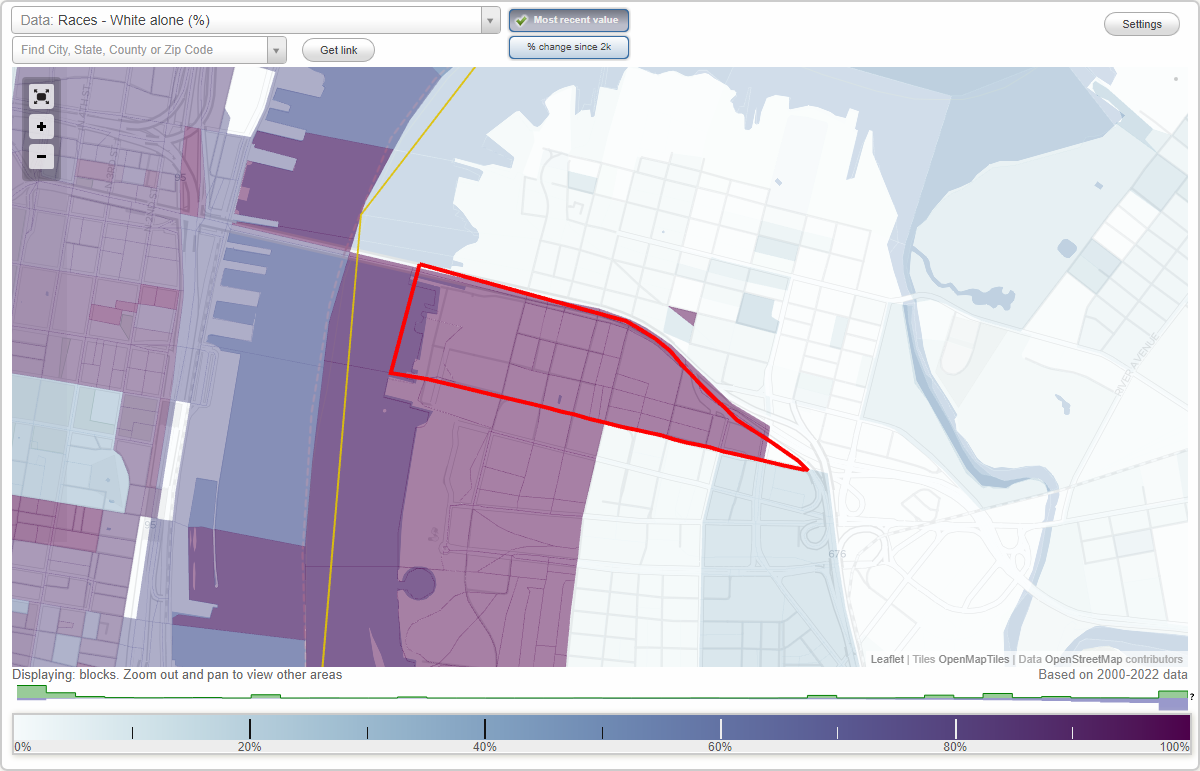
Area: 0.175 square miles
Population: 2,979
Population density:
| Cooper Grant: | 16,984 people per square mile |
| Camden: | 8,048 people per square mile |

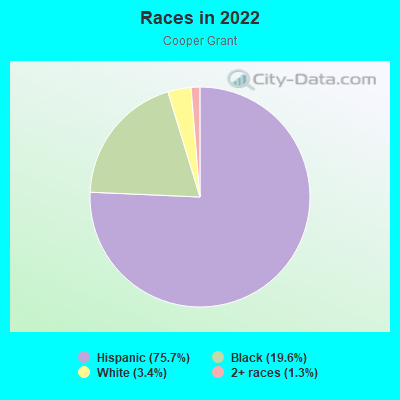
- 2,28175.7%Hispanic or Latino
- 59019.6%Black
- 1033.4%White
- 391.3%Two or more races
Median household income in 2022:
| Cooper Grant: | $30,320 |
| Camden: | $37,075 |
Distribution of median household income
![Distribution of median household income]()
- 228Less than $10,000
- 395$10,000 to $19,999
- 76$20,000 to $29,999
- 34$30,000 to $39,999
- 167$40,000 to $49,999
- 56$50,000 to $59,999
- 310$60,000 to $74,999
- 66$75,000 to $99,999
- 10$100,000 to $124,999
- 18$125,000 to $149,999
- 75$150,000 to $199,999
- 53$200,000 or more

Distribution of owner-occupied house/condo value
![Distribution of owner-occupied house/condo value]()
- 32Less than $50,000
- 352$50,000 to $99,999
- 66$100,000 to $149,999
- 2$150,000 to $199,999
- 10$200,000 to $249,999
- 5$250,000 to $299,999

Distribution of rent paid by renters
![Distribution of rent paid by renters]()
- 194Less than $100
- 269$100 to $199
- 111$200 to $299
- 53$300 to $399
- 43$400 to $499
- 54$500 to $599
- 9$600 to $699
- 110$700 to $799
- 147$800 to $899
- 43$900 to $999
- 310$1,000 to $1,249
- 7$1,250 to $1,499

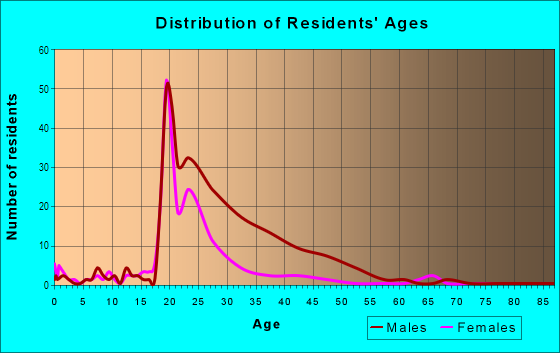
| Males: | 1,406 |
| Females: | 1,573 |
Males:
| This neighborhood: | 28.6 years |
| Whole city: | 34.6 years |
| This neighborhood: | 36.4 years |
| Whole city: | 31.1 years |
Average household size:
| Cooper Grant: | 3.2 people |
| Camden: | 2.8 people |
Percentage of family households:
| Cooper Grant: | 56.4% |
| Camden: | 47.8% |
| Here: | 16.6% |
| Camden: | 18.3% |
Percentage of married-couple families with children (among all households):
| Cooper Grant: | 9.6% |
| Camden: | 7.7% |
Percentage of single-mother households (among all households):
| Cooper Grant: | 22.4% |
| Camden: | 22.8% |
Percentage of never married males 15 years old and over:
Percentage of never married females 15 years old and over:
| Cooper Grant: | 26.5% |
| Camden: | 29.9% |
Percentage of never married females 15 years old and over:
| Cooper Grant: | 28.9% |
| city: | 32.7% |
Percentage of people that speak English not well or not at all:
| Cooper Grant: | 13.0% |
| Camden: | 13.9% |
Percentage of people born in this state:
Percentage of people born in another U.S. state:
Percentage of native residents but born outside the U.S.:
Percentage of foreign born residents:
| Here: | 47.3% |
| Camden: | 55.2% |
Percentage of people born in another U.S. state:
| Cooper Grant: | 20.3% |
| Camden: | 13.0% |
Percentage of native residents but born outside the U.S.:
| Here: | 19.2% |
| city: | 8.9% |
Percentage of foreign born residents:
| Here: | 13.2% |
| Camden: | 22.8% |
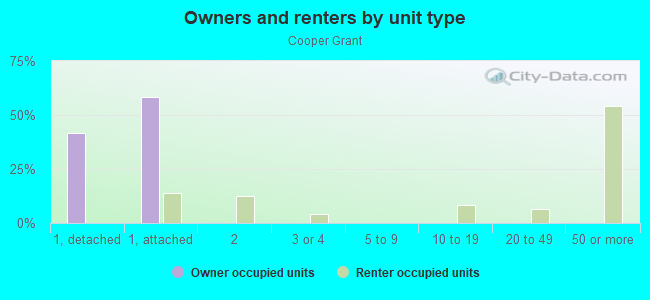
Owner-occupied
Renter-occupied

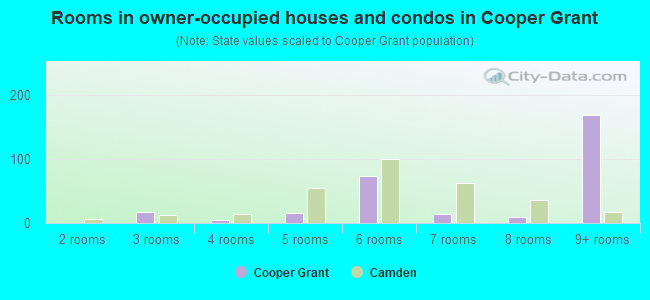
- Rooms in owner-occupied houses and condos in Cooper Grant
- 01 room
- 02 rooms
- 173 rooms
- 44 rooms
- 155 rooms
- 746 rooms
- 147 rooms
- 108 rooms
- 1699+ rooms
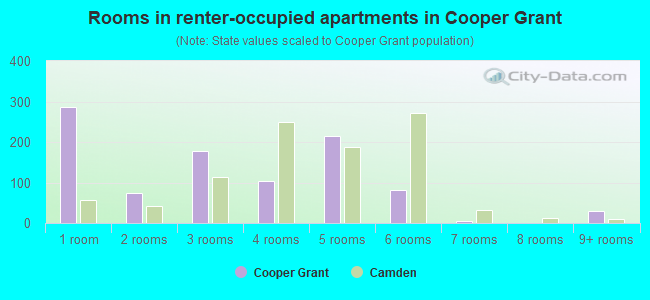
- Rooms in renter-occupied apartments in Cooper Grant
- 2871 room
- 752 rooms
- 1773 rooms
- 1044 rooms
- 2155 rooms
- 826 rooms
- 57 rooms
- 08 rooms
- 299+ rooms
Owner-occupied
Renter-occupied
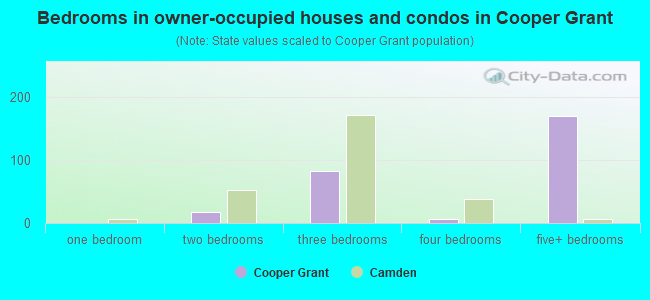
- Bedrooms in owner-occupied houses and condos in Cooper Grant
- 0no bedroom
- 01 bedroom
- 172 bedrooms
- 823 bedrooms
- 74 bedrooms
- 1695+ bedrooms
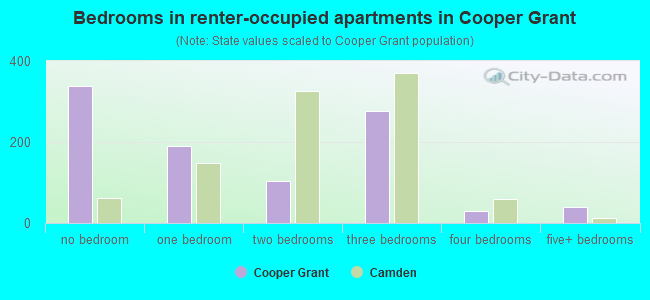
- Bedrooms in renter-occupied apartments in Cooper Grant
- 339no bedroom
- 1901 bedroom
- 1042 bedrooms
- 2773 bedrooms
- 294 bedrooms
- 405+ bedrooms
Average number of cars or other vehicles available in houses/condos:
Average number of cars or other vehicles available in apartments:
| This neighborhood: | 8.9 |
| Camden: | 1.5 |
Average number of cars or other vehicles available in apartments:
| Here: | 0.6 |
| city: | 0.7 |
Percentage of units with a mortgage:
| Cooper Grant: | 81.7% |
| Camden: | 55.0% |
Housing prices:
- Average estimated value of detached houses in 2022 (7.0% of all units):
Cooper Grant: $82,855 New Jersey: $537,591
- Average estimated value of townhouses or other attached units in 2022 (24.6% of all units):
This neighborhood: $72,440 New Jersey: $381,113
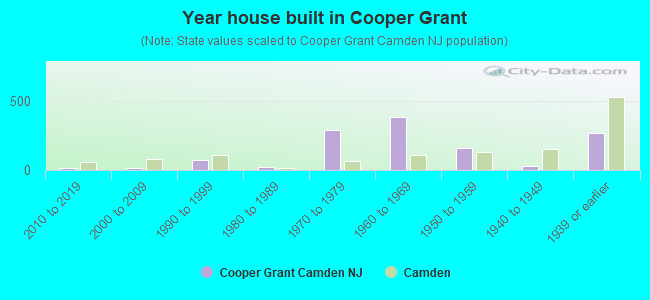
- Year house built in Cooper Grant
- 02020 or later
- 142010 to 2019
- 122000 to 2009
- 691990 to 1999
- 211980 to 1989
- 2881970 to 1979
- 3781960 to 1969
- 1601950 to 1959
- 261940 to 1949
- 2681939 or earlier
City-data.com crime index for city in 2020 (higher means more crime):
| City: | 569.3 |
| U.S. average: | 219.5 |
Travel time to work (commute)
![Travel time to work (commute)]()
- 19Less than 5 minutes
- 395 to 9 minutes
- 9010 to 14 minutes
- 1915 to 19 minutes
- 620 to 24 minutes
- 625 to 29 minutes
- 5330 to 34 minutes
- 335 to 39 minutes
- 2840 to 44 minutes
- 2045 to 59 minutes
- 3760 to 89 minutes
- 2290 or more minutes

Means of transportation to work
![Means of transportation to work]()
- 49.6%386Drove a car alone
- 33.6%261Carpooled
- 2.3%18Bus
- 9.1%71Subway or elevated rail
- 2.1%16Long-distance train or commuter rail
- 1.0%8Light rail, streetcar or trolley
- 4.4%34Taxi
- 1.4%11Bicycle
- 5.9%46Walked
- 0.6%5Other means
- 1.2%9Worked at home

Time leaving home to go to work
![Time leaving home to go to work]()
- 912:00 a.m. to 4:59 a.m.
- 95:00 a.m. to 5:29 a.m.
- 85:30 a.m. to 5:59 a.m.
- 426:00 a.m. to 6:29 a.m.
- 96:30 a.m. to 6:59 a.m.
- 987:00 a.m. to 7:29 a.m.
- 347:30 a.m. to 7:59 a.m.
- 178:00 a.m. to 8:29 a.m.
- 148:30 a.m. to 8:59 a.m.
- 339:00 a.m. to 9:59 a.m.
- 1611:00 a.m. to 11:59 a.m.
- 5812:00 p.m. to 3:59 p.m.
- 224:00 p.m. to 11:59 p.m.

Occupations of males:
- Percentage of males in management occupations (except farmers):
Here: 1.1% city: 4.2%
- Percentage of males in computer and mathematical occupations:
Here: 2.2% city: 1.2%
- Percentage of males in service occupations:
Here: 21.3% city: 21.0%
- Percentage of males in sales and office occupations:
Here: 35.0% city: 12.1%
- Percentage of males in production occupations:
Here: 2.0% city: 8.6%
- Percentage of males in transportation occupations:
Here: 9.5% city: 10.4%
- Percentage of males in material moving occupations:
Here: 30.1% city: 20.5%
Occupations of females:
- Percentage of females in management occupations (except farmers):
Here: 3.4% city: 4.7%
- Percentage of females in community and social services occupations:
Here: 5.5% city: 3.7%
- Percentage of females in education, training, and library occupations:
Here: 4.7% city: 5.8%
- Percentage of females in arts, design, entertainment, sports, and media occupations:
Here: 2.2% city: 1.2%
- Percentage of females in service occupations:
Here: 55.0% city: 31.6%
- Percentage of females in sales and office occupations:
Here: 9.6% city: 25.7%
- Percentage of females in construction, extraction, and maintenance occupations:
Here: 1.2% city: 0.4%
- Percentage of females in production occupations:
Here: 6.5% city: 5.8%
- Percentage of females in transportation occupations:
Here: 23.8% city: 1.7%
- Percentage of females in material moving occupations:
Here: 14.6% city: 9.9%
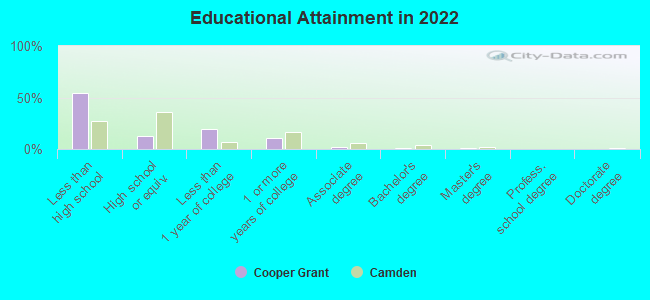
Education in this neighborhood (subdivision or community):
- Percentage of people 3 years and older in K-12 schools:
Cooper Grant: 21.9% Camden: 21.9%
- Percentage of people 3 years and older in undergraduate colleges:
Cooper Grant: 8.9% Camden: 4.3%
- Percentage of people 3 years and older in grad. or professional schools:
Cooper Grant: 0.2% Camden: 1.1%
- Percentage of students K-12 enrolled in private schools:
Cooper Grant: 28.2% Camden: 16.6%
Percentage of population below poverty level:
| Cooper Grant: | 40.9% |
| Camden: | 29.8% |
Median year renter moved in (as recorded in 2022):
| Cooper Grant: | 2015 |
| Camden: | 2018 |
Percentage of married-couple families with both working:
| Cooper Grant: | 98.5% |
| Camden: | 59.9% |
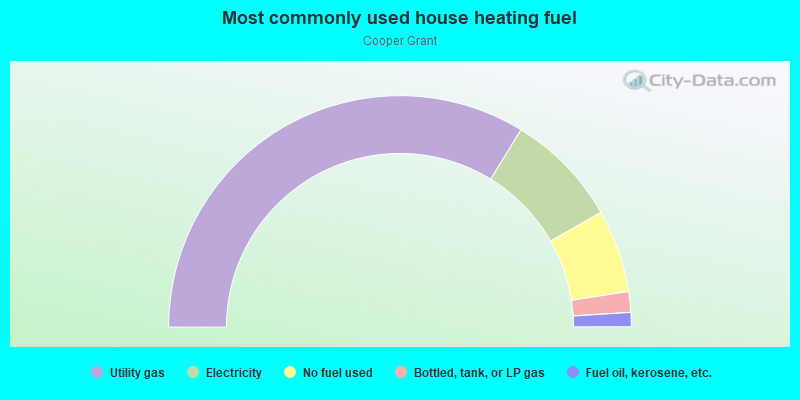
- 67.6%Utility gas
- 16.0%Electricity
- 11.6%No fuel used
- 2.9%Bottled, tank, or LP gas
- 2.0%Fuel oil, kerosene, etc.
Limited-access highways (interstate or state) in this neighborhood:
I- 676 (US Hwy 30, N South Fwy)
Length: 0.44 miles
Directions: E-W, SE-NW
Directions: E-W, SE-NW
Roads and streets:
Cooper St
Length: 0.92 miles
Direction: E-W
Address range: 1 to 899
Direction: E-W
Address range: 1 to 899
Penn St
Length: 0.76 miles
Direction: E-W
Address range: 1 to 599
Direction: E-W
Address range: 1 to 599
Pearl St
Length: 0.50 miles
Directions: E-W, SE-NW
Address range: 1 to 498
Directions: E-W, SE-NW
Address range: 1 to 498
Linden St
Length: 0.36 miles
Direction: E-W
Address range: 1 to 437
Direction: E-W
Address range: 1 to 437
Lawrence St
Length: 0.30 miles
Direction: E-W
Address range: 300 to 699
Direction: E-W
Address range: 300 to 699
N 2nd St
Length: 0.24 miles
Direction: N-S
Address range: 300 to 499
Direction: N-S
Address range: 300 to 499
N Front St
Length: 0.24 miles
Direction: N-S
Address range: 201 to 499
Direction: N-S
Address range: 201 to 499
Jersey Joe Walott Blvd (Delaware Ave)
Length: 0.23 miles
Direction: N-S
Address range: 200 to 499
Direction: N-S
Address range: 200 to 499
N 3rd St
Length: 0.23 miles
Direction: N-S
Address range: 200 to 399
Direction: N-S
Address range: 200 to 399
Friends St
Length: 0.23 miles
Direction: N-S
Address range: 200 to 499
Direction: N-S
Address range: 200 to 499
N 5th St
Length: 0.16 miles
Direction: N-S
Address range: 200 to 399
Direction: N-S
Address range: 200 to 399
Point St
Length: 0.16 miles
Directions: N-S, SW-NE
Address range: 300 to 499
Directions: N-S, SW-NE
Address range: 300 to 499
N 4th St
Length: 0.12 miles
Directions: N-S, SW-NE
Address range: 194 to 450
Directions: N-S, SW-NE
Address range: 194 to 450
Wilson St
Length: 0.10 miles
Direction: E-W
Direction: E-W
Rex Aly (Rex Pl)
Length: 0.05 miles
Direction: E-W
Address range: 508 to 518
Direction: E-W
Address range: 508 to 518
N 6th St
Length: 0.04 miles
Direction: N-S
Address range: 215 to 299
Direction: N-S
Address range: 215 to 299
Railroad features:
Penn Central RR
Length: 0.65 miles
Directions: E-W, N-S, SE-NW, SW-NE
Directions: E-W, N-S, SE-NW, SW-NE