Contee neighborhood in Laurel, Maryland (MD), 20707, 20708 detailed profile
Settings
X


Business Search - 14 Million verified businesses
Area: 0.426 square miles
Population: 2,411
Population density:
| Contee: | 5,656 people per square mile |
| Laurel: | 7,825 people per square mile |

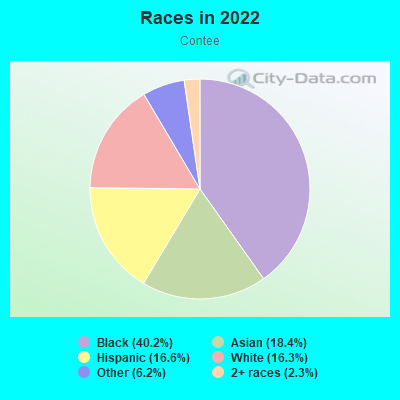
- 96740.2%Black
- 44418.4%Asian
- 40016.6%Hispanic or Latino
- 39216.3%White
- 1496.2%Some other race
- 562.3%Two or more races
Median household income in 2022:
| Contee: | $82,091 |
| Laurel: | $92,035 |
Distribution of median household income
![Distribution of median household income]()
- 125Less than $10,000
- 60$10,000 to $19,999
- 300$20,000 to $29,999
- 227$30,000 to $39,999
- 272$40,000 to $49,999
- 16$50,000 to $59,999
- 47$60,000 to $74,999
- 78$75,000 to $99,999
- 152$100,000 to $124,999
- 45$125,000 to $149,999
- 94$150,000 to $199,999
- 210$200,000 or more

Distribution of owner-occupied house/condo value
![Distribution of owner-occupied house/condo value]()
- 64$150,000 to $199,999
- 3$200,000 to $249,999
- 35$250,000 to $299,999
- 92$300,000 to $399,999
- 132$400,000 to $499,999
- 265$500,000 to $749,999

Distribution of rent paid by renters
![Distribution of rent paid by renters]()
- 12$100 to $199
- 25$300 to $399
- 8$400 to $499
- 116$1,000 to $1,249
- 62$1,250 to $1,499
- 142$1,500 to $1,999
- 19$2,000 or more

Median rent in 2022:
| Contee: | $1,645 |
| Laurel: | $1,707 |
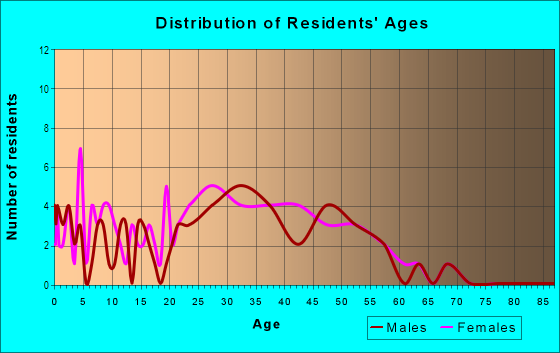
| Males: | 1,297 |
| Females: | 1,113 |
Males:
| This neighborhood: | 35.5 years |
| Whole city: | 36.3 years |
| This neighborhood: | 35.0 years |
| Whole city: | 36.4 years |
Average household size:
| Contee: | 2.4 people |
| Laurel: | 2.5 people |
Percentage of family households:
| Contee: | 56.6% |
| Laurel: | 45.9% |
| Here: | 61.9% |
| Laurel: | 36.1% |
Percentage of married-couple families with children (among all households):
| Contee: | 22.1% |
| Laurel: | 23.9% |
Percentage of single-mother households (among all households):
| Contee: | 29.6% |
| Laurel: | 14.6% |
Percentage of never married males 15 years old and over:
Percentage of never married females 15 years old and over:
| Contee: | 17.9% |
| Laurel: | 18.2% |
Percentage of never married females 15 years old and over:
| Contee: | 19.8% |
| city: | 22.7% |
Percentage of people that speak English not well or not at all:
| Contee: | 7.4% |
| Laurel: | 7.1% |
Percentage of people born in this state:
Percentage of people born in another U.S. state:
Percentage of native residents but born outside the U.S.:
Percentage of foreign born residents:
| Here: | 39.8% |
| Laurel: | 33.6% |
Percentage of people born in another U.S. state:
| Contee: | 33.0% |
| Laurel: | 36.1% |
Percentage of native residents but born outside the U.S.:
| Here: | 1.5% |
| city: | 1.4% |
Percentage of foreign born residents:
| Here: | 25.7% |
| Laurel: | 29.0% |
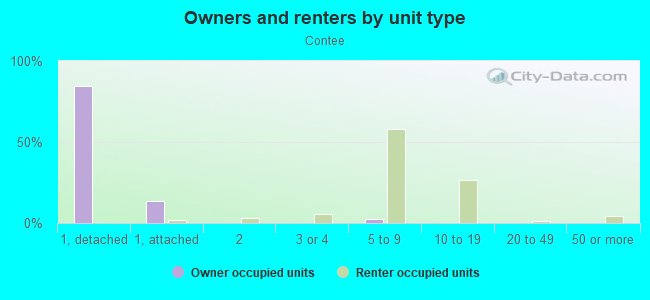
Owner-occupied
Renter-occupied

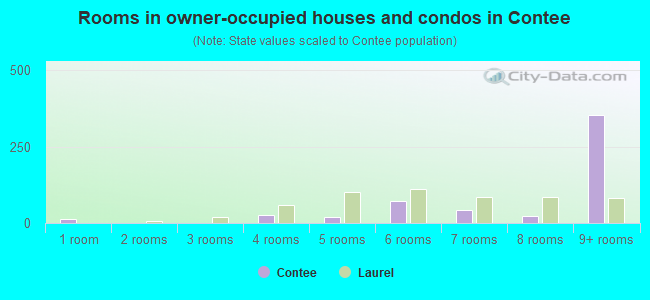
- Rooms in owner-occupied houses and condos in Contee
- 121 room
- 02 rooms
- 03 rooms
- 274 rooms
- 215 rooms
- 716 rooms
- 417 rooms
- 248 rooms
- 3539+ rooms
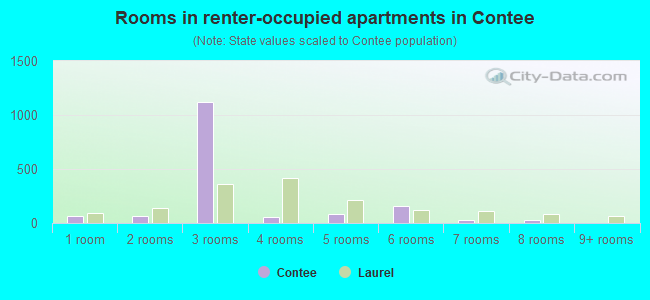
- Rooms in renter-occupied apartments in Contee
- 651 room
- 662 rooms
- 1,1253 rooms
- 534 rooms
- 805 rooms
- 1556 rooms
- 247 rooms
- 318 rooms
- 09+ rooms
Owner-occupied
Renter-occupied
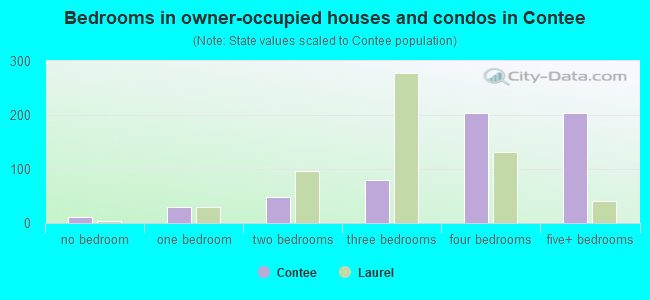
- Bedrooms in owner-occupied houses and condos in Contee
- 12no bedroom
- 301 bedroom
- 482 bedrooms
- 803 bedrooms
- 2044 bedrooms
- 2045+ bedrooms
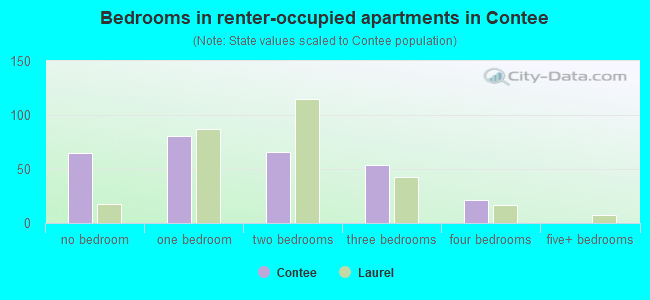
- Bedrooms in renter-occupied apartments in Contee
- 65no bedroom
- 811 bedroom
- 662 bedrooms
- 543 bedrooms
- 214 bedrooms
- 05+ bedrooms
Average number of cars or other vehicles available in houses/condos:
Average number of cars or other vehicles available in apartments:
| This neighborhood: | 3.0 |
| Laurel: | 1.8 |
Average number of cars or other vehicles available in apartments:
| Here: | 1.6 |
| city: | 1.3 |
Percentage of units with a mortgage:
| Contee: | 73.5% |
| Laurel: | 82.5% |
Average estimated value of detached houses in 2022 (72.0% of all units):
| Contee: | $516,789 |
| Maryland: | $526,819 |
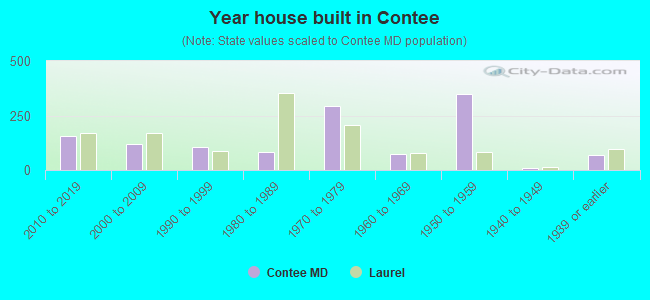
- Year house built in Contee
- 02020 or later
- 1552010 to 2019
- 1202000 to 2009
- 1051990 to 1999
- 831980 to 1989
- 2921970 to 1979
- 741960 to 1969
- 3481950 to 1959
- 91940 to 1949
- 711939 or earlier
City-data.com crime index for city in 2020 (higher means more crime):
| City: | 232.4 |
| U.S. average: | 219.5 |
Travel time to work (commute)
![Travel time to work (commute)]()
- 315 to 9 minutes
- 5710 to 14 minutes
- 6515 to 19 minutes
- 12520 to 24 minutes
- 7125 to 29 minutes
- 21130 to 34 minutes
- 635 to 39 minutes
- 6640 to 44 minutes
- 40845 to 59 minutes
- 14060 to 89 minutes
- 3990 or more minutes

Means of transportation to work
![Means of transportation to work]()
- 69.2%967Drove a car alone
- 12.4%173Carpooled
- 1.1%16Bus
- 0.1%1Subway or elevated rail
- 2.1%30Long-distance train or commuter rail
- 17.5%245Taxi
- 1.1%16Bicycle
- 2.1%30Walked
- 17.2%240Worked at home

Time leaving home to go to work
![Time leaving home to go to work]()
- 4512:00 a.m. to 4:59 a.m.
- 365:00 a.m. to 5:29 a.m.
- 725:30 a.m. to 5:59 a.m.
- 516:00 a.m. to 6:29 a.m.
- 746:30 a.m. to 6:59 a.m.
- 1257:00 a.m. to 7:29 a.m.
- 797:30 a.m. to 7:59 a.m.
- 898:00 a.m. to 8:29 a.m.
- 878:30 a.m. to 8:59 a.m.
- 759:00 a.m. to 9:59 a.m.
- 5410:00 a.m. to 10:59 a.m.
- 11811:00 a.m. to 11:59 a.m.
- 5912:00 p.m. to 3:59 p.m.
- 1614:00 p.m. to 11:59 p.m.

Occupations of males:
- Percentage of males in management occupations (except farmers):
Here: 9.8% city: 10.4%
- Percentage of males in computer and mathematical occupations:
Here: 17.5% city: 10.2%
- Percentage of males in architecture and engineering occupations:
Here: 5.3% city: 2.9%
- Percentage of males in community and social services occupations:
Here: 4.2% city: 2.4%
- Percentage of males in education, training, and library occupations:
Here: 6.2% city: 4.1%
- Percentage of males in arts, design, entertainment, sports, and media occupations:
Here: 2.0% city: 1.1%
- Percentage of males in service occupations:
Here: 13.4% city: 11.2%
- Percentage of males in sales and office occupations:
Here: 3.6% city: 14.0%
- Percentage of males in construction, extraction, and maintenance occupations:
Here: 11.6% city: 9.4%
- Percentage of males in production occupations:
Here: 9.3% city: 3.6%
- Percentage of males in transportation occupations:
Here: 13.3% city: 7.7%
- Percentage of males in material moving occupations:
Here: 3.8% city: 4.2%
Occupations of females:
- Percentage of females in management occupations (except farmers):
Here: 28.8% city: 14.6%
- Percentage of females in business and financial operations occupations:
Here: 3.2% city: 9.2%
- Percentage of females in computer and mathematical occupations:
Here: 14.9% city: 4.7%
- Percentage of females in education, training, and library occupations:
Here: 8.3% city: 9.6%
- Percentage of females in arts, design, entertainment, sports, and media occupations:
Here: 2.8% city: 1.4%
- Percentage of females in healthcare practitioners and technical occupations:
Here: 2.6% city: 11.9%
- Percentage of females in service occupations:
Here: 10.6% city: 15.4%
- Percentage of females in sales and office occupations:
Here: 19.9% city: 21.6%
- Percentage of females in construction, extraction, and maintenance occupations:
Here: 8.5% city: 0.0%
- Percentage of females in transportation occupations:
Here: 3.2% city: 0.6%
Percentage of people 16-64 in Armed Forces:
| Contee: | 0.6% |
| Laurel: | 1.2% |
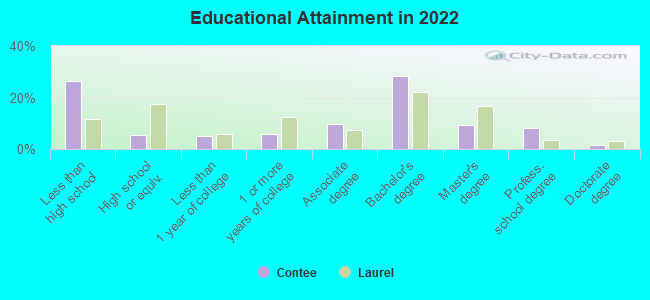
Education in this neighborhood (subdivision or community):
- Percentage of people 3 years and older in K-12 schools:
Contee: 11.6% Laurel: 16.8%
- Percentage of people 3 years and older in undergraduate colleges:
Contee: 6.6% Laurel: 6.3%
- Percentage of people 3 years and older in grad. or professional schools:
Contee: 2.9% Laurel: 3.9%
- Percentage of students K-12 enrolled in private schools:
Contee: 11.3% Laurel: 15.0%
Percentage of population below poverty level:
| Contee: | 7.8% |
| Laurel: | 10.6% |
Median year owner moved in (as recorded in 2022):
Median year renter moved in (as recorded in 2022):
| Contee: | 1998 |
| Laurel: | 2009 |
Median year renter moved in (as recorded in 2022):
| Contee: | 2018 |
| Laurel: | 2018 |
Percentage of married-couple families with both working:
| Contee: | 97.3% |
| Laurel: | 76.8% |
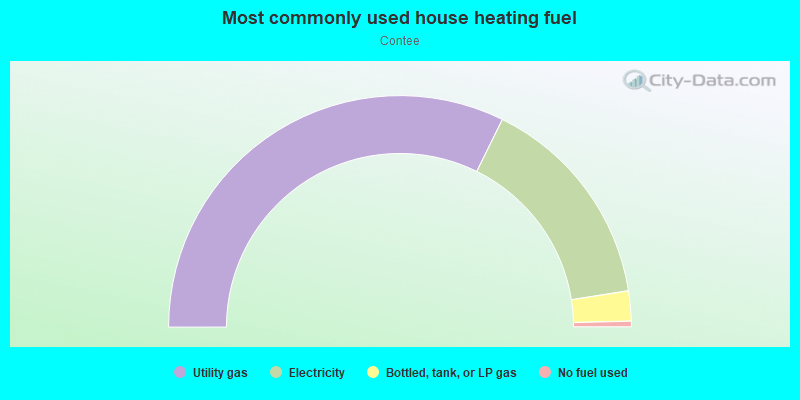
- 64.6%Utility gas
- 30.4%Electricity
- 4.2%Bottled, tank, or LP gas
- 0.8%No fuel used
Highways in this neighborhood:
Baltimore Ave (US Hwy 1)
Length: 1.33 miles
Direction: SW-NE
Address range: 13298 to 13732
Direction: SW-NE
Address range: 13298 to 13732
Roads and streets:
Contee Rd
Length: 0.76 miles
Directions: E-W, SE-NW
Address range: 7301 to 8505
Directions: E-W, SE-NW
Address range: 7301 to 8505
Contee Pl
Length: 0.14 miles
Directions: E-W, N-S, SE-NW
Address range: 13600 to 13799
Directions: E-W, N-S, SE-NW
Address range: 13600 to 13799
Academy Ln
Length: 0.13 miles
Directions: E-W, SE-NW
Address range: 7800 to 7899
Directions: E-W, SE-NW
Address range: 7800 to 7899
Braygreen Rd
Length: 0.11 miles
Direction: E-W
Address range: 7983 to 8011
Direction: E-W
Address range: 7983 to 8011
Mid Atlantic Blvd
Length: 0.07 miles
Direction: SW-NE
Direction: SW-NE
Railroad features:
Csx RR
Length: 0.73 miles
Direction: SW-NE
Direction: SW-NE