Colorado Commons neighborhood in Monrovia, California (CA), 91016 detailed profile
Settings
X


Business Search - 14 Million verified businesses
Area: 0.269 square miles
Population: 1,784
Population density:
| Colorado Commons: | 6,637 people per square mile |
| Monrovia: | 2,739 people per square mile |

- 71334.6%Hispanic or Latino
- 46922.8%White
- 30915.0%Asian
- 1386.7%Black
- 1195.8%Native Hawaiian and Other
Pacific Islander - 1155.6%American Indian
- 1014.9%Two or more races
- 964.7%Some other race

Median household income in 2022:
| Colorado Commons: | $105,564 |
| Monrovia: | $93,827 |
Distribution of median household income
![Distribution of median household income]()
- 34Less than $10,000
- 42$10,000 to $19,999
- 94$20,000 to $29,999
- 91$30,000 to $39,999
- 32$40,000 to $49,999
- 42$50,000 to $59,999
- 123$60,000 to $74,999
- 75$75,000 to $99,999
- 103$100,000 to $124,999
- 127$125,000 to $149,999
- 50$150,000 to $199,999
- 96$200,000 or more

Distribution of owner-occupied house/condo value
![Distribution of owner-occupied house/condo value]()
- 34$300,000 to $399,999
- 44$400,000 to $499,999
- 164$500,000 to $749,999
- 137$750,000 to $999,999
- 41$1,000,000 or more

Distribution of rent paid by renters
![Distribution of rent paid by renters]()
- 72$700 to $799
- 18$900 to $999
- 18$1,000 to $1,249
- 83$1,250 to $1,499
- 210$1,500 to $1,999
- 279$2,000 or more

Median rent in 2022:
| Colorado Commons: | $1,886 |
| Monrovia: | $1,836 |
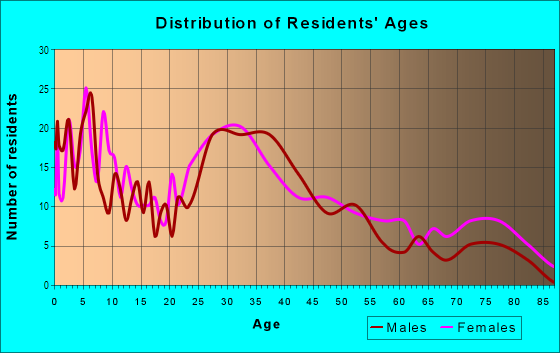
| Males: | 824 |
| Females: | 959 |
Males:
| This neighborhood: | 31.9 years |
| Whole city: | 36.5 years |
| This neighborhood: | 38.5 years |
| Whole city: | 39.9 years |
Average household size:
| Colorado Commons: | 2.8 people |
| Monrovia: | 2.8 people |
Percentage of family households:
| Colorado Commons: | 36.5% |
| Monrovia: | 50.1% |
| Here: | 24.7% |
| Monrovia: | 44.8% |
Percentage of married-couple families with children (among all households):
| Colorado Commons: | 28.4% |
| Monrovia: | 26.4% |
Percentage of single-mother households (among all households):
| Colorado Commons: | 22.4% |
| Monrovia: | 6.7% |
Percentage of never married males 15 years old and over:
Percentage of never married females 15 years old and over:
| Colorado Commons: | 25.5% |
| Monrovia: | 20.0% |
Percentage of never married females 15 years old and over:
| Colorado Commons: | 24.9% |
| city: | 17.2% |
Percentage of people that speak English not well or not at all:
| Colorado Commons: | 8.1% |
| Monrovia: | 4.8% |
Percentage of people born in this state:
Percentage of people born in another U.S. state:
Percentage of native residents but born outside the U.S.:
Percentage of foreign born residents:
| Here: | 62.7% |
| Monrovia: | 60.6% |
Percentage of people born in another U.S. state:
| Colorado Commons: | 10.6% |
| Monrovia: | 13.3% |
Percentage of native residents but born outside the U.S.:
| Here: | 0.7% |
| city: | 0.8% |
Percentage of foreign born residents:
| Here: | 26.0% |
| Monrovia: | 25.2% |

Owner-occupied
Renter-occupied


- Rooms in owner-occupied houses and condos in Colorado Commons
- 01 room
- 02 rooms
- 73 rooms
- 414 rooms
- 535 rooms
- 1466 rooms
- 217 rooms
- 308 rooms
- 949+ rooms

- Rooms in renter-occupied apartments in Colorado Commons
- 21 room
- 462 rooms
- 2973 rooms
- 1534 rooms
- 255 rooms
- 216 rooms
- 177 rooms
- 428 rooms
- 149+ rooms
Owner-occupied
Renter-occupied

- Bedrooms in owner-occupied houses and condos in Colorado Commons
- 0no bedroom
- 01 bedroom
- 1252 bedrooms
- 1003 bedrooms
- 974 bedrooms
- 05+ bedrooms

- Bedrooms in renter-occupied apartments in Colorado Commons
- 7no bedroom
- 3031 bedroom
- 2532 bedrooms
- 913 bedrooms
- 204 bedrooms
- 05+ bedrooms
Average number of cars or other vehicles available in houses/condos:
Average number of cars or other vehicles available in apartments:
| This neighborhood: | 2.2 |
| Monrovia: | 2.2 |
Average number of cars or other vehicles available in apartments:
| Here: | 1.6 |
| city: | 1.8 |
Percentage of units with a mortgage:
| Colorado Commons: | 61.6% |
| Monrovia: | 65.1% |

- Year house built in Colorado Commons
- 192020 or later
- 842010 to 2019
- 982000 to 2009
- 391990 to 1999
- 1541980 to 1989
- 851970 to 1979
- 911960 to 1969
- 871950 to 1959
- 961940 to 1949
- 651939 or earlier

City-data.com crime index for city in 2020 (higher means more crime):
| City: | 183.5 |
| U.S. average: | 219.5 |
Travel time to work (commute)
![Travel time to work (commute)]()
- 19Less than 5 minutes
- 505 to 9 minutes
- 4710 to 14 minutes
- 5315 to 19 minutes
- 13720 to 24 minutes
- 3925 to 29 minutes
- 26030 to 34 minutes
- 335 to 39 minutes
- 6740 to 44 minutes
- 14645 to 59 minutes
- 3960 to 89 minutes
- 2890 or more minutes

Means of transportation to work
![Means of transportation to work]()
- 77.9%808Drove a car alone
- 4.3%45Carpooled
- 1.6%17Subway or elevated rail
- 0.7%7Bicycle
- 3.0%31Walked
- 0.7%7Other means
- 16.0%166Worked at home

Time leaving home to go to work
![Time leaving home to go to work]()
- 8612:00 a.m. to 4:59 a.m.
- 355:00 a.m. to 5:29 a.m.
- 455:30 a.m. to 5:59 a.m.
- 496:00 a.m. to 6:29 a.m.
- 336:30 a.m. to 6:59 a.m.
- 1387:00 a.m. to 7:29 a.m.
- 1307:30 a.m. to 7:59 a.m.
- 798:00 a.m. to 8:29 a.m.
- 308:30 a.m. to 8:59 a.m.
- 439:00 a.m. to 9:59 a.m.
- 4410:00 a.m. to 10:59 a.m.
- 1811:00 a.m. to 11:59 a.m.
- 2812:00 p.m. to 3:59 p.m.
- 234:00 p.m. to 11:59 p.m.

Occupations of males:
- Percentage of males in management occupations (except farmers):
Here: 25.2% city: 12.7%
- Percentage of males in business and financial operations occupations:
Here: 6.5% city: 3.1%
- Percentage of males in computer and mathematical occupations:
Here: 8.2% city: 4.5%
- Percentage of males in architecture and engineering occupations:
Here: 1.8% city: 4.8%
- Percentage of males in life, physical, and social science occupations:
Here: 2.4% city: 1.4%
- Percentage of males in education, training, and library occupations:
Here: 2.6% city: 5.1%
- Percentage of males in arts, design, entertainment, sports, and media occupations:
Here: 5.5% city: 4.2%
- Percentage of males in service occupations:
Here: 22.4% city: 13.0%
- Percentage of males in sales and office occupations:
Here: 10.4% city: 19.9%
- Percentage of males in construction, extraction, and maintenance occupations:
Here: 11.3% city: 10.7%
- Percentage of males in production occupations:
Here: 2.9% city: 4.8%
- Percentage of males in material moving occupations:
Here: 1.5% city: 2.7%
Occupations of females:
- Percentage of females in management occupations (except farmers):
Here: 19.2% city: 13.3%
- Percentage of females in business and financial operations occupations:
Here: 4.7% city: 5.5%
- Percentage of females in computer and mathematical occupations:
Here: 6.5% city: 2.4%
- Percentage of females in life, physical, and social science occupations:
Here: 1.4% city: 1.2%
- Percentage of females in community and social services occupations:
Here: 15.1% city: 4.3%
- Percentage of females in education, training, and library occupations:
Here: 6.1% city: 11.6%
- Percentage of females in arts, design, entertainment, sports, and media occupations:
Here: 8.6% city: 4.0%
- Percentage of females in healthcare practitioners and technical occupations:
Here: 5.4% city: 9.7%
- Percentage of females in service occupations:
Here: 13.4% city: 16.1%
- Percentage of females in sales and office occupations:
Here: 19.3% city: 26.0%
Percentage of people 16-64 in Armed Forces:
| Colorado Commons: | 0.3% |
| Monrovia: | 0.1% |
Education in this neighborhood (subdivision or community):
- Percentage of people 3 years and older in K-12 schools:
Colorado Commons: 20.5% Monrovia: 16.9%
- Percentage of people 3 years and older in undergraduate colleges:
Colorado Commons: 9.9% Monrovia: 5.6%
- Percentage of people 3 years and older in grad. or professional schools:
Colorado Commons: 8.0% Monrovia: 2.0%
- Percentage of students K-12 enrolled in private schools:
Colorado Commons: 7.5% Monrovia: 10.9%
Percentage of population below poverty level:
| Colorado Commons: | 8.6% |
| Monrovia: | 10.1% |
Median year owner moved in (as recorded in 2022):
Median year renter moved in (as recorded in 2022):
| Colorado Commons: | 2005 |
| Monrovia: | 2004 |
Median year renter moved in (as recorded in 2022):
| Colorado Commons: | 2018 |
| Monrovia: | 2015 |
Percentage of married-couple families with both working:
| Colorado Commons: | 137.9% |
| Monrovia: | 64.0% |

- 62.7%Utility gas
- 20.0%Electricity
- 8.0%Fuel oil, kerosene, etc.
- 4.1%Solar energy
- 2.3%Bottled, tank, or LP gas
- 1.6%No fuel used
- 1.3%Other fuel
Roads and streets:
W Maple Ave
Length: 0.49 miles
Direction: E-W
Address range: 100 to 425
Direction: E-W
Address range: 100 to 425
W Colorado Blvd
Length: 0.45 miles
Direction: E-W
Address range: 100 to 399
Direction: E-W
Address range: 100 to 399
W Olive Ave
Length: 0.45 miles
Direction: E-W
Address range: 100 to 399
Direction: E-W
Address range: 100 to 399
W Chestnut Ave
Length: 0.45 miles
Direction: E-W
Address range: 100 to 399
Direction: E-W
Address range: 100 to 399
W Walnut Ave
Length: 0.45 miles
Direction: E-W
Address range: 100 to 399
Direction: E-W
Address range: 100 to 399
W Lemon Ave
Length: 0.45 miles
Direction: E-W
Address range: 1 to 399
Direction: E-W
Address range: 1 to 399
S Alta Vista Ave
Length: 0.41 miles
Direction: N-S
Address range: 450 to 999
Direction: N-S
Address range: 450 to 999
S Magnolia Ave
Length: 0.41 miles
Direction: N-S
Address range: 450 to 999
Direction: N-S
Address range: 450 to 999
S Primrose Ave
Length: 0.41 miles
Direction: N-S
Address range: 450 to 999
Direction: N-S
Address range: 450 to 999
S Ivy Ave
Length: 0.41 miles
Direction: N-S
Address range: 450 to 999
Direction: N-S
Address range: 450 to 999
S Myrtle Ave
Length: 0.38 miles
Direction: N-S
Address range: 500 to 999
Direction: N-S
Address range: 500 to 999
E Chestnut Ave
Length: 0.20 miles
Direction: E-W
Address range: 100 to 227
Direction: E-W
Address range: 100 to 227
E Walnut Ave
Length: 0.19 miles
Direction: E-W
Address range: 100 to 227
Direction: E-W
Address range: 100 to 227
E Maple Ave
Length: 0.15 miles
Direction: E-W
Address range: 100 to 199
Direction: E-W
Address range: 100 to 199
E Lemon Ave
Length: 0.15 miles
Direction: E-W
Address range: 100 to 199
Direction: E-W
Address range: 100 to 199
E Olive Ave
Length: 0.15 miles
Direction: E-W
Address range: 100 to 199
Direction: E-W
Address range: 100 to 199
E Colorado Blvd
Length: 0.15 miles
Direction: E-W
Address range: 100 to 199
Direction: E-W
Address range: 100 to 199