Colonial Village neighborhood in Charlotte, North Carolina (NC), 28209 detailed profile
Settings
X


Business Search - 14 Million verified businesses
Area: 0.277 square miles
Population: 1,052
Population density:
| Colonial Village: | 3,796 people per square mile |
| Charlotte: | 3,705 people per square mile |

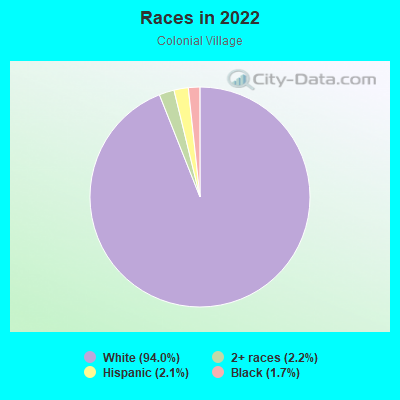
- 1,01094.0%White
- 242.2%Two or more races
- 232.1%Hispanic or Latino
- 181.7%Black
Median household income in 2022:
| Colonial Village: | $120,254 |
| Charlotte: | $74,401 |
Distribution of median household income
![Distribution of median household income]()
- 8Less than $10,000
- 29$10,000 to $19,999
- 19$20,000 to $29,999
- 63$30,000 to $39,999
- 19$40,000 to $49,999
- 12$50,000 to $59,999
- 14$60,000 to $74,999
- 69$75,000 to $99,999
- 22$100,000 to $124,999
- 45$125,000 to $149,999
- 33$150,000 to $199,999
- 195$200,000 or more

Distribution of owner-occupied house/condo value
![Distribution of owner-occupied house/condo value]()
- 7Less than $50,000
- 12$100,000 to $149,999
- 2$150,000 to $199,999
- 10$250,000 to $299,999
- 48$300,000 to $399,999
- 186$400,000 to $499,999
- 103$500,000 to $749,999
- 15$750,000 to $999,999
- 9$1,000,000 or more

Distribution of rent paid by renters
![Distribution of rent paid by renters]()
- 16$300 to $399
- 7$500 to $599
- 39$700 to $799
- 14$800 to $899
- 46$900 to $999
- 8$1,250 to $1,499
- 23$1,500 to $1,999

Median rent in 2022:
| Colonial Village: | $1,603 |
| Charlotte: | $1,334 |
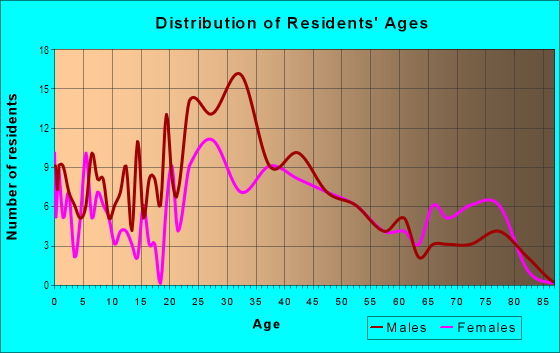
| Males: | 517 |
| Females: | 535 |
Males:
| This neighborhood: | 44.5 years |
| Whole city: | 33.8 years |
| This neighborhood: | 36.4 years |
| Whole city: | 35.3 years |
Average household size:
| Colonial Village: | 2.2 people |
| Charlotte: | 2.3 people |
Percentage of family households:
| Colonial Village: | 54.1% |
| Charlotte: | 42.8% |
| Here: | 48.9% |
| Charlotte: | 36.9% |
Percentage of married-couple families with children (among all households):
| Colonial Village: | 39.4% |
| Charlotte: | 27.1% |
Percentage of single-mother households (among all households):
| Colonial Village: | 4.3% |
| Charlotte: | 11.0% |
Percentage of never married males 15 years old and over:
Percentage of never married females 15 years old and over:
| Colonial Village: | 18.2% |
| Charlotte: | 21.6% |
Percentage of never married females 15 years old and over:
| Colonial Village: | 13.1% |
| city: | 22.1% |
Percentage of people that speak English not well or not at all:
| Colonial Village: | 0.0% |
| Charlotte: | 5.7% |
Percentage of people born in this state:
Percentage of people born in another U.S. state:
Percentage of native residents but born outside the U.S.:
Percentage of foreign born residents:
| Here: | 46.5% |
| Charlotte: | 40.1% |
Percentage of people born in another U.S. state:
| Colonial Village: | 41.3% |
| Charlotte: | 41.5% |
Percentage of native residents but born outside the U.S.:
| Here: | 0.8% |
| city: | 1.5% |
Percentage of foreign born residents:
| Here: | 11.4% |
| Charlotte: | 16.8% |
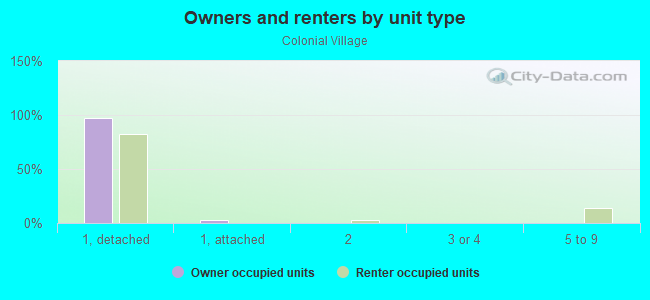
Owner-occupied
Renter-occupied

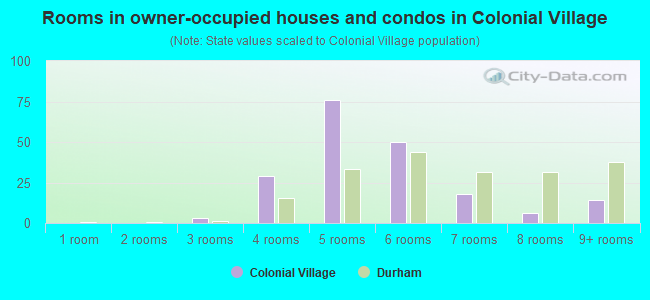
- Rooms in owner-occupied houses and condos in Colonial Village
- 01 room
- 02 rooms
- 03 rooms
- 264 rooms
- 825 rooms
- 586 rooms
- 597 rooms
- 368 rooms
- 1099+ rooms
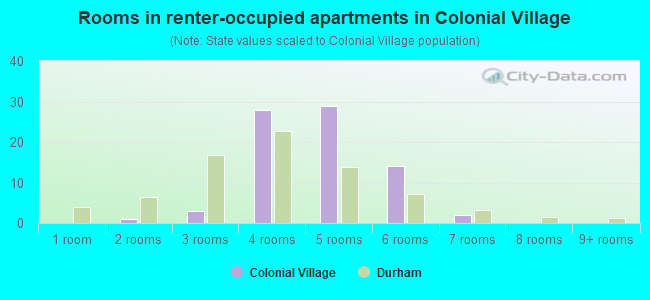
- Rooms in renter-occupied apartments in Colonial Village
- 01 room
- 02 rooms
- 833 rooms
- 514 rooms
- 155 rooms
- 256 rooms
- 07 rooms
- 08 rooms
- 69+ rooms
Owner-occupied
Renter-occupied
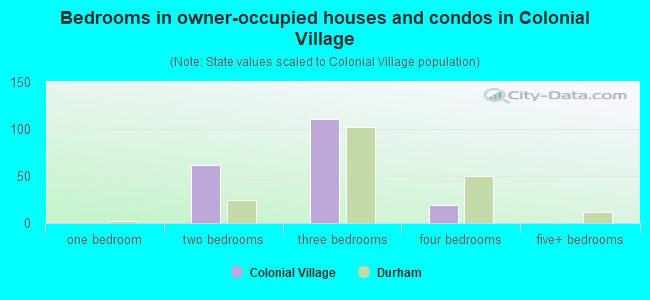
- Bedrooms in owner-occupied houses and condos in Colonial Village
- 0no bedroom
- 111 bedroom
- 22 bedrooms
- 3073 bedrooms
- 414 bedrooms
- 115+ bedrooms
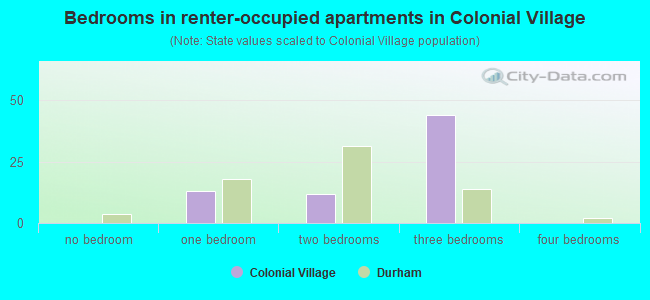
- Bedrooms in renter-occupied apartments in Colonial Village
- 0no bedroom
- 831 bedroom
- 602 bedrooms
- 403 bedrooms
- 64 bedrooms
- 05+ bedrooms
Average number of cars or other vehicles available in houses/condos:
Average number of cars or other vehicles available in apartments:
| This neighborhood: | 2.1 |
| Charlotte: | 2.0 |
Average number of cars or other vehicles available in apartments:
| Here: | 1.3 |
| city: | 1.4 |
Percentage of units with a mortgage:
| Colonial Village: | 86.8% |
| Charlotte: | 74.9% |
Average estimated value of detached houses in 2022 (84.2% of all units):
| Colonial Village: | $424,629 |
| Charlotte: | $527,854 |
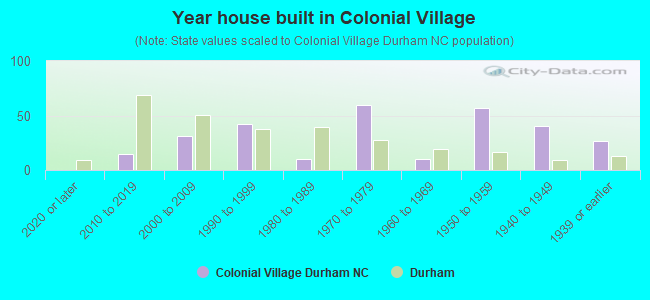
- Year house built in Colonial Village
- 02020 or later
- 132010 to 2019
- 02000 to 2009
- 61990 to 1999
- 71980 to 1989
- 701970 to 1979
- 121960 to 1969
- 3611950 to 1959
- 71940 to 1949
- 111939 or earlier
Travel time to work (commute)
![Travel time to work (commute)]()
- 635 to 9 minutes
- 16610 to 14 minutes
- 17415 to 19 minutes
- 10320 to 24 minutes
- 2225 to 29 minutes
- 12730 to 34 minutes
- 835 to 39 minutes
- 1140 to 44 minutes
- 945 to 59 minutes
- 1060 to 89 minutes
- 1890 or more minutes

Means of transportation to work
![Means of transportation to work]()
- 85.2%675Drove a car alone
- 9.0%71Carpooled
- 2.7%21Bus
- 0.6%5Light rail, streetcar or trolley
- 0.8%6Ferryboat
- 4.0%32Taxi
- 0.8%6Walked
- 3.8%30Worked at home

Time leaving home to go to work
![Time leaving home to go to work]()
- 1912:00 a.m. to 4:59 a.m.
- 965:00 a.m. to 5:29 a.m.
- 275:30 a.m. to 5:59 a.m.
- 1166:00 a.m. to 6:29 a.m.
- 76:30 a.m. to 6:59 a.m.
- 1247:00 a.m. to 7:29 a.m.
- 757:30 a.m. to 7:59 a.m.
- 938:00 a.m. to 8:29 a.m.
- 378:30 a.m. to 8:59 a.m.
- 479:00 a.m. to 9:59 a.m.
- 610:00 a.m. to 10:59 a.m.
- 211:00 a.m. to 11:59 a.m.
- 544:00 p.m. to 11:59 p.m.

Occupations of males:
- Percentage of males in management occupations (except farmers):
Here: 15.1% city: 15.2%
- Percentage of males in business and financial operations occupations:
Here: 2.9% city: 8.5%
- Percentage of males in computer and mathematical occupations:
Here: 3.1% city: 7.7%
- Percentage of males in architecture and engineering occupations:
Here: 29.1% city: 3.2%
- Percentage of males in sales and office occupations:
Here: 9.8% city: 16.3%
- Percentage of males in transportation occupations:
Here: 3.8% city: 5.6%
- Percentage of males in material moving occupations:
Here: 20.6% city: 5.7%
Occupations of females:
- Percentage of females in management occupations (except farmers):
Here: 8.9% city: 11.3%
- Percentage of females in business and financial operations occupations:
Here: 7.6% city: 10.5%
- Percentage of females in architecture and engineering occupations:
Here: 4.2% city: 0.7%
- Percentage of females in community and social services occupations:
Here: 2.5% city: 2.6%
- Percentage of females in legal occupations:
Here: 4.0% city: 1.6%
- Percentage of females in arts, design, entertainment, sports, and media occupations:
Here: 6.1% city: 2.5%
- Percentage of females in healthcare practitioners and technical occupations:
Here: 10.0% city: 7.2%
- Percentage of females in service occupations:
Here: 14.7% city: 17.4%
- Percentage of females in sales and office occupations:
Here: 26.3% city: 26.2%
- Percentage of females in production occupations:
Here: 8.5% city: 2.9%
- Percentage of females in material moving occupations:
Here: 7.3% city: 2.8%
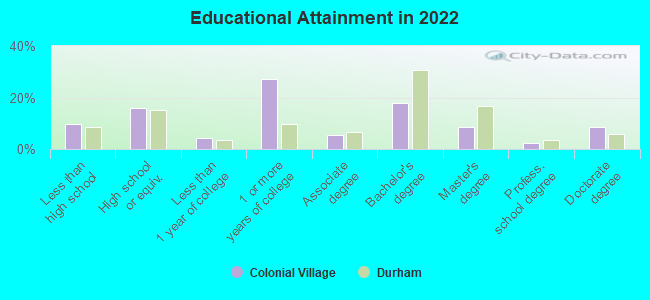
Education in this neighborhood (subdivision or community):
- Percentage of people 3 years and older in K-12 schools:
Colonial Village: 16.7% Charlotte: 16.6%
- Percentage of people 3 years and older in undergraduate colleges:
Colonial Village: 2.6% Charlotte: 5.0%
- Percentage of people 3 years and older in grad. or professional schools:
Colonial Village: 0.2% Charlotte: 1.5%
- Percentage of students K-12 enrolled in private schools:
Colonial Village: 0.0% Charlotte: 10.1%
Percentage of population below poverty level:
| Colonial Village: | 5.3% |
| Charlotte: | 11.8% |
Median year owner moved in (as recorded in 2022):
| Colonial Village: | 2004 |
| Charlotte: | 2012 |
Percentage of married-couple families with both working:
| Colonial Village: | 100.2% |
| Charlotte: | 66.4% |
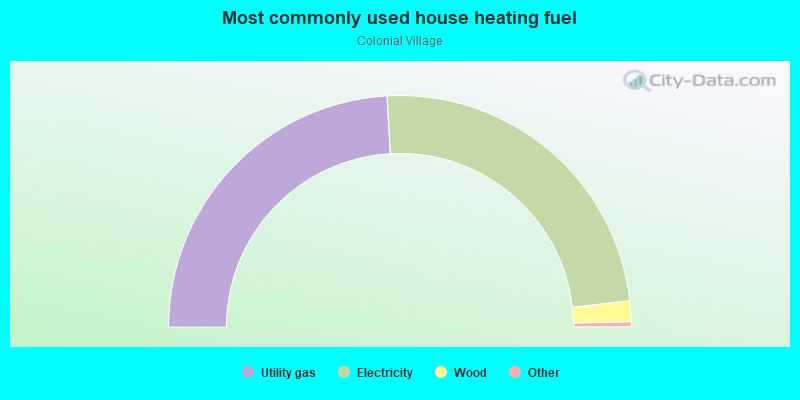
- 58.1%Utility gas
- 41.3%Electricity
- 0.6%Bottled, tank, or LP gas
Roads and streets:
Hollis Rd
Length: 0.62 miles
Directions: E-W, SE-NW
Address range: 100 to 625
Directions: E-W, SE-NW
Address range: 100 to 625
Hartford Ave
Length: 0.43 miles
Directions: E-W, N-S, SE-NW, SW-NE
Address range: 900 to 1299
Directions: E-W, N-S, SE-NW, SW-NE
Address range: 900 to 1299
Webster Pl
Length: 0.43 miles
Directions: E-W, SE-NW, SW-NE
Address range: 300 to 599
Directions: E-W, SE-NW, SW-NE
Address range: 300 to 599
Tyson St
Length: 0.40 miles
Directions: E-W, SE-NW
Address range: 300 to 599
Directions: E-W, SE-NW
Address range: 300 to 599
Moultrie St
Length: 0.38 miles
Directions: N-S, SE-NW
Address range: 3600 to 3899
Directions: N-S, SE-NW
Address range: 3600 to 3899
Annlin Ave
Length: 0.37 miles
Directions: N-S, SE-NW, SW-NE
Address range: 3500 to 3827
Directions: N-S, SE-NW, SW-NE
Address range: 3500 to 3827
Conway Ave
Length: 0.35 miles
Direction: SW-NE
Address range: 3500 to 3799
Direction: SW-NE
Address range: 3500 to 3799
Scaleybark Rd
Length: 0.33 miles
Direction: SE-NW
Address range: 300 to 499
Direction: SE-NW
Address range: 300 to 499
Trent St
Length: 0.26 miles
Directions: N-S, SW-NE
Address range: 3500 to 3699
Directions: N-S, SW-NE
Address range: 3500 to 3699
Sloan St
Length: 0.24 miles
Directions: N-S, SW-NE
Address range: 3500 to 3699
Directions: N-S, SW-NE
Address range: 3500 to 3699
Weona Ave
Length: 0.17 miles
Direction: SW-NE
Address range: 3700 to 3899
Direction: SW-NE
Address range: 3700 to 3899
Reynolds Dr
Length: 0.13 miles
Direction: SE-NW
Address range: 500 to 599
Direction: SE-NW
Address range: 500 to 599
Weston St
Length: 0.08 miles
Direction: SW-NE
Address range: 3400 to 3499
Direction: SW-NE
Address range: 3400 to 3499
Ormand Ct
Length: 0.07 miles
Directions: E-W, SE-NW
Address range: 200 to 299
Directions: E-W, SE-NW
Address range: 200 to 299
Shawnee Dr
Length: 0.06 miles
Direction: E-W
Address range: 600 to 699
Direction: E-W
Address range: 600 to 699
Stamey Cir
Length: 0.03 miles
Direction: SE-NW
Address range: 200 to 299
Direction: SE-NW
Address range: 200 to 299
Other features:
Little Hope Crk
Length: 0.84 miles
Directions: E-W, N-S, SE-NW, SW-NE
Directions: E-W, N-S, SE-NW, SW-NE