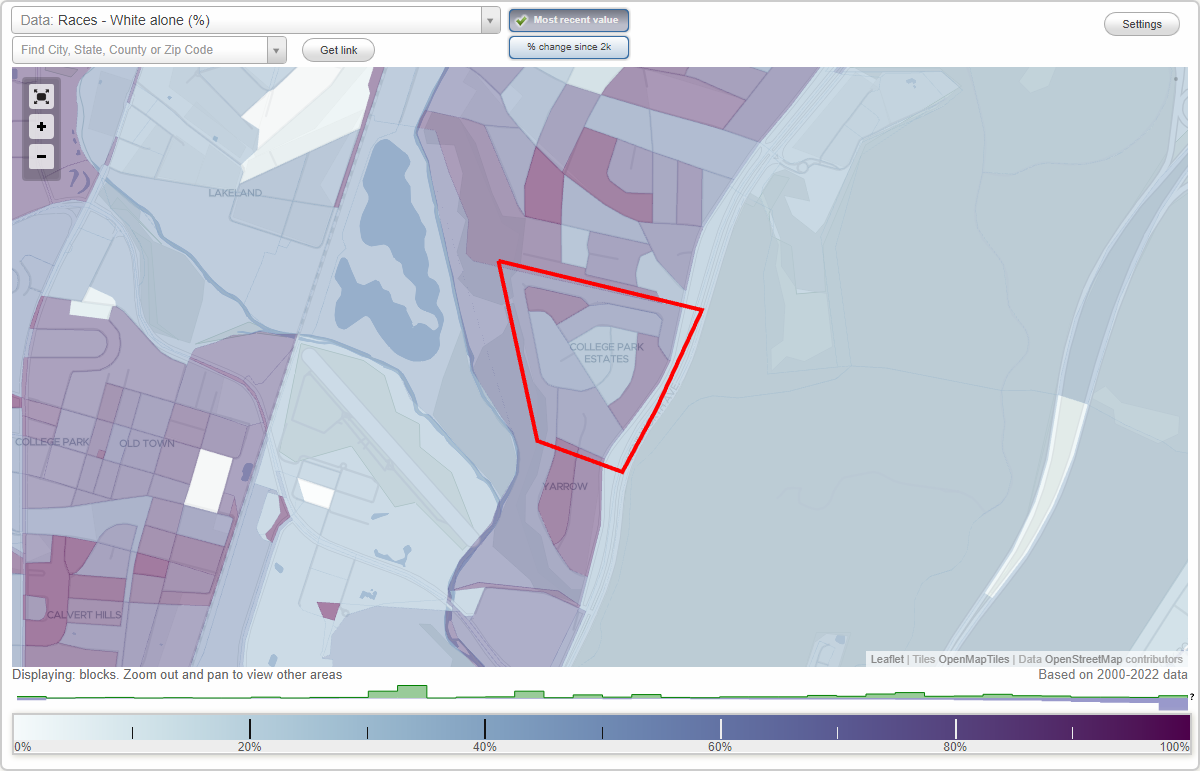
College Park Estates neighborhood in College Park, Maryland (MD), 20740 detailed profile
Settings
X

Business Search - 14 Million verified businesses
Area: 0.136 square miles
Population: 362
Population density:
| College Park Estates: | 2,652 people per square mile |
| College Park: | 6,333 people per square mile |

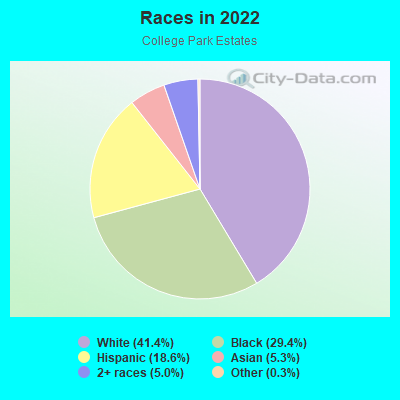
- 14941.4%White
- 10629.4%Black
- 6718.6%Hispanic or Latino
- 195.3%Asian
- 185.0%Two or more races
- 10.3%Some other race
Median household income in 2022:
| College Park Estates: | $117,552 |
| College Park: | $76,973 |
Distribution of median household income
![Distribution of median household income]()
- 6Less than $10,000
- 2$10,000 to $19,999
- 9$20,000 to $29,999
- 9$30,000 to $39,999
- 15$40,000 to $49,999
- 4$50,000 to $59,999
- 10$60,000 to $74,999
- 25$75,000 to $99,999
- 16$100,000 to $124,999
- 17$125,000 to $149,999
- 18$150,000 to $199,999
- 43$200,000 or more

Distribution of owner-occupied house/condo value
![Distribution of owner-occupied house/condo value]()
- 9Less than $50,000
- 6$50,000 to $99,999
- 6$100,000 to $149,999
- 6$150,000 to $199,999
- 8$200,000 to $249,999
- 10$250,000 to $299,999
- 26$300,000 to $399,999
- 50$400,000 to $499,999
- 31$500,000 to $749,999
- 6$750,000 to $999,999
- 1$1,000,000 or more

Distribution of rent paid by renters
![Distribution of rent paid by renters]()
- 1$800 to $899
- 3$1,000 to $1,249
- 6$1,250 to $1,499
- 10$1,500 to $1,999
- 22$2,000 or more

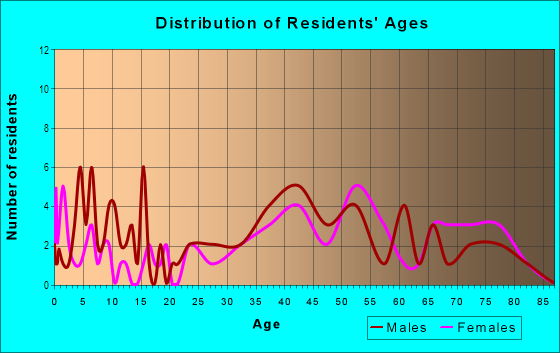
| Males: | 154 |
| Females: | 208 |
Males:
| This neighborhood: | 40.4 years |
| Whole city: | 22.0 years |
| This neighborhood: | 40.3 years |
| Whole city: | 21.2 years |
Average household size:
| College Park Estates: | 2.3 people |
| College Park: | 2.7 people |
Percentage of family households:
| College Park Estates: | 36.5% |
| College Park: | 30.6% |
| Here: | 40.0% |
| College Park: | 28.7% |
Percentage of married-couple families with children (among all households):
| College Park Estates: | 35.4% |
| College Park: | 20.4% |
Percentage of single-mother households (among all households):
| College Park Estates: | 1.6% |
| College Park: | 4.3% |
Percentage of never married males 15 years old and over:
Percentage of never married females 15 years old and over:
| College Park Estates: | 23.9% |
| College Park: | 38.3% |
Percentage of never married females 15 years old and over:
| College Park Estates: | 21.8% |
| city: | 36.3% |
Percentage of people that speak English not well or not at all:
| College Park Estates: | 0.3% |
| College Park: | 6.6% |
Percentage of people born in this state:
Percentage of people born in another U.S. state:
Percentage of native residents but born outside the U.S.:
Percentage of foreign born residents:
| Here: | 26.3% |
| College Park: | 34.2% |
Percentage of people born in another U.S. state:
| College Park Estates: | 34.4% |
| College Park: | 40.7% |
Percentage of native residents but born outside the U.S.:
| Here: | 2.7% |
| city: | 1.9% |
Percentage of foreign born residents:
| Here: | 36.6% |
| College Park: | 23.1% |
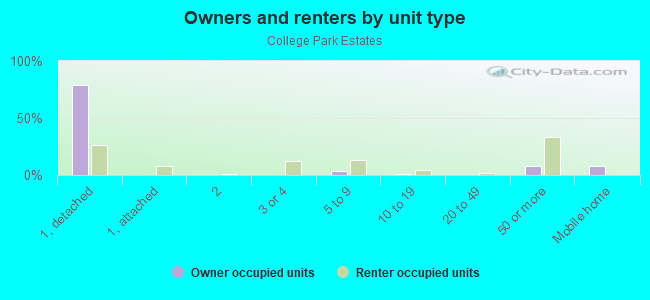
Owner-occupied
Renter-occupied

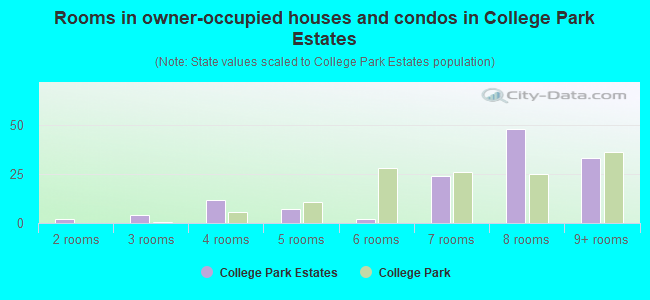
- Rooms in owner-occupied houses and condos in College Park Estates
- 01 room
- 22 rooms
- 43 rooms
- 124 rooms
- 75 rooms
- 26 rooms
- 247 rooms
- 488 rooms
- 339+ rooms
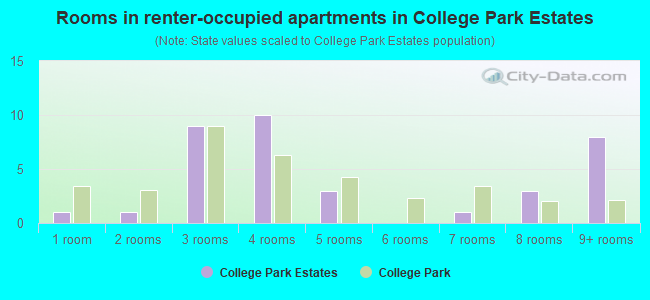
- Rooms in renter-occupied apartments in College Park Estates
- 11 room
- 12 rooms
- 93 rooms
- 104 rooms
- 35 rooms
- 06 rooms
- 17 rooms
- 38 rooms
- 89+ rooms
Owner-occupied
Renter-occupied
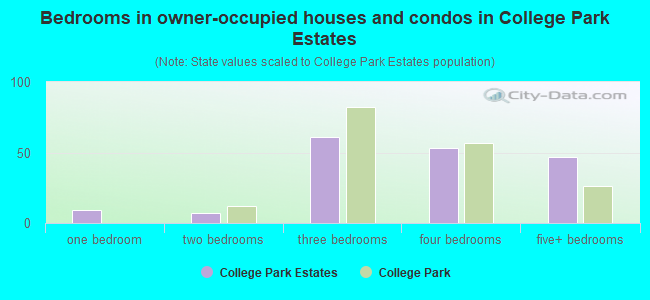
- Bedrooms in owner-occupied houses and condos in College Park Estates
- 0no bedroom
- 91 bedroom
- 72 bedrooms
- 613 bedrooms
- 534 bedrooms
- 475+ bedrooms
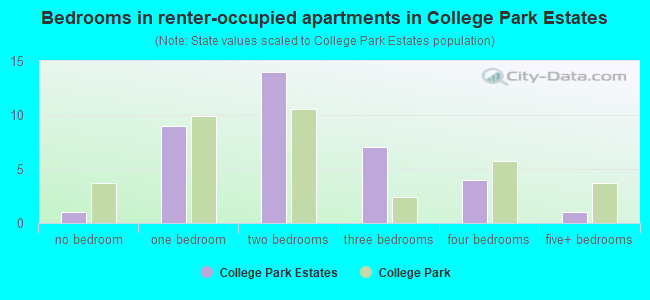
- Bedrooms in renter-occupied apartments in College Park Estates
- 1no bedroom
- 91 bedroom
- 142 bedrooms
- 73 bedrooms
- 44 bedrooms
- 15+ bedrooms
Average number of cars or other vehicles available in houses/condos:
Average number of cars or other vehicles available in apartments:
| This neighborhood: | 1.2 |
| College Park: | 2.1 |
Average number of cars or other vehicles available in apartments:
| Here: | 2.5 |
| city: | 1.4 |
Percentage of units with a mortgage:
| College Park Estates: | 50.5% |
| College Park: | 66.4% |
Average estimated value of detached houses in 2022 (95.6% of all units):
| College Park Estates: | $431,027 |
| Maryland: | $526,819 |
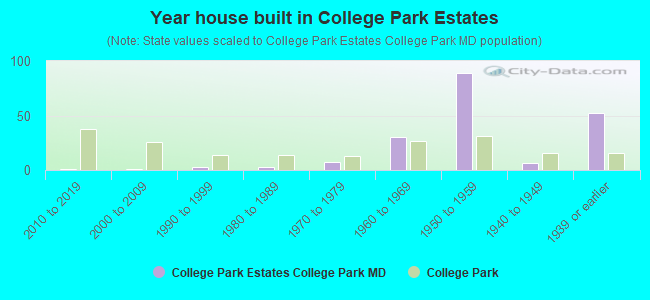
- Year house built in College Park Estates
- 02020 or later
- 12010 to 2019
- 12000 to 2009
- 31990 to 1999
- 31980 to 1989
- 71970 to 1979
- 301960 to 1969
- 891950 to 1959
- 61940 to 1949
- 521939 or earlier
Travel time to work (commute)
![Travel time to work (commute)]()
- 75 to 9 minutes
- 1710 to 14 minutes
- 1915 to 19 minutes
- 720 to 24 minutes
- 225 to 29 minutes
- 4430 to 34 minutes
- 435 to 39 minutes
- 940 to 44 minutes
- 3545 to 59 minutes
- 1760 to 89 minutes
- 490 or more minutes

Means of transportation to work
![Means of transportation to work]()
- 54.2%130Drove a car alone
- 7.5%18Carpooled
- 0.4%1Bus
- 9.6%23Subway or elevated rail
- 1.7%4Long-distance train or commuter rail
- 0.8%2Taxi
- 1.3%3Bicycle
- 3.3%8Walked
- 0.4%1Other means
- 22.1%53Worked at home

Time leaving home to go to work
![Time leaving home to go to work]()
- 912:00 a.m. to 4:59 a.m.
- 45:00 a.m. to 5:29 a.m.
- 115:30 a.m. to 5:59 a.m.
- 296:00 a.m. to 6:29 a.m.
- 26:30 a.m. to 6:59 a.m.
- 297:00 a.m. to 7:29 a.m.
- 227:30 a.m. to 7:59 a.m.
- 188:00 a.m. to 8:29 a.m.
- 48:30 a.m. to 8:59 a.m.
- 159:00 a.m. to 9:59 a.m.
- 410:00 a.m. to 10:59 a.m.
- 111:00 a.m. to 11:59 a.m.
- 1012:00 p.m. to 3:59 p.m.
- 54:00 p.m. to 11:59 p.m.

Occupations of males:
- Percentage of males in management occupations (except farmers):
Here: 13.1% city: 6.2%
- Percentage of males in computer and mathematical occupations:
Here: 11.2% city: 10.0%
- Percentage of males in community and social services occupations:
Here: 3.7% city: 0.8%
- Percentage of males in legal occupations:
Here: 2.5% city: 1.9%
- Percentage of males in education, training, and library occupations:
Here: 9.4% city: 12.5%
- Percentage of males in arts, design, entertainment, sports, and media occupations:
Here: 11.2% city: 2.3%
- Percentage of males in service occupations:
Here: 16.5% city: 13.5%
- Percentage of males in sales and office occupations:
Here: 4.6% city: 11.3%
- Percentage of males in production occupations:
Here: 25.2% city: 1.8%
Occupations of females:
- Percentage of females in management occupations (except farmers):
Here: 6.0% city: 7.6%
- Percentage of females in computer and mathematical occupations:
Here: 3.4% city: 3.2%
- Percentage of females in architecture and engineering occupations:
Here: 3.6% city: 0.8%
- Percentage of females in community and social services occupations:
Here: 6.2% city: 2.0%
- Percentage of females in legal occupations:
Here: 2.8% city: 1.1%
- Percentage of females in education, training, and library occupations:
Here: 16.8% city: 22.3%
- Percentage of females in healthcare practitioners and technical occupations:
Here: 11.7% city: 5.4%
- Percentage of females in service occupations:
Here: 5.3% city: 17.1%
- Percentage of females in sales and office occupations:
Here: 35.7% city: 25.5%
- Percentage of females in production occupations:
Here: 3.6% city: 1.4%
- Percentage of females in transportation occupations:
Here: 3.9% city: 0.9%
Percentage of people 16-64 in Armed Forces:
| College Park Estates: | 0.1% |
| College Park: | 0.4% |
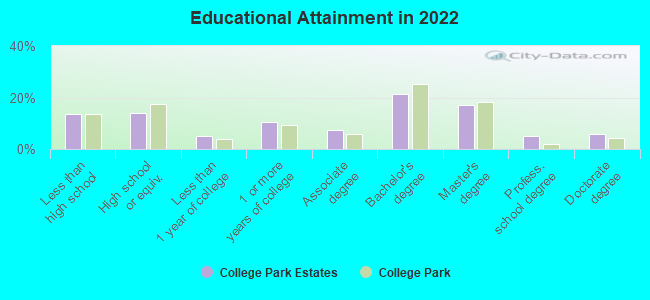
Education in this neighborhood (subdivision or community):
- Percentage of people 3 years and older in K-12 schools:
College Park Estates: 28.5% College Park: 5.2%
- Percentage of people 3 years and older in undergraduate colleges:
College Park Estates: 6.8% College Park: 48.1%
- Percentage of people 3 years and older in grad. or professional schools:
College Park Estates: 7.3% College Park: 4.6%
- Percentage of students K-12 enrolled in private schools:
College Park Estates: 21.8% College Park: 30.4%
Percentage of population below poverty level:
| College Park Estates: | 4.8% |
| College Park: | 27.8% |
Median year owner moved in (as recorded in 2022):
| College Park Estates: | 2003 |
| College Park: | 2005 |
Percentage of married-couple families with both working:
| College Park Estates: | 82.6% |
| College Park: | 74.3% |
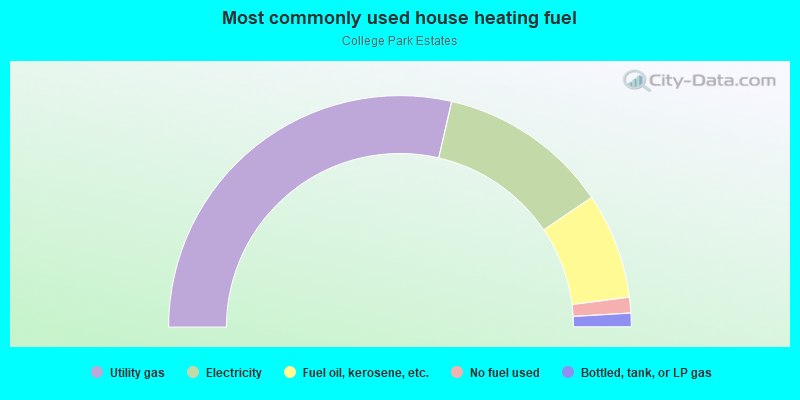
- 57.2%Utility gas
- 23.9%Electricity
- 14.8%Fuel oil, kerosene, etc.
- 2.2%No fuel used
- 1.9%Bottled, tank, or LP gas
Roads and streets:
Wellesley Dr
Length: 0.45 miles
Directions: E-W, SE-NW, SW-NE
Address range: 7400 to 7699
Directions: E-W, SE-NW, SW-NE
Address range: 7400 to 7699
Bryn Mawr Rd
Length: 0.44 miles
Directions: E-W, N-S, SE-NW, SW-NE
Address range: 5800 to 5999
Directions: E-W, N-S, SE-NW, SW-NE
Address range: 5800 to 5999
Edmonston Rd
Length: 0.41 miles
Directions: N-S, SW-NE
Address range: 7400 to 7649
Directions: N-S, SW-NE
Address range: 7400 to 7649
Sweetbriar Dr
Length: 0.37 miles
Directions: E-W, N-S, SE-NW
Address range: 7400 to 7618
Directions: E-W, N-S, SE-NW
Address range: 7400 to 7618
Chestnut Hill Rd
Length: 0.28 miles
Directions: E-W, SW-NE
Address range: 5800 to 5999
Directions: E-W, SW-NE
Address range: 5800 to 5999
Vassar Dr
Length: 0.21 miles
Directions: E-W, N-S, SE-NW, SW-NE
Address range: 5701 to 5799
Directions: E-W, N-S, SE-NW, SW-NE
Address range: 5701 to 5799
Creighton Dr
Length: 0.21 miles
Directions: N-S, SW-NE
Address range: 7500 to 7599
Directions: N-S, SW-NE
Address range: 7500 to 7599
Citadel Dr
Length: 0.16 miles
Directions: N-S, SW-NE
Address range: 7500 to 7599
Directions: N-S, SW-NE
Address range: 7500 to 7599
Knoxville Dr
Length: 0.15 miles
Direction: E-W
Address range: 5400 to 5499
Direction: E-W
Address range: 5400 to 5499
Radcliffe Dr
Length: 0.11 miles
Direction: N-S
Address range: 7400 to 7599
Direction: N-S
Address range: 7400 to 7599
Baylor Ave
Length: 0.08 miles
Directions: N-S, SE-NW, SW-NE
Address range: 7400 to 7499
Directions: N-S, SE-NW, SW-NE
Address range: 7400 to 7499