Clifton Park Village neighborhood in Silver Spring, Maryland (MD), 20901, 20903 detailed profile
Settings
X


Business Search - 14 Million verified businesses
Area: 0.193 square miles
Population: 2,205
Population density:
| Clifton Park Village: | 11,453 people per square mile |
| Silver Spring: | 7,993 people per square mile |

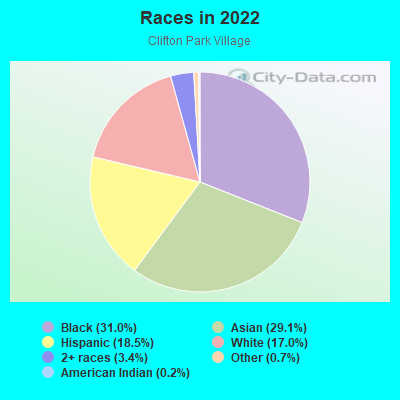
- 70331.0%Black
- 66029.1%Asian
- 41918.5%Hispanic or Latino
- 38617.0%White
- 773.4%Two or more races
- 150.7%Some other race
- 50.2%American Indian
Distribution of median household income
![Distribution of median household income]()
- 18Less than $10,000
- 31$10,000 to $19,999
- 89$20,000 to $29,999
- 120$30,000 to $39,999
- 62$40,000 to $49,999
- 34$50,000 to $59,999
- 44$60,000 to $74,999
- 35$75,000 to $99,999
- 61$100,000 to $124,999
- 48$125,000 to $149,999
- 68$150,000 to $199,999
- 161$200,000 or more

Distribution of owner-occupied house/condo value
![Distribution of owner-occupied house/condo value]()
- 130Less than $50,000
- 47$50,000 to $99,999
- 15$100,000 to $149,999
- 53$150,000 to $199,999
- 37$200,000 to $249,999
- 73$250,000 to $299,999
- 86$300,000 to $399,999
- 158$400,000 to $499,999
- 188$500,000 to $749,999
- 35$750,000 to $999,999
- 24$1,000,000 or more

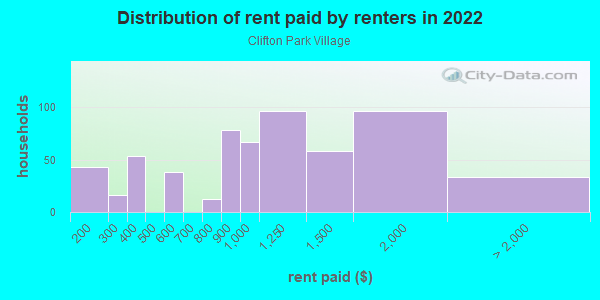
Distribution of rent paid by renters
![Distribution of rent paid by renters]()
- 43$100 to $199
- 16$200 to $299
- 53$300 to $399
- 38$500 to $599
- 12$700 to $799
- 78$800 to $899
- 67$900 to $999
- 96$1,000 to $1,249
- 58$1,250 to $1,499
- 96$1,500 to $1,999
- 33$2,000 or more
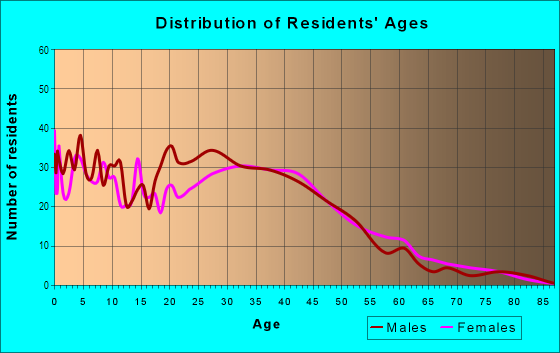
| Males: | 1,157 |
| Females: | 1,048 |
Males:
| This neighborhood: | 33.8 years |
| Whole city: | 36.7 years |
| This neighborhood: | 37.7 years |
| Whole city: | 36.5 years |
Average household size:
| Clifton Park Village: | 6.6 people |
| Silver Spring: | 2.2 people |
Percentage of family households:
| Clifton Park Village: | 49.8% |
| Silver Spring: | 38.8% |
| Here: | 51.1% |
| Silver Spring: | 32.5% |
Percentage of married-couple families with children (among all households):
| Clifton Park Village: | 21.6% |
| Silver Spring: | 34.5% |
Percentage of single-mother households (among all households):
| Clifton Park Village: | 3.1% |
| Silver Spring: | 6.6% |
Percentage of never married males 15 years old and over:
Percentage of never married females 15 years old and over:
| Clifton Park Village: | 16.0% |
| Silver Spring: | 22.2% |
Percentage of never married females 15 years old and over:
| Clifton Park Village: | 14.1% |
| place: | 24.3% |
Percentage of people that speak English not well or not at all:
| Clifton Park Village: | 20.9% |
| Silver Spring: | 9.9% |
Percentage of people born in this state:
Percentage of people born in another U.S. state:
Percentage of native residents but born outside the U.S.:
Percentage of foreign born residents:
| Here: | 22.2% |
| Silver Spring: | 19.7% |
Percentage of people born in another U.S. state:
| Clifton Park Village: | 24.3% |
| Silver Spring: | 45.9% |
Percentage of native residents but born outside the U.S.:
| Here: | 3.7% |
| place: | 2.4% |
Percentage of foreign born residents:
| Here: | 50.0% |
| Silver Spring: | 32.0% |
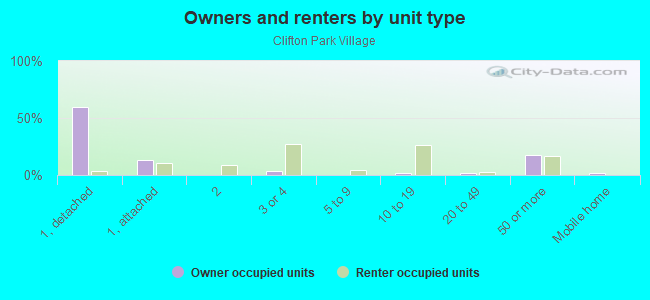
Owner-occupied
Renter-occupied


- Rooms in owner-occupied houses and condos in Clifton Park Village
- 01 room
- 122 rooms
- 223 rooms
- 134 rooms
- 325 rooms
- 686 rooms
- 1227 rooms
- 1178 rooms
- 1139+ rooms
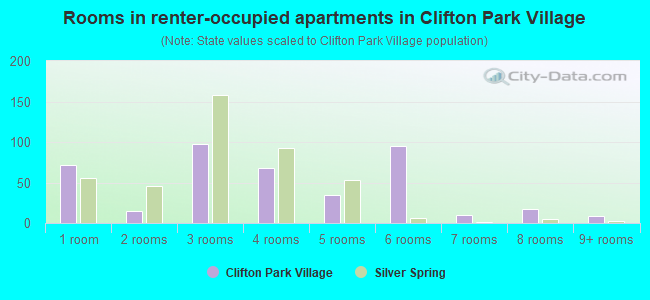
- Rooms in renter-occupied apartments in Clifton Park Village
- 721 room
- 152 rooms
- 983 rooms
- 684 rooms
- 345 rooms
- 956 rooms
- 107 rooms
- 178 rooms
- 99+ rooms
Owner-occupied
Renter-occupied
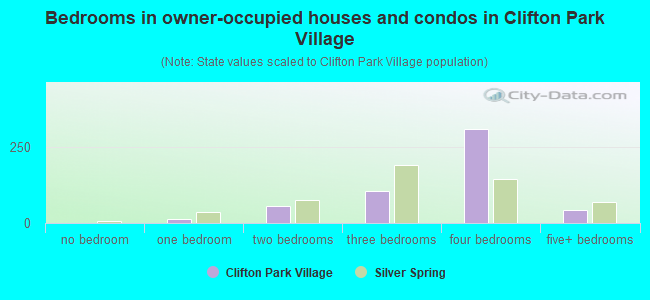
- Bedrooms in owner-occupied houses and condos in Clifton Park Village
- 0no bedroom
- 121 bedroom
- 552 bedrooms
- 1053 bedrooms
- 3094 bedrooms
- 425+ bedrooms
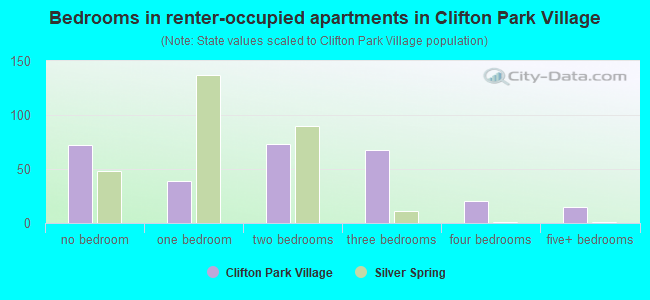
- Bedrooms in renter-occupied apartments in Clifton Park Village
- 72no bedroom
- 391 bedroom
- 732 bedrooms
- 683 bedrooms
- 204 bedrooms
- 155+ bedrooms
Average number of cars or other vehicles available in houses/condos:
Average number of cars or other vehicles available in apartments:
| This neighborhood: | 2.4 |
| Silver Spring: | 1.7 |
Average number of cars or other vehicles available in apartments:
| Here: | 1.0 |
| place: | 0.9 |
Percentage of units with a mortgage:
| Clifton Park Village: | 73.5% |
| Silver Spring: | 76.3% |
Average estimated value of detached houses in 2022 (59.6% of all units):
| Clifton Park Village: | $530,617 |
| Maryland: | $526,819 |
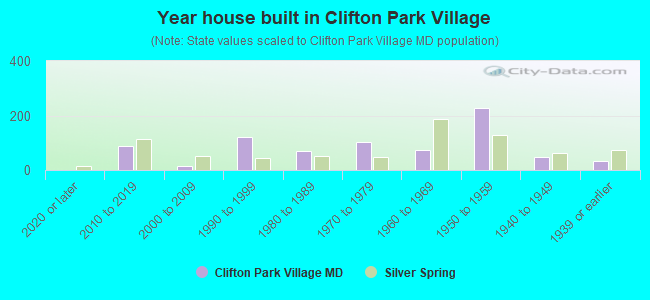
- Year house built in Clifton Park Village
- 02020 or later
- 882010 to 2019
- 142000 to 2009
- 1211990 to 1999
- 681980 to 1989
- 1031970 to 1979
- 751960 to 1969
- 2261950 to 1959
- 481940 to 1949
- 331939 or earlier
Travel time to work (commute)
![Travel time to work (commute)]()
- 2Less than 5 minutes
- 305 to 9 minutes
- 3710 to 14 minutes
- 7815 to 19 minutes
- 14120 to 24 minutes
- 5525 to 29 minutes
- 23530 to 34 minutes
- 9235 to 39 minutes
- 10240 to 44 minutes
- 12645 to 59 minutes
- 6060 to 89 minutes
- 4090 or more minutes

Means of transportation to work
![Means of transportation to work]()
- 54.4%532Drove a car alone
- 12.8%125Carpooled
- 8.7%85Bus
- 5.2%51Subway or elevated rail
- 2.7%26Long-distance train or commuter rail
- 0.9%9Taxi
- 0.9%9Bicycle
- 1.1%11Walked
- 1.2%12Other means
- 15.4%151Worked at home

Time leaving home to go to work
![Time leaving home to go to work]()
- 9112:00 a.m. to 4:59 a.m.
- 355:00 a.m. to 5:29 a.m.
- 115:30 a.m. to 5:59 a.m.
- 1246:00 a.m. to 6:29 a.m.
- 576:30 a.m. to 6:59 a.m.
- 757:00 a.m. to 7:29 a.m.
- 927:30 a.m. to 7:59 a.m.
- 1438:00 a.m. to 8:29 a.m.
- 208:30 a.m. to 8:59 a.m.
- 1199:00 a.m. to 9:59 a.m.
- 4510:00 a.m. to 10:59 a.m.
- 3011:00 a.m. to 11:59 a.m.
- 11512:00 p.m. to 3:59 p.m.
- 324:00 p.m. to 11:59 p.m.

Occupations of males:
- Percentage of males in management occupations (except farmers):
Here: 3.7% place: 11.4%
- Percentage of males in business and financial operations occupations:
Here: 9.2% place: 6.8%
- Percentage of males in computer and mathematical occupations:
Here: 6.2% place: 9.4%
- Percentage of males in architecture and engineering occupations:
Here: 1.4% place: 4.5%
- Percentage of males in life, physical, and social science occupations:
Here: 8.2% place: 5.3%
- Percentage of males in community and social services occupations:
Here: 2.2% place: 1.2%
- Percentage of males in education, training, and library occupations:
Here: 3.2% place: 6.2%
- Percentage of males in healthcare practitioners and technical occupations:
Here: 2.6% place: 2.5%
- Percentage of males in service occupations:
Here: 11.8% place: 10.9%
- Percentage of males in sales and office occupations:
Here: 8.9% place: 9.6%
- Percentage of males in construction, extraction, and maintenance occupations:
Here: 16.9% place: 11.6%
- Percentage of males in production occupations:
Here: 3.0% place: 2.2%
- Percentage of males in transportation occupations:
Here: 17.4% place: 6.4%
- Percentage of males in material moving occupations:
Here: 3.7% place: 2.2%
Occupations of females:
- Percentage of females in management occupations (except farmers):
Here: 3.8% place: 13.0%
- Percentage of females in business and financial operations occupations:
Here: 16.8% place: 8.9%
- Percentage of females in architecture and engineering occupations:
Here: 4.0% place: 1.3%
- Percentage of females in life, physical, and social science occupations:
Here: 3.7% place: 3.4%
- Percentage of females in legal occupations:
Here: 6.1% place: 4.2%
- Percentage of females in service occupations:
Here: 30.2% place: 20.4%
- Percentage of females in sales and office occupations:
Here: 25.6% place: 16.7%
- Percentage of females in production occupations:
Here: 1.9% place: 0.9%
- Percentage of females in material moving occupations:
Here: 6.2% place: 1.3%
Percentage of people 16-64 in Armed Forces:
| Clifton Park Village: | 0.1% |
| Silver Spring: | 0.4% |
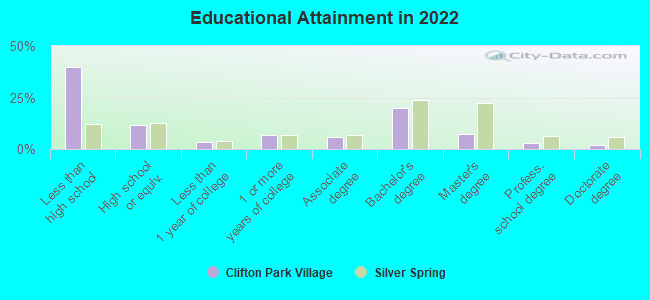
Education in this neighborhood (subdivision or community):
- Percentage of people 3 years and older in K-12 schools:
Clifton Park Village: 18.5% Silver Spring: 14.1%
- Percentage of people 3 years and older in undergraduate colleges:
Clifton Park Village: 6.6% Silver Spring: 3.4%
- Percentage of people 3 years and older in grad. or professional schools:
Clifton Park Village: 0.9% Silver Spring: 2.0%
- Percentage of students K-12 enrolled in private schools:
Clifton Park Village: 36.2% Silver Spring: 12.6%
Percentage of population below poverty level:
| Clifton Park Village: | 16.5% |
| Silver Spring: | 11.0% |
Median year renter moved in (as recorded in 2022):
| Clifton Park Village: | 2014 |
| Silver Spring: | 2020 |
Percentage of married-couple families with both working:
| Clifton Park Village: | 78.1% |
| Silver Spring: | 80.2% |
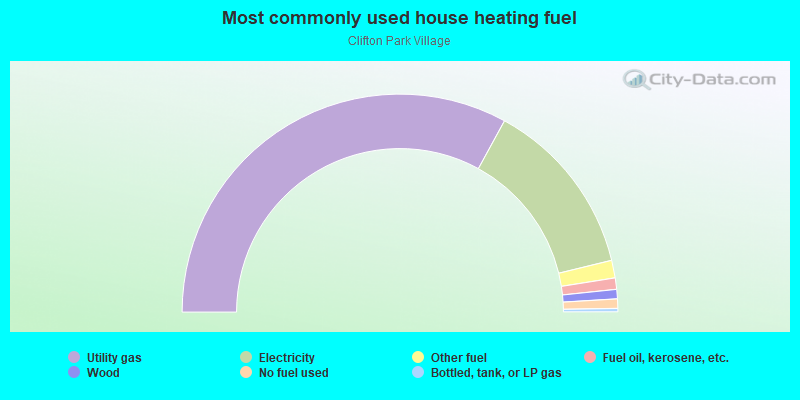
- 66.0%Utility gas
- 26.5%Electricity
- 2.6%Other fuel
- 1.7%Fuel oil, kerosene, etc.
- 1.4%Wood
- 1.4%No fuel used
- 0.5%Bottled, tank, or LP gas
Highways in this neighborhood:
Piney Branch Rd (State Hwy 320)
Length: 0.81 miles
Directions: E-W, SE-NW, SW-NE
Address range: 8800 to 9398
Directions: E-W, SE-NW, SW-NE
Address range: 8800 to 9398
University Blvd E (State Hwy 193)
Length: 0.25 miles
Directions: N-S, SE-NW
Address range: 596 to 699
Directions: N-S, SE-NW
Address range: 596 to 699
Roads and streets:
Patton Dr
Length: 0.39 miles
Directions: E-W, SE-NW, SW-NE
Address range: 800 to 999
Directions: E-W, SE-NW, SW-NE
Address range: 800 to 999
Heron Dr
Length: 0.34 miles
Directions: E-W, N-S, SE-NW, SW-NE
Address range: 800 to 999
Directions: E-W, N-S, SE-NW, SW-NE
Address range: 800 to 999
Langley Dr
Length: 0.27 miles
Directions: E-W, SW-NE
Address range: 800 to 999
Directions: E-W, SW-NE
Address range: 800 to 999
Malcolm Dr
Length: 0.26 miles
Directions: E-W, SE-NW
Address range: 800 to 999
Directions: E-W, SE-NW
Address range: 800 to 999
Miles St
Length: 0.15 miles
Directions: N-S, SW-NE
Address range: 8900 to 9099
Directions: N-S, SW-NE
Address range: 8900 to 9099
Linton St
Length: 0.13 miles
Directions: N-S, SE-NW
Address range: 8900 to 9009
Directions: N-S, SE-NW
Address range: 8900 to 9009
Newhall St
Length: 0.12 miles
Directions: E-W, SE-NW
Address range: 900 to 999
Directions: E-W, SE-NW
Address range: 900 to 999
Kimes St
Length: 0.09 miles
Directions: E-W, SE-NW
Address range: 8900 to 8999
Directions: E-W, SE-NW
Address range: 8900 to 8999
Heron Ct
Length: 0.02 miles
Direction: SE-NW
Address range: 900 to 999
Direction: SE-NW
Address range: 900 to 999