Chestnut Hills neighborhood in Raleigh, North Carolina (NC), 27609, 27612 detailed profile
Settings
X


Business Search - 14 Million verified businesses
Area: 0.239 square miles
Population: 403
Population density:
| Chestnut Hills: | 1,687 people per square mile |
| Raleigh: | 4,163 people per square mile |

- 36784.2%White
- 378.5%Two or more races
- 163.7%Black
- 102.3%Some other race
- 40.9%Asian
- 20.5%Hispanic or Latino

Median household income in 2022:
| Chestnut Hills: | $153,039 |
| Raleigh: | $75,424 |
Distribution of median household income
![Distribution of median household income]()
- 3Less than $10,000
- 12$10,000 to $19,999
- 14$20,000 to $29,999
- 19$30,000 to $39,999
- 9$40,000 to $49,999
- 12$50,000 to $59,999
- 5$60,000 to $74,999
- 8$75,000 to $99,999
- 23$100,000 to $124,999
- 12$125,000 to $149,999
- 20$150,000 to $199,999
- 117$200,000 or more

Distribution of owner-occupied house/condo value
![Distribution of owner-occupied house/condo value]()
- 3Less than $50,000
- 3$50,000 to $99,999
- 5$100,000 to $149,999
- 4$150,000 to $199,999
- 14$200,000 to $249,999
- 5$250,000 to $299,999
- 18$300,000 to $399,999
- 21$400,000 to $499,999
- 133$500,000 to $749,999
- 17$750,000 to $999,999
- 13$1,000,000 or more

Distribution of rent paid by renters
![Distribution of rent paid by renters]()
- 2$100 to $199
- 5$200 to $299
- 7$400 to $499
- 1$800 to $899
- 10$900 to $999
- 9$1,000 to $1,249
- 14$1,250 to $1,499
- 12$1,500 to $1,999
- 11$2,000 or more

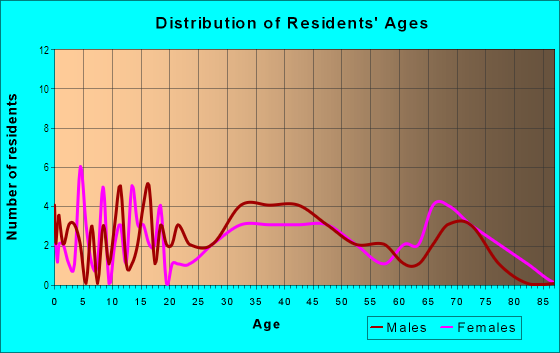
| Males: | 202 |
| Females: | 200 |
Males:
| This neighborhood: | 35.7 years |
| Whole city: | 33.9 years |
| This neighborhood: | 39.0 years |
| Whole city: | 35.8 years |
Average household size:
| Chestnut Hills: | 2.5 people |
| Raleigh: | 2.3 people |
Percentage of family households:
| Chestnut Hills: | 53.2% |
| Raleigh: | 41.5% |
| Here: | 59.5% |
| Raleigh: | 39.7% |
Percentage of married-couple families with children (among all households):
| Chestnut Hills: | 79.0% |
| Raleigh: | 28.1% |
Percentage of single-mother households (among all households):
| Chestnut Hills: | 5.8% |
| Raleigh: | 10.7% |
Percentage of never married males 15 years old and over:
Percentage of never married females 15 years old and over:
| Chestnut Hills: | 19.3% |
| Raleigh: | 22.3% |
Percentage of never married females 15 years old and over:
| Chestnut Hills: | 10.2% |
| city: | 21.9% |
Percentage of people that speak English not well or not at all:
| Chestnut Hills: | 1.9% |
| Raleigh: | 2.3% |
Percentage of people born in this state:
Percentage of people born in another U.S. state:
Percentage of native residents but born outside the U.S.:
Percentage of foreign born residents:
| Here: | 48.9% |
| Raleigh: | 44.8% |
Percentage of people born in another U.S. state:
| Chestnut Hills: | 43.0% |
| Raleigh: | 39.8% |
Percentage of native residents but born outside the U.S.:
| Here: | 1.7% |
| city: | 1.9% |
Percentage of foreign born residents:
| Here: | 7.1% |
| Raleigh: | 13.5% |

Owner-occupied
Renter-occupied


- Rooms in owner-occupied houses and condos in Chestnut Hills
- 01 room
- 02 rooms
- 03 rooms
- 74 rooms
- 25 rooms
- 246 rooms
- 227 rooms
- 218 rooms
- 509+ rooms

- Rooms in renter-occupied apartments in Chestnut Hills
- 11 room
- 42 rooms
- 223 rooms
- 24 rooms
- 125 rooms
- 156 rooms
- 47 rooms
- 28 rooms
- 69+ rooms
Owner-occupied
Renter-occupied

- Bedrooms in owner-occupied houses and condos in Chestnut Hills
- 0no bedroom
- 01 bedroom
- 72 bedrooms
- 413 bedrooms
- 534 bedrooms
- 485+ bedrooms

- Bedrooms in renter-occupied apartments in Chestnut Hills
- 1no bedroom
- 191 bedroom
- 102 bedrooms
- 233 bedrooms
- 24 bedrooms
- 65+ bedrooms
Average number of cars or other vehicles available in houses/condos:
Average number of cars or other vehicles available in apartments:
| This neighborhood: | 0.7 |
| Raleigh: | 2.0 |
Average number of cars or other vehicles available in apartments:
| Here: | 1.5 |
| city: | 1.4 |
Percentage of units with a mortgage:
| Chestnut Hills: | 73.0% |
| Raleigh: | 74.4% |
Average estimated value of detached houses in 2022 (74.2% of all units):
| Chestnut Hills: | $563,778 |
| North Carolina: | $375,326 |

- Year house built in Chestnut Hills
- 12020 or later
- 182010 to 2019
- 42000 to 2009
- 91990 to 1999
- 211980 to 1989
- 471970 to 1979
- 731960 to 1969
- 81950 to 1959
- 01940 to 1949
- 01939 or earlier

City-data.com crime index for city in 2020 (higher means more crime):
| City: | 216.7 |
| U.S. average: | 219.5 |
Travel time to work (commute)
![Travel time to work (commute)]()
- 6Less than 5 minutes
- 125 to 9 minutes
- 2410 to 14 minutes
- 2415 to 19 minutes
- 2920 to 24 minutes
- 925 to 29 minutes
- 2630 to 34 minutes
- 235 to 39 minutes
- 440 to 44 minutes
- 1445 to 59 minutes
- 360 to 89 minutes

Means of transportation to work
![Means of transportation to work]()
- 69.7%161Drove a car alone
- 5.2%12Carpooled
- 2.2%5Bus
- 1.7%4Taxi
- 0.4%1Bicycle
- 0.4%1Walked
- 3.5%8Other means
- 22.9%53Worked at home

Time leaving home to go to work
![Time leaving home to go to work]()
- 712:00 a.m. to 4:59 a.m.
- 95:00 a.m. to 5:29 a.m.
- 35:30 a.m. to 5:59 a.m.
- 66:00 a.m. to 6:29 a.m.
- 146:30 a.m. to 6:59 a.m.
- 227:00 a.m. to 7:29 a.m.
- 187:30 a.m. to 7:59 a.m.
- 288:00 a.m. to 8:29 a.m.
- 128:30 a.m. to 8:59 a.m.
- 189:00 a.m. to 9:59 a.m.
- 310:00 a.m. to 10:59 a.m.
- 111:00 a.m. to 11:59 a.m.
- 812:00 p.m. to 3:59 p.m.
- 74:00 p.m. to 11:59 p.m.

Occupations of males:
- Percentage of males in management occupations (except farmers):
Here: 9.7% city: 14.5%
- Percentage of males in business and financial operations occupations:
Here: 6.7% city: 7.5%
- Percentage of males in computer and mathematical occupations:
Here: 9.6% city: 9.1%
- Percentage of males in architecture and engineering occupations:
Here: 1.1% city: 4.3%
- Percentage of males in life, physical, and social science occupations:
Here: 2.3% city: 1.6%
- Percentage of males in legal occupations:
Here: 5.2% city: 1.8%
- Percentage of males in education, training, and library occupations:
Here: 2.5% city: 3.6%
- Percentage of males in arts, design, entertainment, sports, and media occupations:
Here: 2.3% city: 2.5%
- Percentage of males in healthcare practitioners and technical occupations:
Here: 5.1% city: 3.2%
- Percentage of males in service occupations:
Here: 14.4% city: 11.6%
- Percentage of males in sales and office occupations:
Here: 24.0% city: 16.9%
- Percentage of males in construction, extraction, and maintenance occupations:
Here: 2.6% city: 6.8%
- Percentage of males in production occupations:
Here: 5.0% city: 3.4%
- Percentage of males in transportation occupations:
Here: 1.3% city: 4.9%
- Percentage of males in material moving occupations:
Here: 6.6% city: 4.0%
Occupations of females:
- Percentage of females in management occupations (except farmers):
Here: 16.5% city: 12.5%
- Percentage of females in business and financial operations occupations:
Here: 15.8% city: 10.5%
- Percentage of females in computer and mathematical occupations:
Here: 2.1% city: 3.2%
- Percentage of females in legal occupations:
Here: 8.3% city: 1.9%
- Percentage of females in education, training, and library occupations:
Here: 6.2% city: 8.8%
- Percentage of females in arts, design, entertainment, sports, and media occupations:
Here: 8.1% city: 2.9%
- Percentage of females in healthcare practitioners and technical occupations:
Here: 7.1% city: 8.8%
- Percentage of females in service occupations:
Here: 4.5% city: 15.9%
- Percentage of females in sales and office occupations:
Here: 14.8% city: 24.5%
- Percentage of females in production occupations:
Here: 5.8% city: 2.1%
- Percentage of females in material moving occupations:
Here: 9.9% city: 1.2%
Education in this neighborhood (subdivision or community):
- Percentage of people 3 years and older in K-12 schools:
Chestnut Hills: 29.8% Raleigh: 14.0%
- Percentage of people 3 years and older in undergraduate colleges:
Chestnut Hills: 3.9% Raleigh: 8.1%
- Percentage of people 3 years and older in grad. or professional schools:
Chestnut Hills: 1.3% Raleigh: 2.4%
- Percentage of students K-12 enrolled in private schools:
Chestnut Hills: 35.1% Raleigh: 10.9%
Percentage of population below poverty level:
| Chestnut Hills: | 1.9% |
| Raleigh: | 11.0% |
Median year owner moved in (as recorded in 2022):
| Chestnut Hills: | 2009 |
| Raleigh: | 2013 |
Percentage of married-couple families with both working:
| Chestnut Hills: | 72.3% |
| Raleigh: | 76.8% |

- 49.6%Utility gas
- 38.5%Electricity
- 10.0%Bottled, tank, or LP gas
- 1.1%Fuel oil, kerosene, etc.
- 0.7%Wood
Roads and streets:
Wimbleton Dr
Length: 0.81 miles
Directions: E-W, N-S, SE-NW, SW-NE
Address range: 500 to 1199
Directions: E-W, N-S, SE-NW, SW-NE
Address range: 500 to 1199
Shelley Rd
Length: 0.73 miles
Direction: E-W
Address range: 500 to 1199
Direction: E-W
Address range: 500 to 1199
Cranbrook Rd
Length: 0.45 miles
Directions: E-W, N-S, SE-NW
Address range: 620 to 999
Directions: E-W, N-S, SE-NW
Address range: 620 to 999
Collins Dr
Length: 0.29 miles
Directions: E-W, N-S, SE-NW
Address range: 900 to 1099
Directions: E-W, N-S, SE-NW
Address range: 900 to 1099
Temple Dr
Length: 0.27 miles
Direction: E-W
Address range: 900 to 1099
Direction: E-W
Address range: 900 to 1099
Dixon Dr
Length: 0.19 miles
Direction: N-S
Address range: 5200 to 5399
Direction: N-S
Address range: 5200 to 5399
Collingswood Dr
Length: 0.08 miles
Direction: N-S
Address range: 5100 to 5199
Direction: N-S
Address range: 5100 to 5199