Charleston McNeil neighborhood in Las Vegas, Nevada (NV), 89102 detailed profile
Settings
X

Business Search - 14 Million verified businesses
Area: 0.376 square miles
Population: 1,613
Population density:
| Charleston McNeil: | 4,287 people per square mile |
| Las Vegas: | 5,792 people per square mile |

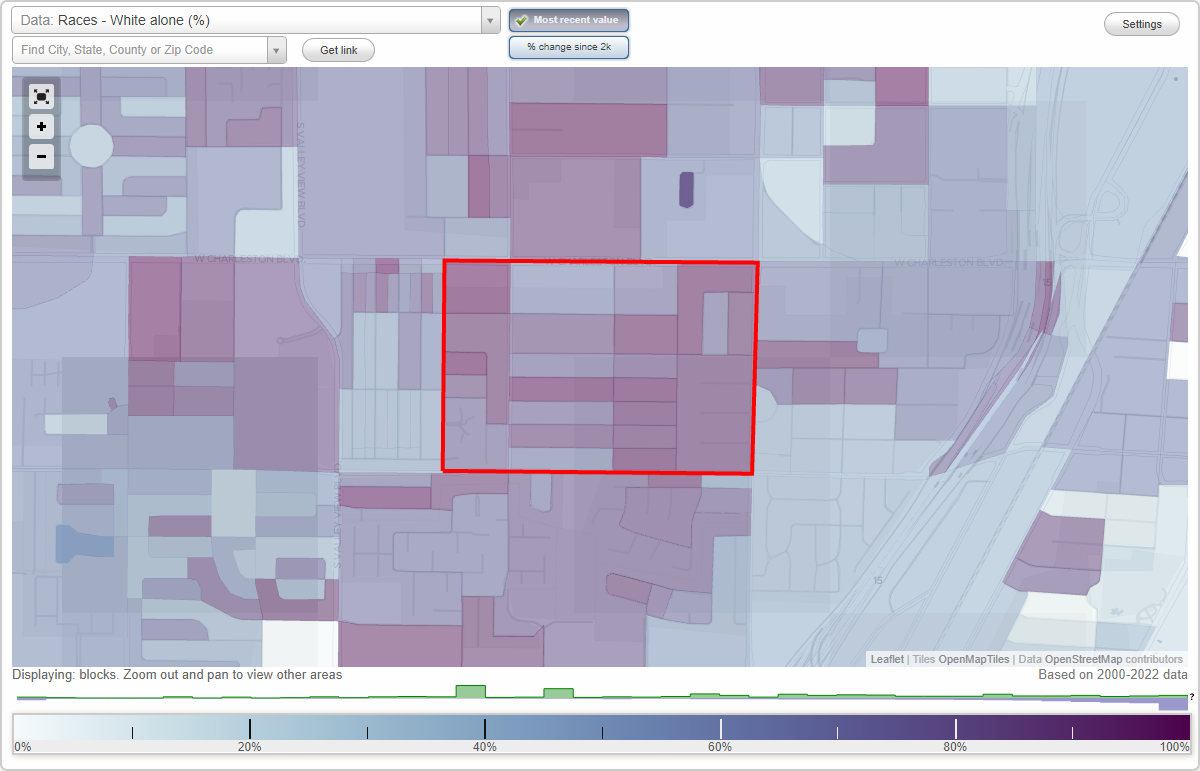
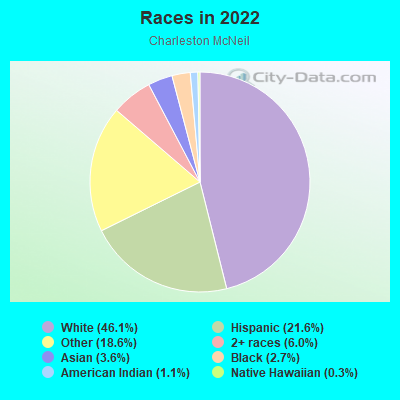
- 92346.1%White
- 43321.6%Hispanic or Latino
- 37218.6%Some other race
- 1216.0%Two or more races
- 723.6%Asian
- 542.7%Black
- 231.1%American Indian
- 60.3%Native Hawaiian and Other
Pacific Islander
Distribution of median household income
![Distribution of median household income]()
- 85Less than $10,000
- 77$10,000 to $19,999
- 131$20,000 to $29,999
- 147$30,000 to $39,999
- 123$40,000 to $49,999
- 33$50,000 to $59,999
- 55$60,000 to $74,999
- 70$75,000 to $99,999
- 38$100,000 to $124,999
- 71$125,000 to $149,999
- 61$150,000 to $199,999
- 153$200,000 or more

Distribution of owner-occupied house/condo value
![Distribution of owner-occupied house/condo value]()
- 49Less than $50,000
- 2$100,000 to $149,999
- 16$150,000 to $199,999
- 9$200,000 to $249,999
- 31$250,000 to $299,999
- 72$300,000 to $399,999
- 149$400,000 to $499,999
- 311$500,000 to $749,999
- 81$750,000 to $999,999
- 37$1,000,000 or more

Distribution of rent paid by renters
![Distribution of rent paid by renters]()
- 66$300 to $399
- 4$500 to $599
- 4$600 to $699
- 38$700 to $799
- 55$800 to $899
- 85$900 to $999
- 130$1,000 to $1,249
- 47$1,250 to $1,499
- 23$1,500 to $1,999
- 31$2,000 or more

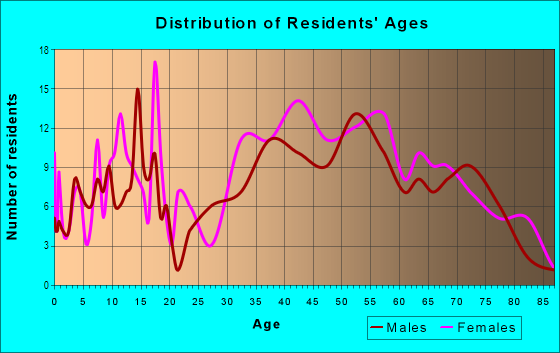
| Males: | 753 |
| Females: | 860 |
Males:
| This neighborhood: | 40.2 years |
| Whole city: | 38.4 years |
| This neighborhood: | 51.3 years |
| Whole city: | 38.9 years |
Average household size:
| Charleston McNeil: | 2.3 people |
| Las Vegas: | 2.7 people |
Percentage of family households:
| Charleston McNeil: | 38.9% |
| Las Vegas: | 45.8% |
| Here: | 41.7% |
| Las Vegas: | 40.9% |
Percentage of married-couple families with children (among all households):
| Charleston McNeil: | 26.5% |
| Las Vegas: | 23.4% |
Percentage of single-mother households (among all households):
| Charleston McNeil: | 16.7% |
| Las Vegas: | 10.1% |
Percentage of never married males 15 years old and over:
Percentage of never married females 15 years old and over:
| Charleston McNeil: | 19.0% |
| Las Vegas: | 19.7% |
Percentage of never married females 15 years old and over:
| Charleston McNeil: | 10.2% |
| city: | 17.0% |
Percentage of people that speak English not well or not at all:
| Charleston McNeil: | 0.4% |
| Las Vegas: | 7.0% |
Percentage of people born in this state:
Percentage of people born in another U.S. state:
Percentage of native residents but born outside the U.S.:
Percentage of foreign born residents:
| Here: | 22.0% |
| Las Vegas: | 27.3% |
Percentage of people born in another U.S. state:
| Charleston McNeil: | 60.8% |
| Las Vegas: | 49.8% |
Percentage of native residents but born outside the U.S.:
| Here: | 1.8% |
| city: | 1.9% |
Percentage of foreign born residents:
| Here: | 15.4% |
| Las Vegas: | 21.0% |
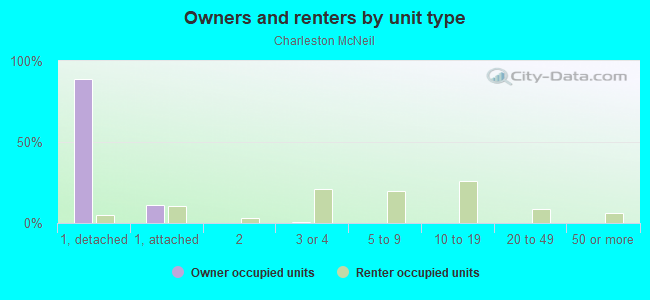
Owner-occupied
Renter-occupied

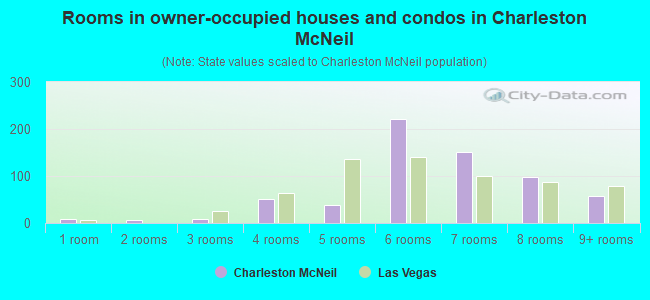
- Rooms in owner-occupied houses and condos in Charleston McNeil
- 81 room
- 62 rooms
- 83 rooms
- 524 rooms
- 385 rooms
- 2216 rooms
- 1527 rooms
- 978 rooms
- 589+ rooms
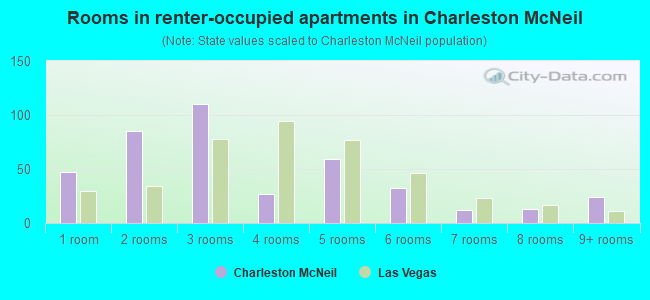
- Rooms in renter-occupied apartments in Charleston McNeil
- 471 room
- 852 rooms
- 1103 rooms
- 274 rooms
- 595 rooms
- 326 rooms
- 127 rooms
- 138 rooms
- 249+ rooms
Owner-occupied
Renter-occupied
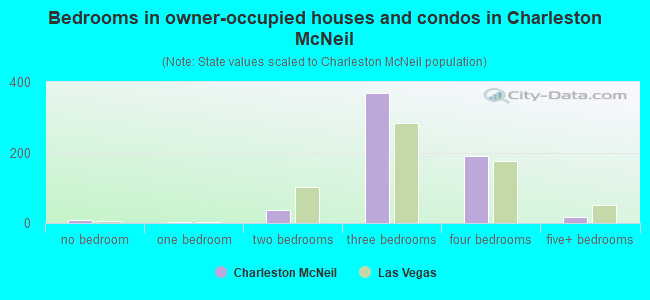
- Bedrooms in owner-occupied houses and condos in Charleston McNeil
- 8no bedroom
- 31 bedroom
- 372 bedrooms
- 3683 bedrooms
- 1904 bedrooms
- 175+ bedrooms
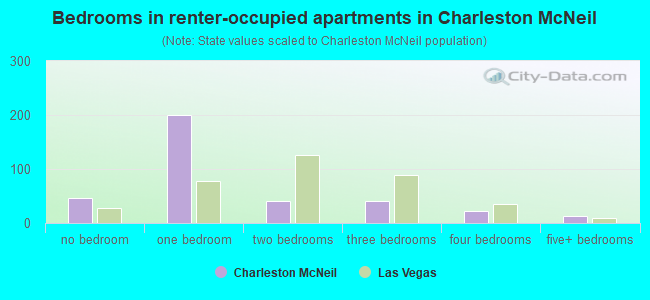
- Bedrooms in renter-occupied apartments in Charleston McNeil
- 47no bedroom
- 2001 bedroom
- 412 bedrooms
- 413 bedrooms
- 234 bedrooms
- 135+ bedrooms
Average number of cars or other vehicles available in houses/condos:
Average number of cars or other vehicles available in apartments:
| This neighborhood: | 1.5 |
| Las Vegas: | 2.0 |
Average number of cars or other vehicles available in apartments:
| Here: | 2.6 |
| city: | 1.3 |
Percentage of units with a mortgage:
| Charleston McNeil: | 67.9% |
| Las Vegas: | 69.3% |
Average estimated value of detached houses in 2022 (82.4% of all units):
| Charleston McNeil: | $567,715 |
| Nevada: | $549,327 |
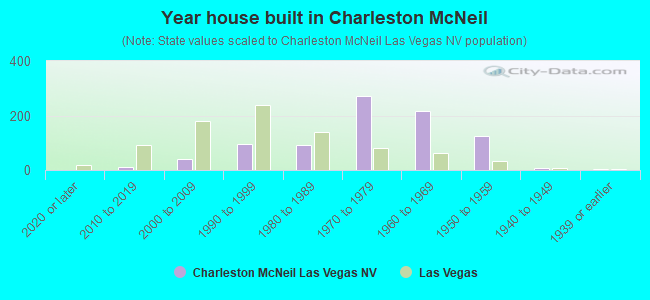
- Year house built in Charleston McNeil
- 02020 or later
- 122010 to 2019
- 422000 to 2009
- 961990 to 1999
- 901980 to 1989
- 2711970 to 1979
- 2151960 to 1969
- 1241950 to 1959
- 61940 to 1949
- 21939 or earlier
City-data.com crime index for city in 2020 (higher means more crime):
| City: | 280.7 |
| U.S. average: | 219.5 |
Travel time to work (commute)
![Travel time to work (commute)]()
- 3Less than 5 minutes
- 705 to 9 minutes
- 14710 to 14 minutes
- 20315 to 19 minutes
- 10320 to 24 minutes
- 2225 to 29 minutes
- 5530 to 34 minutes
- 235 to 39 minutes
- 1540 to 44 minutes
- 845 to 59 minutes
- 260 to 89 minutes
- 590 or more minutes

Means of transportation to work
![Means of transportation to work]()
- 73.2%546Drove a car alone
- 14.2%106Carpooled
- 2.1%16Bus
- 0.1%1Long-distance train or commuter rail
- 0.8%6Motorcycle
- 4.7%35Bicycle
- 3.9%29Other means
- 10.6%79Worked at home

Time leaving home to go to work
![Time leaving home to go to work]()
- 412:00 a.m. to 4:59 a.m.
- 195:00 a.m. to 5:29 a.m.
- 405:30 a.m. to 5:59 a.m.
- 556:00 a.m. to 6:29 a.m.
- 686:30 a.m. to 6:59 a.m.
- 817:00 a.m. to 7:29 a.m.
- 757:30 a.m. to 7:59 a.m.
- 258:00 a.m. to 8:29 a.m.
- 658:30 a.m. to 8:59 a.m.
- 769:00 a.m. to 9:59 a.m.
- 1910:00 a.m. to 10:59 a.m.
- 3512:00 p.m. to 3:59 p.m.
- 464:00 p.m. to 11:59 p.m.

Occupations of males:
- Percentage of males in management occupations (except farmers):
Here: 8.2% city: 9.6%
- Percentage of males in business and financial operations occupations:
Here: 5.8% city: 3.6%
- Percentage of males in computer and mathematical occupations:
Here: 3.8% city: 3.4%
- Percentage of males in legal occupations:
Here: 3.5% city: 0.9%
- Percentage of males in education, training, and library occupations:
Here: 12.2% city: 2.5%
- Percentage of males in healthcare practitioners and technical occupations:
Here: 2.0% city: 3.3%
- Percentage of males in service occupations:
Here: 10.1% city: 23.3%
- Percentage of males in sales and office occupations:
Here: 20.2% city: 16.6%
- Percentage of males in construction, extraction, and maintenance occupations:
Here: 9.6% city: 10.6%
- Percentage of males in transportation occupations:
Here: 13.9% city: 6.6%
- Percentage of males in material moving occupations:
Here: 6.7% city: 5.4%
Occupations of females:
- Percentage of females in management occupations (except farmers):
Here: 18.6% city: 8.5%
- Percentage of females in business and financial operations occupations:
Here: 3.9% city: 5.7%
- Percentage of females in community and social services occupations:
Here: 4.8% city: 1.9%
- Percentage of females in legal occupations:
Here: 5.7% city: 1.5%
- Percentage of females in education, training, and library occupations:
Here: 6.4% city: 8.0%
- Percentage of females in arts, design, entertainment, sports, and media occupations:
Here: 1.2% city: 1.8%
- Percentage of females in healthcare practitioners and technical occupations:
Here: 7.4% city: 7.4%
- Percentage of females in service occupations:
Here: 6.2% city: 26.5%
- Percentage of females in sales and office occupations:
Here: 43.2% city: 30.5%
- Percentage of females in production occupations:
Here: 1.4% city: 1.8%
Percentage of people 16-64 in Armed Forces:
| Charleston McNeil: | 0.2% |
| Las Vegas: | 1.0% |
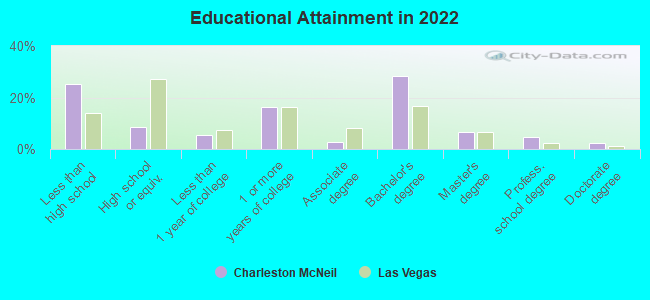
Education in this neighborhood (subdivision or community):
- Percentage of people 3 years and older in K-12 schools:
Charleston McNeil: 10.8% Las Vegas: 17.4%
- Percentage of people 3 years and older in undergraduate colleges:
Charleston McNeil: 5.0% Las Vegas: 4.2%
- Percentage of people 3 years and older in grad. or professional schools:
Charleston McNeil: 2.7% Las Vegas: 1.0%
- Percentage of students K-12 enrolled in private schools:
Charleston McNeil: 75.9% Las Vegas: 12.9%
Percentage of population below poverty level:
| Charleston McNeil: | 7.5% |
| Las Vegas: | 14.1% |
Median year owner moved in (as recorded in 2022):
| Charleston McNeil: | 2006 |
| Las Vegas: | 2015 |
Percentage of married-couple families with both working:
| Charleston McNeil: | 61.2% |
| Las Vegas: | 62.0% |
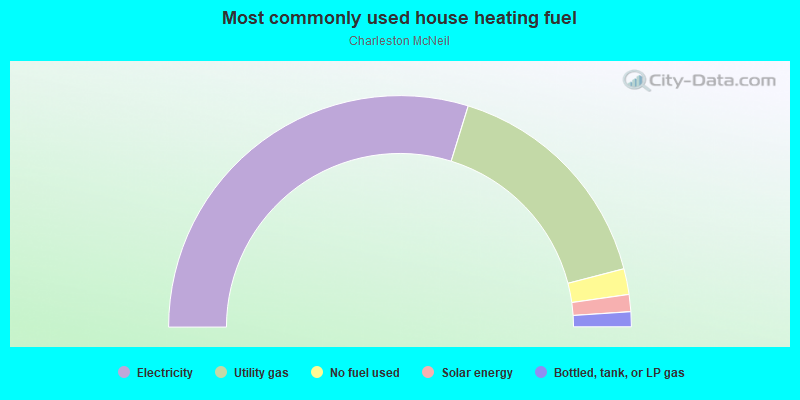
- 59.6%Electricity
- 32.4%Utility gas
- 3.6%No fuel used
- 2.4%Solar energy
- 2.1%Bottled, tank, or LP gas
Highways in this neighborhood:
S Rancho Dr
Length: 0.43 miles
Direction: N-S
Address range: 1126 to 1399
Direction: N-S
Address range: 1126 to 1399
Roads and streets:
Mason Ave
Length: 0.72 miles
Direction: E-W
Address range: 2300 to 3099
Direction: E-W
Address range: 2300 to 3099
W Oakey Blvd
Length: 0.72 miles
Direction: E-W
Address range: 2300 to 3099
Direction: E-W
Address range: 2300 to 3099
Colanthe Ave
Length: 0.56 miles
Direction: E-W
Address range: 2600 to 3199
Direction: E-W
Address range: 2600 to 3199
Ashby Ave
Length: 0.50 miles
Direction: E-W
Address range: 2600 to 3099
Direction: E-W
Address range: 2600 to 3099
Burton Ave
Length: 0.50 miles
Direction: E-W
Address range: 2600 to 3099
Direction: E-W
Address range: 2600 to 3099
Bryant Ave
Length: 0.50 miles
Direction: E-W
Address range: 2600 to 3099
Direction: E-W
Address range: 2600 to 3099
Gilmary Ave
Length: 0.49 miles
Direction: E-W
Address range: 2600 to 3099
Direction: E-W
Address range: 2600 to 3099
Campbell Dr
Length: 0.38 miles
Direction: N-S
Address range: 1200 to 1699
Direction: N-S
Address range: 1200 to 1699
Cahlan Dr
Length: 0.38 miles
Direction: N-S
Address range: 1200 to 1699
Direction: N-S
Address range: 1200 to 1699
Strong Dr
Length: 0.38 miles
Direction: N-S
Address range: 1200 to 1699
Direction: N-S
Address range: 1200 to 1699
Eaton Dr
Length: 0.26 miles
Directions: N-S, SE-NW
Address range: 1200 to 1699
Directions: N-S, SE-NW
Address range: 1200 to 1699
Llewellyn Dr
Length: 0.16 miles
Direction: E-W
Address range: 2300 to 2599
Direction: E-W
Address range: 2300 to 2599
Laurie Dr
Length: 0.15 miles
Direction: E-W
Address range: 2300 to 2599
Direction: E-W
Address range: 2300 to 2599
Sherman Pl
Length: 0.15 miles
Direction: E-W
Address range: 2300 to 2599
Direction: E-W
Address range: 2300 to 2599
Karli Dr
Length: 0.15 miles
Direction: E-W
Address range: 2300 to 2599
Direction: E-W
Address range: 2300 to 2599
Westlund Dr
Length: 0.15 miles
Direction: N-S
Address range: 1100 to 1299
Direction: N-S
Address range: 1100 to 1299
Buehler Dr
Length: 0.15 miles
Direction: N-S
Address range: 1100 to 1299
Direction: N-S
Address range: 1100 to 1299