Central Industrial District neighborhood in Garden Grove, California (CA), 92841 detailed profile
Settings
X


Business Search - 14 Million verified businesses
Area: 0.603 square miles
Population: 968
Population density:
| Central Industrial District: | 1,606 people per square mile |
| Garden Grove: | 9,391 people per square mile |

- 42330.5%Some other race
- 40529.2%Hispanic or Latino
- 27619.9%White
- 21315.3%Asian
- 423.0%Two or more races
- 271.9%Black
- 20.1%American Indian

Median household income in 2022:
| Central Industrial District: | $115,353 |
| Garden Grove: | $86,975 |
Distribution of median household income
![Distribution of median household income]()
- 8Less than $10,000
- 25$10,000 to $19,999
- 18$20,000 to $29,999
- 25$30,000 to $39,999
- 41$40,000 to $49,999
- 20$50,000 to $59,999
- 16$60,000 to $74,999
- 49$75,000 to $99,999
- 48$100,000 to $124,999
- 32$125,000 to $149,999
- 29$150,000 to $199,999
- 24$200,000 or more

Distribution of owner-occupied house/condo value
![Distribution of owner-occupied house/condo value]()
- 15Less than $50,000
- 15$50,000 to $99,999
- 3$200,000 to $249,999
- 1$250,000 to $299,999
- 14$300,000 to $399,999
- 76$400,000 to $499,999
- 97$500,000 to $749,999
- 8$750,000 to $999,999
- 135$1,000,000 or more

Distribution of rent paid by renters
![Distribution of rent paid by renters]()
- 3$200 to $299
- 10$300 to $399
- 8$500 to $599
- 9$600 to $699
- 8$1,000 to $1,249
- 9$1,250 to $1,499
- 5$1,500 to $1,999
- 202$2,000 or more

| Males: | 455 |
| Females: | 512 |
Males:
| This neighborhood: | 36.2 years |
| Whole city: | 38.0 years |
| This neighborhood: | 43.8 years |
| Whole city: | 41.0 years |
Average household size:
| Central Industrial District: | 3.0 people |
| Garden Grove: | 3.4 people |
Percentage of family households:
| Central Industrial District: | 69.7% |
| Garden Grove: | 51.1% |
| Here: | 50.6% |
| Garden Grove: | 51.4% |
Percentage of married-couple families with children (among all households):
| Central Industrial District: | 21.6% |
| Garden Grove: | 20.9% |
Percentage of single-mother households (among all households):
| Central Industrial District: | 7.4% |
| Garden Grove: | 6.8% |
Percentage of never married males 15 years old and over:
Percentage of never married females 15 years old and over:
| Central Industrial District: | 12.0% |
| Garden Grove: | 21.6% |
Percentage of never married females 15 years old and over:
| Central Industrial District: | 19.9% |
| city: | 16.3% |
Percentage of people that speak English not well or not at all:
| Central Industrial District: | 4.2% |
| Garden Grove: | 19.7% |
Percentage of people born in this state:
Percentage of people born in another U.S. state:
Percentage of native residents but born outside the U.S.:
Percentage of foreign born residents:
| Here: | 60.5% |
| Garden Grove: | 48.0% |
Percentage of people born in another U.S. state:
| Central Industrial District: | 15.1% |
| Garden Grove: | 5.9% |
Percentage of native residents but born outside the U.S.:
| Here: | 1.5% |
| city: | 1.5% |
Percentage of foreign born residents:
| Here: | 22.9% |
| Garden Grove: | 44.6% |
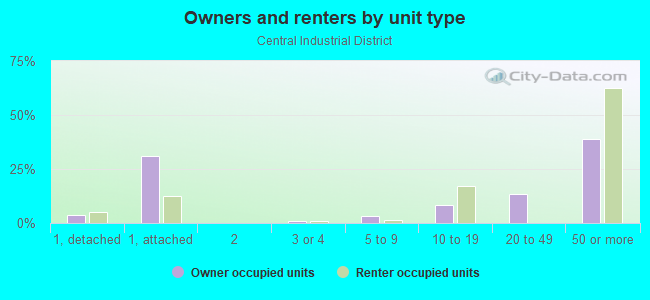
Owner-occupied
Renter-occupied

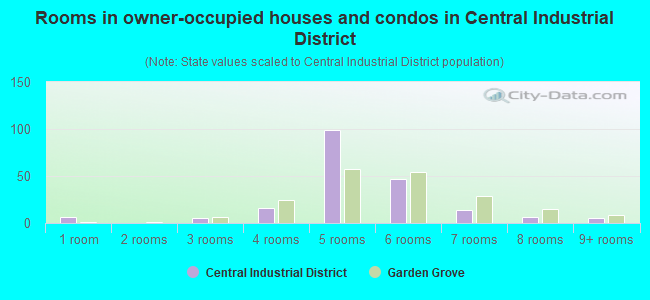
- Rooms in owner-occupied houses and condos in Central Industrial District
- 61 room
- 02 rooms
- 53 rooms
- 164 rooms
- 995 rooms
- 476 rooms
- 147 rooms
- 68 rooms
- 59+ rooms
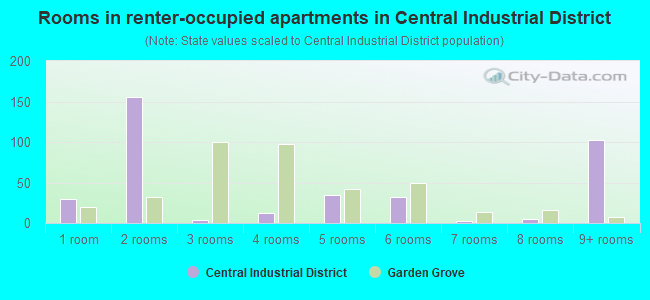
- Rooms in renter-occupied apartments in Central Industrial District
- 301 room
- 1552 rooms
- 43 rooms
- 124 rooms
- 355 rooms
- 326 rooms
- 37 rooms
- 58 rooms
- 1029+ rooms
Owner-occupied
Renter-occupied
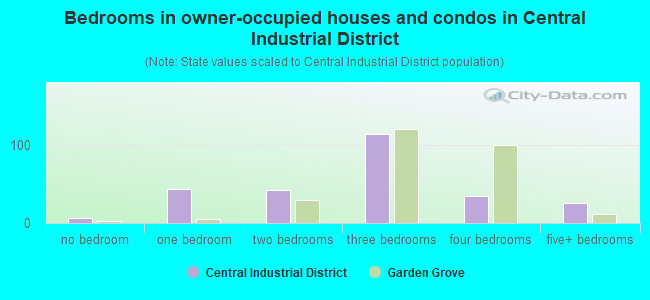
- Bedrooms in owner-occupied houses and condos in Central Industrial District
- 7no bedroom
- 441 bedroom
- 432 bedrooms
- 1153 bedrooms
- 354 bedrooms
- 265+ bedrooms
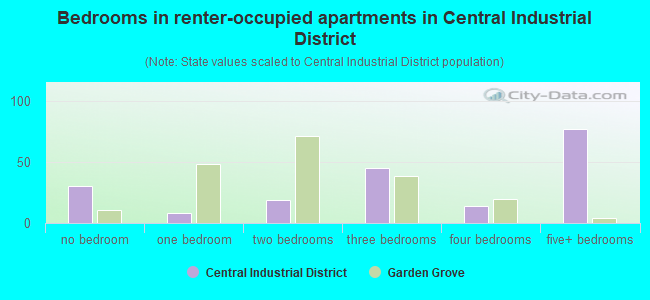
- Bedrooms in renter-occupied apartments in Central Industrial District
- 30no bedroom
- 81 bedroom
- 192 bedrooms
- 453 bedrooms
- 144 bedrooms
- 775+ bedrooms
Average number of cars or other vehicles available in houses/condos:
Average number of cars or other vehicles available in apartments:
| This neighborhood: | 2.1 |
| Garden Grove: | 2.6 |
Average number of cars or other vehicles available in apartments:
| Here: | 2.1 |
| city: | 1.9 |
Percentage of units with a mortgage:
| Central Industrial District: | 78.3% |
| Garden Grove: | 62.4% |
Average estimated value of detached houses in 2022 (17.0% of all units):
| Central Industrial District: | $845,079 |
| Garden Grove: | $835,074 |
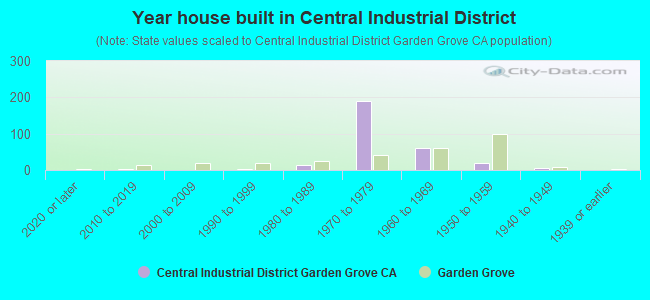
- Year house built in Central Industrial District
- 02020 or later
- 42010 to 2019
- 02000 to 2009
- 21990 to 1999
- 141980 to 1989
- 1911970 to 1979
- 601960 to 1969
- 181950 to 1959
- 61940 to 1949
- 01939 or earlier
City-data.com crime index for city in 2020 (higher means more crime):
| City: | 205.1 |
| U.S. average: | 219.5 |
Travel time to work (commute)
![Travel time to work (commute)]()
- 60Less than 5 minutes
- 175 to 9 minutes
- 510 to 14 minutes
- 5115 to 19 minutes
- 10920 to 24 minutes
- 1025 to 29 minutes
- 8230 to 34 minutes
- 2735 to 39 minutes
- 940 to 44 minutes
- 4945 to 59 minutes
- 3860 to 89 minutes
- 590 or more minutes

Means of transportation to work
![Means of transportation to work]()
- 72.8%335Drove a car alone
- 12.6%58Carpooled
- 0.4%2Bus
- 0.4%2Motorcycle
- 4.3%20Bicycle
- 1.5%7Other means
- 11.5%53Worked at home

Time leaving home to go to work
![Time leaving home to go to work]()
- 3512:00 a.m. to 4:59 a.m.
- 155:00 a.m. to 5:29 a.m.
- 175:30 a.m. to 5:59 a.m.
- 466:00 a.m. to 6:29 a.m.
- 856:30 a.m. to 6:59 a.m.
- 307:00 a.m. to 7:29 a.m.
- 297:30 a.m. to 7:59 a.m.
- 348:00 a.m. to 8:29 a.m.
- 318:30 a.m. to 8:59 a.m.
- 199:00 a.m. to 9:59 a.m.
- 610:00 a.m. to 10:59 a.m.
- 2311:00 a.m. to 11:59 a.m.
- 2612:00 p.m. to 3:59 p.m.
- 24:00 p.m. to 11:59 p.m.

Occupations of males:
- Percentage of males in management occupations (except farmers):
Here: 12.8% city: 9.2%
- Percentage of males in business and financial operations occupations:
Here: 1.3% city: 3.5%
- Percentage of males in computer and mathematical occupations:
Here: 8.7% city: 4.6%
- Percentage of males in architecture and engineering occupations:
Here: 3.6% city: 3.9%
- Percentage of males in life, physical, and social science occupations:
Here: 1.9% city: 0.7%
- Percentage of males in legal occupations:
Here: 2.5% city: 0.5%
- Percentage of males in education, training, and library occupations:
Here: 2.8% city: 2.1%
- Percentage of males in arts, design, entertainment, sports, and media occupations:
Here: 1.3% city: 1.9%
- Percentage of males in healthcare practitioners and technical occupations:
Here: 1.9% city: 2.1%
- Percentage of males in service occupations:
Here: 10.2% city: 16.3%
- Percentage of males in sales and office occupations:
Here: 18.4% city: 16.3%
- Percentage of males in construction, extraction, and maintenance occupations:
Here: 5.1% city: 9.9%
- Percentage of males in production occupations:
Here: 6.8% city: 13.3%
- Percentage of males in transportation occupations:
Here: 2.9% city: 5.4%
- Percentage of males in material moving occupations:
Here: 11.1% city: 4.4%
Occupations of females:
- Percentage of females in management occupations (except farmers):
Here: 7.2% city: 6.6%
- Percentage of females in business and financial operations occupations:
Here: 4.9% city: 6.4%
- Percentage of females in computer and mathematical occupations:
Here: 3.4% city: 1.7%
- Percentage of females in life, physical, and social science occupations:
Here: 1.6% city: 0.5%
- Percentage of females in education, training, and library occupations:
Here: 8.1% city: 6.3%
- Percentage of females in arts, design, entertainment, sports, and media occupations:
Here: 2.4% city: 2.1%
- Percentage of females in healthcare practitioners and technical occupations:
Here: 2.8% city: 6.5%
- Percentage of females in service occupations:
Here: 26.5% city: 27.0%
- Percentage of females in sales and office occupations:
Here: 31.4% city: 26.7%
- Percentage of females in farming, fishing, and forestry occupations:
Here: 4.0% city: 0.4%
- Percentage of females in production occupations:
Here: 3.4% city: 8.6%
- Percentage of females in material moving occupations:
Here: 4.2% city: 2.2%
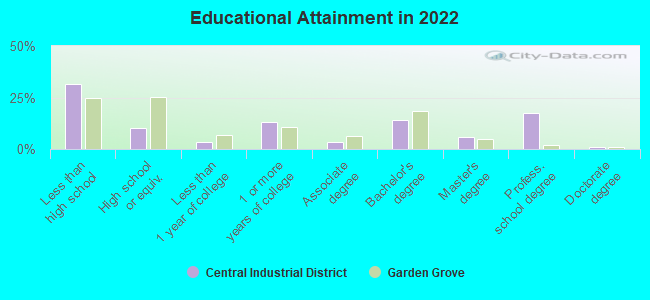
Education in this neighborhood (subdivision or community):
- Percentage of people 3 years and older in K-12 schools:
Central Industrial District: 26.2% Garden Grove: 15.3%
- Percentage of people 3 years and older in undergraduate colleges:
Central Industrial District: 6.4% Garden Grove: 6.5%
- Percentage of people 3 years and older in grad. or professional schools:
Central Industrial District: 1.2% Garden Grove: 1.8%
- Percentage of students K-12 enrolled in private schools:
Central Industrial District: 32.8% Garden Grove: 4.3%
Percentage of population below poverty level:
| Central Industrial District: | 20.7% |
| Garden Grove: | 11.3% |
Median year owner moved in (as recorded in 2022):
| Central Industrial District: | 2006 |
| Garden Grove: | 2004 |
Percentage of married-couple families with both working:
| Central Industrial District: | 57.6% |
| Garden Grove: | 70.1% |
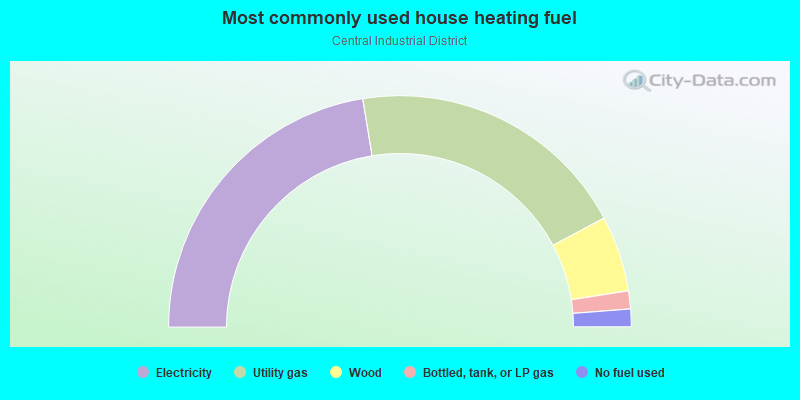
- 44.9%Electricity
- 39.6%Utility gas
- 10.6%Wood
- 2.5%Bottled, tank, or LP gas
- 2.5%No fuel used
Roads and streets:
Western Ave
Length: 0.65 miles
Direction: N-S
Address range: 12370 to 12999
Direction: N-S
Address range: 12370 to 12999
Industry St
Length: 0.64 miles
Directions: N-S, SW-NE
Address range: 12000 to 12699
Directions: N-S, SW-NE
Address range: 12000 to 12699
Lampson Ave
Length: 0.58 miles
Direction: E-W
Address range: 7086 to 7499
Direction: E-W
Address range: 7086 to 7499
Monarch St
Length: 0.48 miles
Direction: N-S
Address range: 12366 to 12851
Direction: N-S
Address range: 12366 to 12851
Eagle Dr
Length: 0.34 miles
Directions: E-W, N-S, SW-NE
Directions: E-W, N-S, SW-NE
Edison Way
Length: 0.32 miles
Direction: N-S
Address range: 12136 to 12499
Direction: N-S
Address range: 12136 to 12499
Anaconda Ave
Length: 0.30 miles
Direction: E-W
Address range: 7248 to 7499
Direction: E-W
Address range: 7248 to 7499
Acacia Ave
Length: 0.13 miles
Direction: E-W
Address range: 7086 to 7299
Direction: E-W
Address range: 7086 to 7299
Belgrave Ave
Length: 0.13 miles
Direction: E-W
Address range: 7170 to 7499
Direction: E-W
Address range: 7170 to 7499
Pala Dr
Length: 0.12 miles
Direction: N-S
Address range: 12600 to 12799
Direction: N-S
Address range: 12600 to 12799
Railroad features:
Union Pacific RR
Length: 0.90 miles
Directions: E-W, N-S, SE-NW
Directions: E-W, N-S, SE-NW