Center Park neighborhood in Inglewood, California (CA), 90303 detailed profile
Settings
X


Business Search - 14 Million verified businesses
Area: 0.141 square miles
Population: 2,537
Population density:
| Center Park: | 17,998 people per square mile |
| Inglewood: | 11,344 people per square mile |

- 2,15382.8%Hispanic or Latino
- 2459.4%Black
- 913.5%White
- 501.9%Asian
- 291.1%American Indian
- 200.8%Two or more races
- 120.5%Some other race

Median household income in 2022:
| Center Park: | $60,087 |
| Inglewood: | $62,601 |
Distribution of median household income
![Distribution of median household income]()
- 24Less than $10,000
- 30$10,000 to $19,999
- 29$20,000 to $29,999
- 172$30,000 to $39,999
- 61$40,000 to $49,999
- 79$50,000 to $59,999
- 55$60,000 to $74,999
- 113$75,000 to $99,999
- 61$100,000 to $124,999
- 14$125,000 to $149,999
- 91$150,000 to $199,999
- 44$200,000 or more

Distribution of owner-occupied house/condo value
![Distribution of owner-occupied house/condo value]()
- 41Less than $50,000
- 4$50,000 to $99,999
- 10$200,000 to $249,999
- 12$250,000 to $299,999
- 35$300,000 to $399,999
- 30$400,000 to $499,999
- 126$500,000 to $749,999
- 49$750,000 to $999,999
- 68$1,000,000 or more

Distribution of rent paid by renters
![Distribution of rent paid by renters]()
- 11$200 to $299
- 7$400 to $499
- 10$500 to $599
- 30$700 to $799
- 20$800 to $899
- 14$900 to $999
- 66$1,000 to $1,249
- 80$1,250 to $1,499
- 216$1,500 to $1,999
- 113$2,000 or more

Median rent in 2022:
| Center Park: | $1,638 |
| Inglewood: | $1,583 |
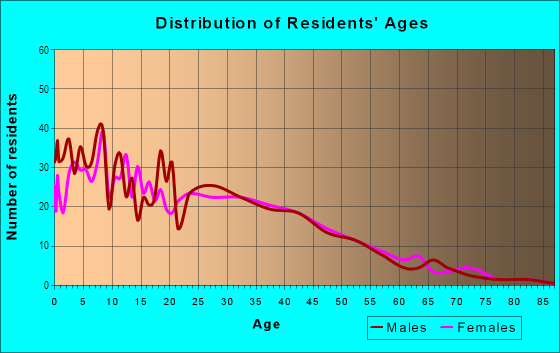
| Males: | 1,358 |
| Females: | 1,178 |
Males:
| This neighborhood: | 32.1 years |
| Whole city: | 39.0 years |
| This neighborhood: | 33.3 years |
| Whole city: | 36.6 years |
Average household size:
| Center Park: | 3.5 people |
| Inglewood: | 2.8 people |
Percentage of family households:
| Center Park: | 43.8% |
| Inglewood: | 45.5% |
| Here: | 48.1% |
| Inglewood: | 36.8% |
Percentage of married-couple families with children (among all households):
| Center Park: | 19.0% |
| Inglewood: | 21.5% |
Percentage of single-mother households (among all households):
| Center Park: | 3.5% |
| Inglewood: | 8.9% |
Percentage of never married males 15 years old and over:
Percentage of never married females 15 years old and over:
| Center Park: | 24.1% |
| Inglewood: | 21.8% |
Percentage of never married females 15 years old and over:
| Center Park: | 17.2% |
| city: | 22.9% |
Percentage of people that speak English not well or not at all:
| Center Park: | 24.6% |
| Inglewood: | 11.3% |
Percentage of people born in this state:
Percentage of people born in another U.S. state:
Percentage of native residents but born outside the U.S.:
Percentage of foreign born residents:
| Here: | 53.1% |
| Inglewood: | 53.8% |
Percentage of people born in another U.S. state:
| Center Park: | 3.5% |
| Inglewood: | 12.9% |
Percentage of native residents but born outside the U.S.:
| Here: | 2.0% |
| city: | 1.5% |
Percentage of foreign born residents:
| Here: | 41.4% |
| Inglewood: | 31.8% |

Owner-occupied
Renter-occupied


- Rooms in owner-occupied houses and condos in Center Park
- 61 room
- 102 rooms
- 303 rooms
- 414 rooms
- 295 rooms
- 896 rooms
- 477 rooms
- 218 rooms
- 59+ rooms

- Rooms in renter-occupied apartments in Center Park
- 241 room
- 332 rooms
- 853 rooms
- 874 rooms
- 2005 rooms
- 366 rooms
- 117 rooms
- 08 rooms
- 09+ rooms
Owner-occupied
Renter-occupied

- Bedrooms in owner-occupied houses and condos in Center Park
- 6no bedroom
- 131 bedroom
- 842 bedrooms
- 1103 bedrooms
- 444 bedrooms
- 45+ bedrooms

- Bedrooms in renter-occupied apartments in Center Park
- 27no bedroom
- 711 bedroom
- 1562 bedrooms
- 1643 bedrooms
- 324 bedrooms
- 115+ bedrooms
Average number of cars or other vehicles available in houses/condos:
Average number of cars or other vehicles available in apartments:
| This neighborhood: | 2.7 |
| Inglewood: | 2.2 |
Average number of cars or other vehicles available in apartments:
| Here: | 1.7 |
| city: | 1.4 |
Percentage of units with a mortgage:
| Center Park: | 67.4% |
| Inglewood: | 75.5% |

- Year house built in Center Park
- 02020 or later
- 262010 to 2019
- 732000 to 2009
- 581990 to 1999
- 311980 to 1989
- 1131970 to 1979
- 1321960 to 1969
- 2181950 to 1959
- 571940 to 1949
- 691939 or earlier

City-data.com crime index for city in 2020 (higher means more crime):
| City: | 332.1 |
| U.S. average: | 219.5 |
Travel time to work (commute)
![Travel time to work (commute)]()
- 7Less than 5 minutes
- 435 to 9 minutes
- 10010 to 14 minutes
- 10815 to 19 minutes
- 14320 to 24 minutes
- 5225 to 29 minutes
- 20930 to 34 minutes
- 3735 to 39 minutes
- 6440 to 44 minutes
- 11145 to 59 minutes
- 5860 to 89 minutes
- 4190 or more minutes

Means of transportation to work
![Means of transportation to work]()
- 77.4%980Drove a car alone
- 13.0%164Carpooled
- 5.1%64Bus
- 1.3%17Taxi
- 1.4%18Motorcycle
- 0.9%12Bicycle
- 1.7%21Walked
- 3.5%44Other means
- 2.1%27Worked at home

Time leaving home to go to work
![Time leaving home to go to work]()
- 9712:00 a.m. to 4:59 a.m.
- 665:00 a.m. to 5:29 a.m.
- 1055:30 a.m. to 5:59 a.m.
- 636:00 a.m. to 6:29 a.m.
- 286:30 a.m. to 6:59 a.m.
- 1577:00 a.m. to 7:29 a.m.
- 607:30 a.m. to 7:59 a.m.
- 1008:00 a.m. to 8:29 a.m.
- 178:30 a.m. to 8:59 a.m.
- 519:00 a.m. to 9:59 a.m.
- 6010:00 a.m. to 10:59 a.m.
- 1211:00 a.m. to 11:59 a.m.
- 9312:00 p.m. to 3:59 p.m.
- 404:00 p.m. to 11:59 p.m.

Occupations of males:
- Percentage of males in management occupations (except farmers):
Here: 2.4% city: 7.0%
- Percentage of males in computer and mathematical occupations:
Here: 1.1% city: 2.6%
- Percentage of males in community and social services occupations:
Here: 2.4% city: 1.9%
- Percentage of males in education, training, and library occupations:
Here: 1.9% city: 2.5%
- Percentage of males in service occupations:
Here: 25.9% city: 24.3%
- Percentage of males in sales and office occupations:
Here: 15.3% city: 18.5%
- Percentage of males in farming, fishing, and forestry occupations:
Here: 4.0% city: 0.4%
- Percentage of males in construction, extraction, and maintenance occupations:
Here: 9.4% city: 8.9%
- Percentage of males in production occupations:
Here: 15.3% city: 4.6%
- Percentage of males in transportation occupations:
Here: 15.4% city: 9.0%
- Percentage of males in material moving occupations:
Here: 4.1% city: 7.0%
Occupations of females:
- Percentage of females in management occupations (except farmers):
Here: 5.1% city: 7.8%
- Percentage of females in business and financial operations occupations:
Here: 1.7% city: 5.2%
- Percentage of females in computer and mathematical occupations:
Here: 1.9% city: 0.5%
- Percentage of females in community and social services occupations:
Here: 7.2% city: 3.3%
- Percentage of females in legal occupations:
Here: 4.2% city: 0.6%
- Percentage of females in service occupations:
Here: 31.3% city: 25.6%
- Percentage of females in sales and office occupations:
Here: 20.7% city: 31.5%
- Percentage of females in farming, fishing, and forestry occupations:
Here: 1.9% city: 0.2%
- Percentage of females in production occupations:
Here: 16.3% city: 3.8%
- Percentage of females in transportation occupations:
Here: 2.6% city: 1.9%
- Percentage of females in material moving occupations:
Here: 5.8% city: 3.6%
Education in this neighborhood (subdivision or community):
- Percentage of people 3 years and older in K-12 schools:
Center Park: 20.6% Inglewood: 16.4%
- Percentage of people 3 years and older in undergraduate colleges:
Center Park: 5.9% Inglewood: 6.3%
- Percentage of people 3 years and older in grad. or professional schools:
Center Park: 3.4% Inglewood: 1.2%
- Percentage of students K-12 enrolled in private schools:
Center Park: 1.4% Inglewood: 8.4%
Percentage of population below poverty level:
| Center Park: | 13.6% |
| Inglewood: | 16.2% |
Median year owner moved in (as recorded in 2022):
Median year renter moved in (as recorded in 2022):
| Center Park: | 1994 |
| Inglewood: | 2001 |
Median year renter moved in (as recorded in 2022):
| Center Park: | 2013 |
| Inglewood: | 2016 |
Percentage of married-couple families with both working:
| Center Park: | 45.6% |
| Inglewood: | 63.0% |

- 38.7%Utility gas
- 38.2%Electricity
- 17.6%No fuel used
- 2.7%Fuel oil, kerosene, etc.
- 1.5%Solar energy
- 1.3%Bottled, tank, or LP gas
Roads and streets:
S Yukon Ave
Length: 0.40 miles
Direction: N-S
Address range: 10800 to 11299
Direction: N-S
Address range: 10800 to 11299
S Doty Ave
Length: 0.40 miles
Direction: N-S
Address range: 10800 to 11299
Direction: N-S
Address range: 10800 to 11299
W 113th St
Length: 0.31 miles
Direction: E-W
Address range: 3600 to 3799
Direction: E-W
Address range: 3600 to 3799
W 111th Pl
Length: 0.31 miles
Direction: E-W
Address range: 3600 to 3799
Direction: E-W
Address range: 3600 to 3799
W 112th St
Length: 0.31 miles
Direction: E-W
Address range: 3600 to 3799
Direction: E-W
Address range: 3600 to 3799
W 111th St
Length: 0.31 miles
Direction: E-W
Address range: 3600 to 3799
Direction: E-W
Address range: 3600 to 3799
W 110th St
Length: 0.31 miles
Direction: E-W
Address range: 3600 to 3799
Direction: E-W
Address range: 3600 to 3799
W 109th St
Length: 0.31 miles
Direction: E-W
Address range: 3600 to 3799
Direction: E-W
Address range: 3600 to 3799
W 108th St
Length: 0.31 miles
Direction: E-W
Address range: 3600 to 3799
Direction: E-W
Address range: 3600 to 3799