Cedar Valley neighborhood in Lynnwood, Washington (WA), 98036 detailed profile
Settings
X


Business Search - 14 Million verified businesses
Area: 0.680 square miles
Population: 5,552
Population density:
| Cedar Valley: | 8,159 people per square mile |
| Lynnwood: | 5,219 people per square mile |

- 2,31338.8%White
- 1,51325.4%Hispanic or Latino
- 1,00116.8%Black
- 67611.3%Two or more races
- 4197.0%Asian
- 130.2%American Indian
- 100.2%Native Hawaiian and Other
Pacific Islander - 120.2%Some other race

Median household income in 2022:
| Cedar Valley: | $92,139 |
| Lynnwood: | $72,241 |
Distribution of median household income
![Distribution of median household income]()
- 61Less than $10,000
- 585$10,000 to $19,999
- 242$20,000 to $29,999
- 225$30,000 to $39,999
- 119$40,000 to $49,999
- 114$50,000 to $59,999
- 243$60,000 to $74,999
- 303$75,000 to $99,999
- 185$100,000 to $124,999
- 176$125,000 to $149,999
- 147$150,000 to $199,999
- 168$200,000 or more

Distribution of owner-occupied house/condo value
![Distribution of owner-occupied house/condo value]()
- 191Less than $50,000
- 96$50,000 to $99,999
- 79$100,000 to $149,999
- 73$150,000 to $199,999
- 135$200,000 to $249,999
- 16$250,000 to $299,999
- 38$300,000 to $399,999
- 162$400,000 to $499,999
- 479$500,000 to $749,999
- 174$750,000 to $999,999
- 78$1,000,000 or more

Distribution of rent paid by renters
![Distribution of rent paid by renters]()
- 16Less than $100
- 124$100 to $199
- 14$200 to $299
- 18$500 to $599
- 131$600 to $699
- 20$700 to $799
- 62$800 to $899
- 41$900 to $999
- 491$1,000 to $1,249
- 389$1,250 to $1,499
- 348$1,500 to $1,999
- 82$2,000 or more

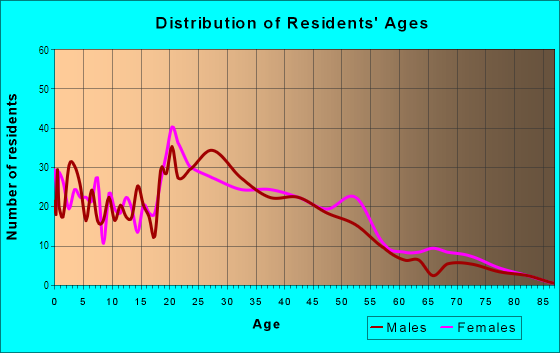
| Males: | 2,515 |
| Females: | 3,037 |
Males:
| This neighborhood: | 38.4 years |
| Whole city: | 38.5 years |
| This neighborhood: | 39.2 years |
| Whole city: | 40.7 years |
Average household size:
| Cedar Valley: | 3.0 people |
| Lynnwood: | 2.5 people |
Percentage of family households:
| Cedar Valley: | 53.7% |
| Lynnwood: | 42.8% |
| Here: | 50.2% |
| Lynnwood: | 41.5% |
Percentage of married-couple families with children (among all households):
| Cedar Valley: | 36.0% |
| Lynnwood: | 30.2% |
Percentage of single-mother households (among all households):
| Cedar Valley: | 1.7% |
| Lynnwood: | 6.8% |
Percentage of never married males 15 years old and over:
Percentage of never married females 15 years old and over:
| Cedar Valley: | 18.0% |
| Lynnwood: | 19.2% |
Percentage of never married females 15 years old and over:
| Cedar Valley: | 12.2% |
| city: | 15.0% |
Percentage of people that speak English not well or not at all:
| Cedar Valley: | 10.9% |
| Lynnwood: | 7.8% |
Percentage of people born in this state:
Percentage of people born in another U.S. state:
Percentage of native residents but born outside the U.S.:
Percentage of foreign born residents:
| Here: | 43.4% |
| Lynnwood: | 42.0% |
Percentage of people born in another U.S. state:
| Cedar Valley: | 26.4% |
| Lynnwood: | 25.3% |
Percentage of native residents but born outside the U.S.:
| Here: | 1.1% |
| city: | 2.5% |
Percentage of foreign born residents:
| Here: | 29.2% |
| Lynnwood: | 30.1% |

Owner-occupied
Renter-occupied


- Rooms in owner-occupied houses and condos in Cedar Valley
- 51 room
- 602 rooms
- 233 rooms
- 1194 rooms
- 2235 rooms
- 2586 rooms
- 1507 rooms
- 1058 rooms
- 1369+ rooms

- Rooms in renter-occupied apartments in Cedar Valley
- 571 room
- 1232 rooms
- 1733 rooms
- 4794 rooms
- 3695 rooms
- 476 rooms
- 1517 rooms
- 558 rooms
- 309+ rooms
Owner-occupied
Renter-occupied

- Bedrooms in owner-occupied houses and condos in Cedar Valley
- 5no bedroom
- 601 bedroom
- 2272 bedrooms
- 6123 bedrooms
- 2384 bedrooms
- 275+ bedrooms

- Bedrooms in renter-occupied apartments in Cedar Valley
- 57no bedroom
- 1631 bedroom
- 8222 bedrooms
- 973 bedrooms
- 184 bedrooms
- 85+ bedrooms
Average number of cars or other vehicles available in houses/condos:
Average number of cars or other vehicles available in apartments:
| This neighborhood: | 2.4 |
| Lynnwood: | 2.1 |
Average number of cars or other vehicles available in apartments:
| Here: | 2.5 |
| city: | 1.3 |
Percentage of units with a mortgage:
| Cedar Valley: | 62.0% |
| Lynnwood: | 70.4% |
Average estimated value of detached houses in 2022 (42.5% of all units):
| Cedar Valley: | $525,364 |
| Lynnwood: | $639,462 |

- Year house built in Cedar Valley
- 202020 or later
- 252010 to 2019
- 1072000 to 2009
- 2901990 to 1999
- 1981980 to 1989
- 3131970 to 1979
- 9941960 to 1969
- 3021950 to 1959
- 861940 to 1949
- 351939 or earlier

City-data.com crime index for city in 2020 (higher means more crime):
| City: | 283.8 |
| U.S. average: | 219.5 |
Travel time to work (commute)
![Travel time to work (commute)]()
- 47Less than 5 minutes
- 2625 to 9 minutes
- 18110 to 14 minutes
- 23415 to 19 minutes
- 23620 to 24 minutes
- 15225 to 29 minutes
- 58130 to 34 minutes
- 7935 to 39 minutes
- 11240 to 44 minutes
- 18045 to 59 minutes
- 22060 to 89 minutes
- 3590 or more minutes

Means of transportation to work
![Means of transportation to work]()
- 64.6%1,847Drove a car alone
- 14.0%400Carpooled
- 5.0%142Bus
- 2.4%68Light rail, streetcar or trolley
- 0.1%4Bicycle
- 2.7%76Walked
- 0.3%10Other means
- 14.8%422Worked at home

Time leaving home to go to work
![Time leaving home to go to work]()
- 11612:00 a.m. to 4:59 a.m.
- 2705:00 a.m. to 5:29 a.m.
- 1205:30 a.m. to 5:59 a.m.
- 2956:00 a.m. to 6:29 a.m.
- 1086:30 a.m. to 6:59 a.m.
- 3297:00 a.m. to 7:29 a.m.
- 427:30 a.m. to 7:59 a.m.
- 2248:00 a.m. to 8:29 a.m.
- 1328:30 a.m. to 8:59 a.m.
- 839:00 a.m. to 9:59 a.m.
- 5810:00 a.m. to 10:59 a.m.
- 10311:00 a.m. to 11:59 a.m.
- 25412:00 p.m. to 3:59 p.m.
- 1764:00 p.m. to 11:59 p.m.

Occupations of males:
- Percentage of males in management occupations (except farmers):
Here: 7.2% city: 10.7%
- Percentage of males in business and financial operations occupations:
Here: 6.3% city: 6.3%
- Percentage of males in computer and mathematical occupations:
Here: 4.0% city: 7.0%
- Percentage of males in architecture and engineering occupations:
Here: 1.5% city: 3.1%
- Percentage of males in service occupations:
Here: 15.2% city: 17.8%
- Percentage of males in sales and office occupations:
Here: 4.1% city: 14.5%
- Percentage of males in construction, extraction, and maintenance occupations:
Here: 14.2% city: 8.5%
- Percentage of males in production occupations:
Here: 7.4% city: 4.8%
- Percentage of males in transportation occupations:
Here: 7.2% city: 7.3%
- Percentage of males in material moving occupations:
Here: 12.7% city: 5.3%
Occupations of females:
- Percentage of females in management occupations (except farmers):
Here: 4.2% city: 6.8%
- Percentage of females in business and financial operations occupations:
Here: 18.1% city: 7.0%
- Percentage of females in legal occupations:
Here: 1.2% city: 1.6%
- Percentage of females in education, training, and library occupations:
Here: 1.6% city: 7.8%
- Percentage of females in arts, design, entertainment, sports, and media occupations:
Here: 3.3% city: 4.0%
- Percentage of females in healthcare practitioners and technical occupations:
Here: 3.4% city: 10.6%
- Percentage of females in service occupations:
Here: 34.8% city: 21.4%
- Percentage of females in sales and office occupations:
Here: 26.3% city: 27.9%
- Percentage of females in production occupations:
Here: 3.6% city: 3.2%
- Percentage of females in transportation occupations:
Here: 1.4% city: 1.9%
Percentage of people 16-64 in Armed Forces:
| Cedar Valley: | 0.1% |
| Lynnwood: | 0.1% |
Education in this neighborhood (subdivision or community):
- Percentage of people 3 years and older in K-12 schools:
Cedar Valley: 20.7% Lynnwood: 13.6%
- Percentage of people 3 years and older in undergraduate colleges:
Cedar Valley: 15.6% Lynnwood: 6.0%
- Percentage of people 3 years and older in grad. or professional schools:
Cedar Valley: 2.4% Lynnwood: 1.1%
- Percentage of students K-12 enrolled in private schools:
Cedar Valley: 9.7% Lynnwood: 12.3%
Percentage of population below poverty level:
| Cedar Valley: | 25.2% |
| Lynnwood: | 14.9% |
Median year owner moved in (as recorded in 2022):
Median year renter moved in (as recorded in 2022):
| Cedar Valley: | 2006 |
| Lynnwood: | 2008 |
Median year renter moved in (as recorded in 2022):
| Cedar Valley: | 2008 |
| Lynnwood: | 2016 |
Percentage of married-couple families with both working:
| Cedar Valley: | 43.6% |
| Lynnwood: | 64.7% |

- 56.6%Electricity
- 34.0%Utility gas
- 2.7%No fuel used
- 2.1%Bottled, tank, or LP gas
- 2.0%Fuel oil, kerosene, etc.
- 1.7%Other fuel
- 0.9%Wood
Limited-access highways (interstate or state) in this neighborhood:
I- 5
Length: 1.51 miles
Directions: E-W, N-S, SW-NE
Directions: E-W, N-S, SW-NE
Highways in this neighborhood:
196th St SW (State Hwy 524)
Length: 1.12 miles
Direction: E-W
Address range: 4400 to 5599
Direction: E-W
Address range: 4400 to 5599
Roads and streets:
200th St SW
Length: 1.13 miles
Direction: E-W
Address range: 4400 to 5599
Direction: E-W
Address range: 4400 to 5599
54th Ave W
Length: 0.69 miles
Directions: N-S, SE-NW
Address range: 20000 to 21199
Directions: N-S, SE-NW
Address range: 20000 to 21199
48th Ave W
Length: 0.65 miles
Directions: E-W, N-S, SE-NW
Address range: 19600 to 20699
Directions: E-W, N-S, SE-NW
Address range: 19600 to 20699
56th Ave W
Length: 0.63 miles
Direction: N-S
Address range: 19800 to 20799
Direction: N-S
Address range: 19800 to 20799
208th St SW
Length: 0.56 miles
Direction: E-W
Address range: 5000 to 5599
Direction: E-W
Address range: 5000 to 5599
204th St SW
Length: 0.56 miles
Direction: E-W
Address range: 5200 to 5599
Direction: E-W
Address range: 5200 to 5599
53rd Ave W
Length: 0.54 miles
Directions: N-S, SW-NE
Address range: 19800 to 20999
Directions: N-S, SW-NE
Address range: 19800 to 20999
44th Ave W
Length: 0.50 miles
Direction: N-S
Address range: 19555 to 20199
Direction: N-S
Address range: 19555 to 20199
52nd Ave W
Length: 0.44 miles
Directions: N-S, SW-NE
Address range: 20200 to 21049
Directions: N-S, SW-NE
Address range: 20200 to 21049
196 St SW (524)
Length: 0.38 miles
Direction: E-W
Direction: E-W
206th St SW
Length: 0.37 miles
Direction: E-W
Address range: 5200 to 5599
Direction: E-W
Address range: 5200 to 5599
Firwood Dr
Length: 0.33 miles
Directions: E-W, N-S, SE-NW, SW-NE
Address range: 5423 to 19999
Directions: E-W, N-S, SE-NW, SW-NE
Address range: 5423 to 19999
50th Ave W
Length: 0.32 miles
Direction: N-S
Address range: 19600 to 20799
Direction: N-S
Address range: 19600 to 20799
Cedar Valley Rd
Length: 0.28 miles
Directions: N-S, SW-NE
Address range: 20000 to 20351
Directions: N-S, SW-NE
Address range: 20000 to 20351
55th Ave W
Length: 0.25 miles
Direction: N-S
Address range: 20400 to 20799
Direction: N-S
Address range: 20400 to 20799
212th St SW
Length: 0.20 miles
Direction: E-W
Address range: 5406 to 5598
Direction: E-W
Address range: 5406 to 5598
201st Pl SW
Length: 0.18 miles
Direction: E-W
Address range: 5200 to 5399
Direction: E-W
Address range: 5200 to 5399
46th Ave W
Length: 0.12 miles
Directions: N-S, SW-NE
Address range: 20100 to 20199
Directions: N-S, SW-NE
Address range: 20100 to 20199
Exit 181
Length: 0.11 miles
Directions: E-W, N-S, SE-NW
Directions: E-W, N-S, SE-NW
198th St SW
Length: 0.10 miles
Direction: E-W
Address range: 5300 to 5398
Direction: E-W
Address range: 5300 to 5398
52nd Pl W
Length: 0.09 miles
Direction: N-S
Address range: 19800 to 19999
Direction: N-S
Address range: 19800 to 19999
202nd Pl SW
Length: 0.07 miles
Direction: E-W
Address range: 5200 to 5399
Direction: E-W
Address range: 5200 to 5399
53rd Pl W
Length: 0.03 miles
Direction: N-S
Address range: 20000 to 20099
Direction: N-S
Address range: 20000 to 20099
Other features:
Scriber Crk
Length: 1.02 miles
Directions: E-W, N-S, SE-NW
Directions: E-W, N-S, SE-NW