Castro neighborhood in San Jose, California (CA), 95008, 95130 detailed profile
Settings
X


Business Search - 14 Million verified businesses
Area: 0.174 square miles
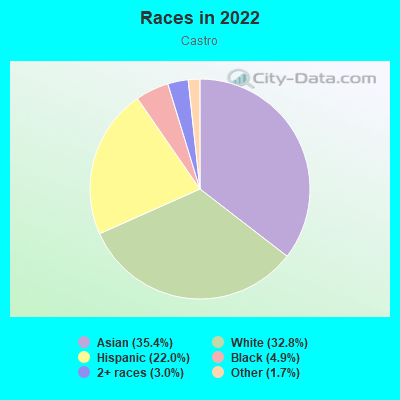
Population: 1,112
Population density:
| Castro: | 6,406 people per square mile |
| San Jose: | 5,554 people per square mile |

- 40935.4%Asian
- 38032.8%White
- 25522.0%Hispanic or Latino
- 574.9%Black
- 353.0%Two or more races
- 201.7%Some other race
- 10.09%American Indian
Median household income in 2022:
| Castro: | $150,918 |
| San Jose: | $133,835 |
Distribution of median household income
![Distribution of median household income]()
- 6Less than $10,000
- 41$10,000 to $19,999
- 52$20,000 to $29,999
- 7$30,000 to $39,999
- 28$40,000 to $49,999
- 12$50,000 to $59,999
- 49$60,000 to $74,999
- 71$75,000 to $99,999
- 29$100,000 to $124,999
- 22$125,000 to $149,999
- 46$150,000 to $199,999
- 151$200,000 or more

Distribution of owner-occupied house/condo value
![Distribution of owner-occupied house/condo value]()
- 7Less than $50,000
- 2$50,000 to $99,999
- 6$200,000 to $249,999
- 7$300,000 to $399,999
- 5$500,000 to $749,999
- 19$750,000 to $999,999
- 177$1,000,000 or more

Distribution of rent paid by renters
![Distribution of rent paid by renters]()
- 26$400 to $499
- 6$500 to $599
- 4$800 to $899
- 44$1,000 to $1,249
- 16$1,250 to $1,499
- 79$1,500 to $1,999
- 134$2,000 or more

Median rent in 2022:
| Castro: | $2,321 |
| San Jose: | $2,001 |
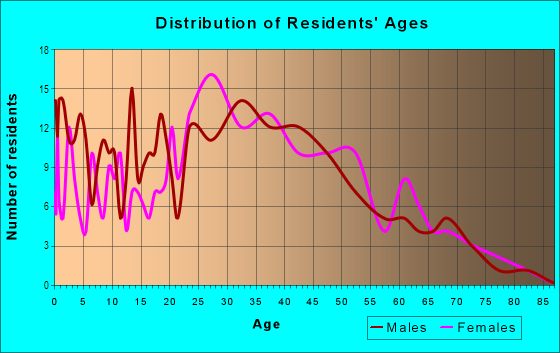
| Males: | 586 |
| Females: | 525 |
Males:
| This neighborhood: | 38.3 years |
| Whole city: | 37.6 years |
| This neighborhood: | 42.2 years |
| Whole city: | 39.1 years |
Average household size:
| Castro: | 2.7 people |
| San Jose: | 2.9 people |
Percentage of family households:
| Castro: | 48.6% |
| San Jose: | 49.9% |
| Here: | 47.3% |
| San Jose: | 53.0% |
Percentage of married-couple families with children (among all households):
| Castro: | 28.6% |
| San Jose: | 25.8% |
Percentage of single-mother households (among all households):
| Castro: | 10.6% |
| San Jose: | 5.2% |
Percentage of never married males 15 years old and over:
Percentage of never married females 15 years old and over:
| Castro: | 19.1% |
| San Jose: | 20.9% |
Percentage of never married females 15 years old and over:
| Castro: | 14.0% |
| city: | 16.7% |
Percentage of people that speak English not well or not at all:
| Castro: | 4.6% |
| San Jose: | 11.4% |
Percentage of people born in this state:
Percentage of people born in another U.S. state:
Percentage of native residents but born outside the U.S.:
Percentage of foreign born residents:
| Here: | 45.8% |
| San Jose: | 46.1% |
Percentage of people born in another U.S. state:
| Castro: | 12.2% |
| San Jose: | 10.4% |
Percentage of native residents but born outside the U.S.:
| Here: | 0.4% |
| city: | 1.7% |
Percentage of foreign born residents:
| Here: | 41.6% |
| San Jose: | 41.8% |
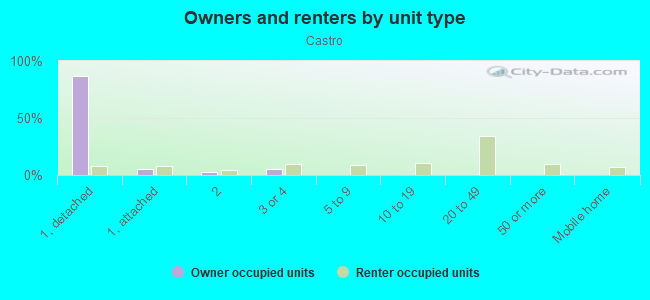
Owner-occupied
Renter-occupied

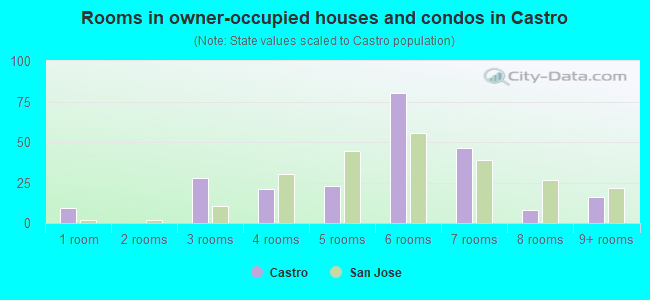
- Rooms in owner-occupied houses and condos in Castro
- 91 room
- 02 rooms
- 283 rooms
- 214 rooms
- 235 rooms
- 806 rooms
- 467 rooms
- 88 rooms
- 169+ rooms

- Rooms in renter-occupied apartments in Castro
- 761 room
- 742 rooms
- 523 rooms
- 784 rooms
- 105 rooms
- 156 rooms
- 117 rooms
- 168 rooms
- 539+ rooms
Owner-occupied
Renter-occupied
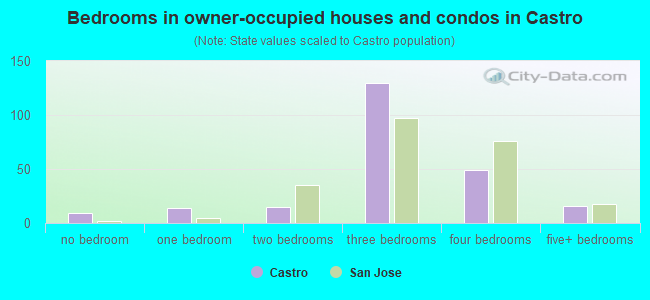
- Bedrooms in owner-occupied houses and condos in Castro
- 9no bedroom
- 141 bedroom
- 152 bedrooms
- 1303 bedrooms
- 494 bedrooms
- 165+ bedrooms
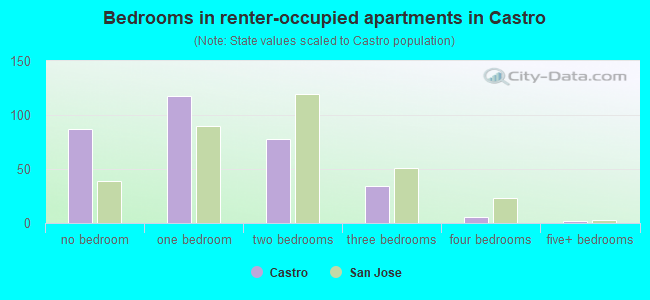
- Bedrooms in renter-occupied apartments in Castro
- 87no bedroom
- 1181 bedroom
- 782 bedrooms
- 343 bedrooms
- 64 bedrooms
- 25+ bedrooms
Average number of cars or other vehicles available in houses/condos:
Average number of cars or other vehicles available in apartments:
| This neighborhood: | 2.2 |
| San Jose: | 2.3 |
Average number of cars or other vehicles available in apartments:
| Here: | 1.7 |
| city: | 1.6 |
Percentage of units with a mortgage:
| Castro: | 59.0% |
| San Jose: | 66.9% |
Average estimated value of detached houses in 2022 (49.8% of all units):
| Castro: | $1,732,587 |
| San Jose: | $1,532,815 |
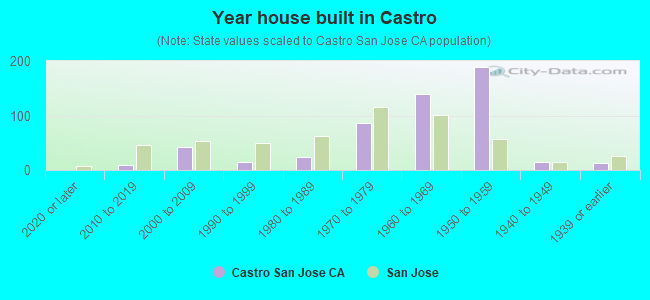
- Year house built in Castro
- 02020 or later
- 92010 to 2019
- 432000 to 2009
- 141990 to 1999
- 241980 to 1989
- 861970 to 1979
- 1391960 to 1969
- 1891950 to 1959
- 141940 to 1949
- 121939 or earlier
City-data.com crime index for city in 2020 (higher means more crime):
| City: | 268.4 |
| U.S. average: | 219.5 |
Travel time to work (commute)
![Travel time to work (commute)]()
- 14Less than 5 minutes
- 265 to 9 minutes
- 9010 to 14 minutes
- 10315 to 19 minutes
- 9620 to 24 minutes
- 1325 to 29 minutes
- 8030 to 34 minutes
- 1535 to 39 minutes
- 540 to 44 minutes
- 5045 to 59 minutes
- 1260 to 89 minutes
- 490 or more minutes

Means of transportation to work
![Means of transportation to work]()
- 71.5%444Drove a car alone
- 6.6%41Carpooled
- 1.4%9Bus
- 1.8%11Long-distance train or commuter rail
- 0.8%5Taxi
- 0.8%5Motorcycle
- 0.5%3Bicycle
- 3.2%20Walked
- 0.6%4Other means
- 15.5%96Worked at home

Time leaving home to go to work
![Time leaving home to go to work]()
- 2112:00 a.m. to 4:59 a.m.
- 105:00 a.m. to 5:29 a.m.
- 125:30 a.m. to 5:59 a.m.
- 126:00 a.m. to 6:29 a.m.
- 506:30 a.m. to 6:59 a.m.
- 477:00 a.m. to 7:29 a.m.
- 527:30 a.m. to 7:59 a.m.
- 938:00 a.m. to 8:29 a.m.
- 408:30 a.m. to 8:59 a.m.
- 969:00 a.m. to 9:59 a.m.
- 3710:00 a.m. to 10:59 a.m.
- 411:00 a.m. to 11:59 a.m.
- 2512:00 p.m. to 3:59 p.m.
- 54:00 p.m. to 11:59 p.m.

Occupations of males:
- Percentage of males in management occupations (except farmers):
Here: 13.4% city: 13.0%
- Percentage of males in business and financial operations occupations:
Here: 5.2% city: 4.6%
- Percentage of males in computer and mathematical occupations:
Here: 12.4% city: 13.6%
- Percentage of males in architecture and engineering occupations:
Here: 9.5% city: 10.2%
- Percentage of males in education, training, and library occupations:
Here: 3.9% city: 2.8%
- Percentage of males in arts, design, entertainment, sports, and media occupations:
Here: 1.9% city: 1.8%
- Percentage of males in healthcare practitioners and technical occupations:
Here: 2.5% city: 2.0%
- Percentage of males in service occupations:
Here: 9.4% city: 12.7%
- Percentage of males in sales and office occupations:
Here: 15.7% city: 12.8%
- Percentage of males in construction, extraction, and maintenance occupations:
Here: 8.4% city: 7.8%
- Percentage of males in production occupations:
Here: 7.6% city: 5.5%
- Percentage of males in transportation occupations:
Here: 3.1% city: 3.6%
- Percentage of males in material moving occupations:
Here: 1.7% city: 3.1%
Occupations of females:
- Percentage of females in management occupations (except farmers):
Here: 13.8% city: 11.0%
- Percentage of females in business and financial operations occupations:
Here: 9.8% city: 8.6%
- Percentage of females in computer and mathematical occupations:
Here: 8.3% city: 5.4%
- Percentage of females in architecture and engineering occupations:
Here: 4.6% city: 2.8%
- Percentage of females in community and social services occupations:
Here: 2.4% city: 1.8%
- Percentage of females in education, training, and library occupations:
Here: 8.7% city: 8.1%
- Percentage of females in arts, design, entertainment, sports, and media occupations:
Here: 2.5% city: 2.0%
- Percentage of females in healthcare practitioners and technical occupations:
Here: 1.9% city: 6.8%
- Percentage of females in service occupations:
Here: 17.3% city: 21.7%
- Percentage of females in sales and office occupations:
Here: 22.4% city: 22.0%
- Percentage of females in production occupations:
Here: 3.7% city: 4.0%
- Percentage of females in material moving occupations:
Here: 3.7% city: 1.5%
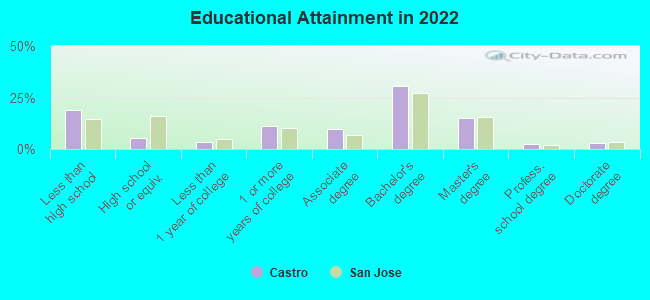
Education in this neighborhood (subdivision or community):
- Percentage of people 3 years and older in K-12 schools:
Castro: 17.3% San Jose: 16.1%
- Percentage of people 3 years and older in undergraduate colleges:
Castro: 5.3% San Jose: 6.5%
- Percentage of people 3 years and older in grad. or professional schools:
Castro: 2.5% San Jose: 2.0%
- Percentage of students K-12 enrolled in private schools:
Castro: 57.5% San Jose: 14.9%
Percentage of population below poverty level:
| Castro: | 3.1% |
| San Jose: | 9.0% |
Median year owner moved in (as recorded in 2022):
Median year renter moved in (as recorded in 2022):
| Castro: | 2005 |
| San Jose: | 2008 |
Median year renter moved in (as recorded in 2022):
| Castro: | 2018 |
| San Jose: | 2020 |
Percentage of married-couple families with both working:
| Castro: | 64.3% |
| San Jose: | 72.5% |
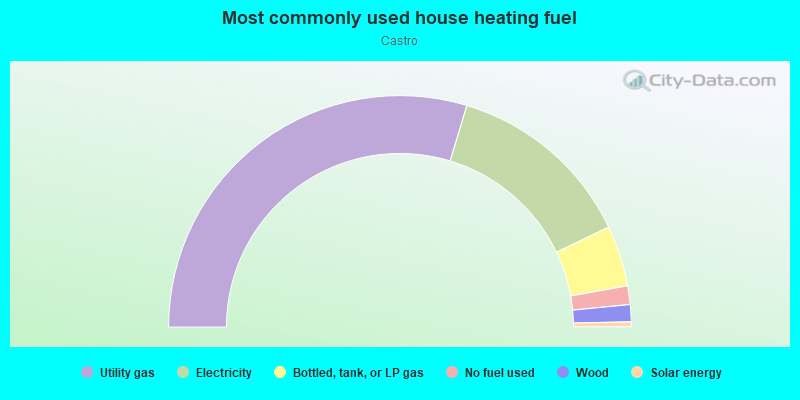
- 59.4%Utility gas
- 26.5%Electricity
- 8.5%Bottled, tank, or LP gas
- 2.6%No fuel used
- 2.4%Wood
- 0.7%Solar energy
Roads and streets:
Fallbrook Ave
Length: 0.54 miles
Directions: E-W, SW-NE
Address range: 1600 to 1899
Directions: E-W, SW-NE
Address range: 1600 to 1899
Duvall Dr
Length: 0.49 miles
Directions: E-W, SW-NE
Address range: 1500 to 1749
Directions: E-W, SW-NE
Address range: 1500 to 1749
Castro Dr
Length: 0.32 miles
Direction: SW-NE
Address range: 1700 to 1949
Direction: SW-NE
Address range: 1700 to 1949
Latimer Ave
Length: 0.26 miles
Directions: E-W, N-S, SE-NW
Address range: 4200 to 4338
Directions: E-W, N-S, SE-NW
Address range: 4200 to 4338
Mossbrook Cir
Length: 0.25 miles
Directions: E-W, N-S, SE-NW, SW-NE
Address range: 4500 to 4699
Directions: E-W, N-S, SE-NW, SW-NE
Address range: 4500 to 4699
Student Ln
Length: 0.20 miles
Direction: SE-NW
Address range: 4500 to 4699
Direction: SE-NW
Address range: 4500 to 4699
Mossbrook Ave
Length: 0.15 miles
Direction: SW-NE
Address range: 1600 to 1799
Direction: SW-NE
Address range: 1600 to 1799
Parkwest Dr
Length: 0.12 miles
Directions: E-W, N-S, SE-NW, SW-NE
Address range: 4500 to 4619
Directions: E-W, N-S, SE-NW, SW-NE
Address range: 4500 to 4619
W Campbell Ave
Length: 0.12 miles
Direction: SE-NW
Address range: 4800 to 4981
Direction: SE-NW
Address range: 4800 to 4981
Sagemont Ave
Length: 0.06 miles
Direction: SE-NW
Direction: SE-NW
Calado Ave
Length: 0.04 miles
Directions: N-S, SE-NW, SW-NE
Address range: 491 to 1613
Directions: N-S, SE-NW, SW-NE
Address range: 491 to 1613
Rio Serena Ave
Length: 0.03 miles
Directions: E-W, SE-NW
Address range: 250 to 299
Directions: E-W, SE-NW
Address range: 250 to 299