Butler Street neighborhood in Atlanta, Georgia (GA), 30312 detailed profile
Settings
X


Business Search - 14 Million verified businesses
Area: 0.146 square miles
Population: 676
Population density:
| Butler Street: | 4,628 people per square mile |
| Atlanta: | 3,788 people per square mile |

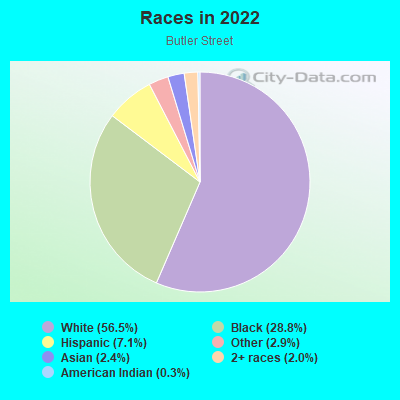
- 39256.5%White
- 20028.8%Black
- 497.1%Hispanic or Latino
- 202.9%Some other race
- 172.4%Asian
- 142.0%Two or more races
- 20.3%American Indian
Median household income in 2022:
| Butler Street: | $86,081 |
| Atlanta: | $83,251 |
Distribution of median household income
![Distribution of median household income]()
- 23Less than $10,000
- 28$10,000 to $19,999
- 12$20,000 to $29,999
- 10$30,000 to $39,999
- 27$40,000 to $49,999
- 13$50,000 to $59,999
- 58$60,000 to $74,999
- 32$75,000 to $99,999
- 61$100,000 to $124,999
- 5$125,000 to $149,999
- 35$150,000 to $199,999
- 58$200,000 or more

Distribution of owner-occupied house/condo value
![Distribution of owner-occupied house/condo value]()
- 48$250,000 to $299,999
- 48$300,000 to $399,999
- 19$400,000 to $499,999
- 55$500,000 to $749,999
- 12$750,000 to $999,999
- 8$1,000,000 or more

Distribution of rent paid by renters
![Distribution of rent paid by renters]()
- 5$400 to $499
- 8$600 to $699
- 3$700 to $799
- 17$800 to $899
- 22$1,000 to $1,249
- 15$1,250 to $1,499
- 65$1,500 to $1,999
- 51$2,000 or more

Median rent in 2022:
| Butler Street: | $1,713 |
| Atlanta: | $1,477 |
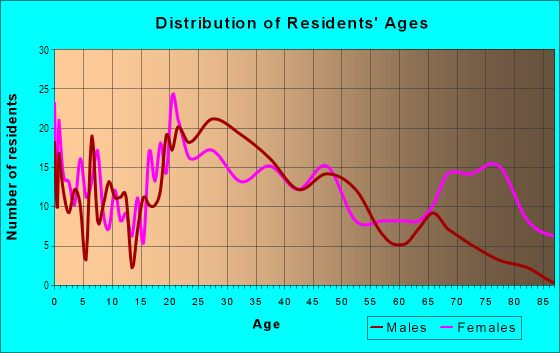
| Males: | 320 |
| Females: | 356 |
Males:
| This neighborhood: | 40.0 years |
| Whole city: | 33.7 years |
| This neighborhood: | 41.1 years |
| Whole city: | 34.3 years |
Average household size:
| Butler Street: | 1.7 people |
| Atlanta: | 2.0 people |
Percentage of family households:
| Butler Street: | 26.0% |
| Atlanta: | 31.6% |
| Here: | 25.7% |
| Atlanta: | 24.9% |
Percentage of married-couple families with children (among all households):
| Butler Street: | 51.2% |
| Atlanta: | 23.2% |
Percentage of single-mother households (among all households):
| Butler Street: | 16.6% |
| Atlanta: | 22.0% |
Percentage of never married males 15 years old and over:
Percentage of never married females 15 years old and over:
| Butler Street: | 22.5% |
| Atlanta: | 28.0% |
Percentage of never married females 15 years old and over:
| Butler Street: | 28.3% |
| city: | 26.3% |
Percentage of people that speak English not well or not at all:
| Butler Street: | 0.0% |
| Atlanta: | 1.0% |
Percentage of people born in this state:
Percentage of people born in another U.S. state:
Percentage of native residents but born outside the U.S.:
Percentage of foreign born residents:
| Here: | 35.6% |
| Atlanta: | 46.3% |
Percentage of people born in another U.S. state:
| Butler Street: | 56.6% |
| Atlanta: | 43.2% |
Percentage of native residents but born outside the U.S.:
| Here: | 0.8% |
| city: | 2.0% |
Percentage of foreign born residents:
| Here: | 7.0% |
| Atlanta: | 8.5% |
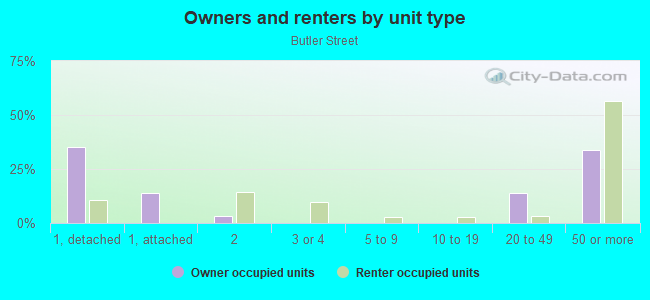
Owner-occupied
Renter-occupied

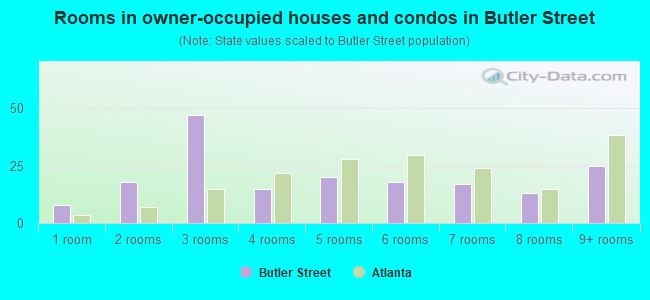
- Rooms in owner-occupied houses and condos in Butler Street
- 81 room
- 182 rooms
- 473 rooms
- 154 rooms
- 205 rooms
- 186 rooms
- 177 rooms
- 138 rooms
- 259+ rooms
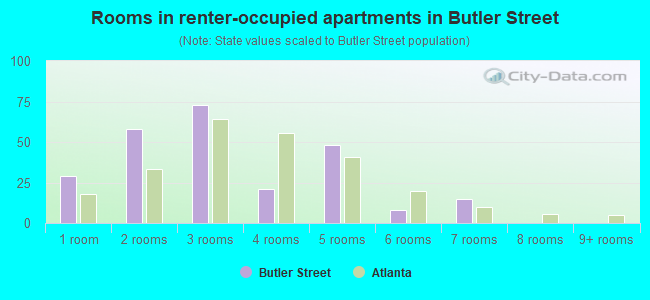
- Rooms in renter-occupied apartments in Butler Street
- 291 room
- 582 rooms
- 733 rooms
- 214 rooms
- 485 rooms
- 86 rooms
- 157 rooms
- 08 rooms
- 09+ rooms
Owner-occupied
Renter-occupied
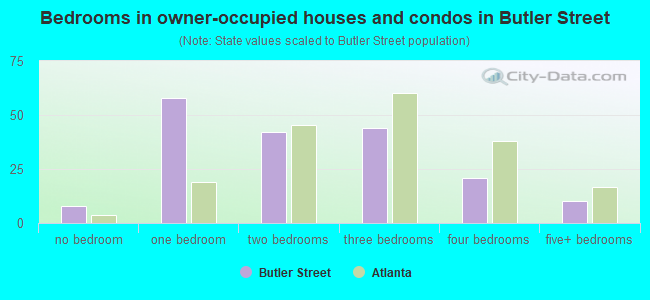
- Bedrooms in owner-occupied houses and condos in Butler Street
- 8no bedroom
- 581 bedroom
- 422 bedrooms
- 443 bedrooms
- 214 bedrooms
- 105+ bedrooms
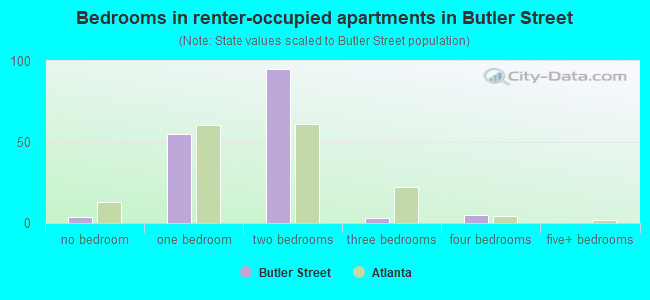
- Bedrooms in renter-occupied apartments in Butler Street
- 4no bedroom
- 551 bedroom
- 952 bedrooms
- 33 bedrooms
- 54 bedrooms
- 05+ bedrooms
Average number of cars or other vehicles available in houses/condos:
Average number of cars or other vehicles available in apartments:
| This neighborhood: | 1.3 |
| Atlanta: | 1.6 |
Average number of cars or other vehicles available in apartments:
| Here: | 1.2 |
| city: | 1.0 |
Percentage of units with a mortgage:
| Butler Street: | 83.6% |
| Atlanta: | 72.0% |
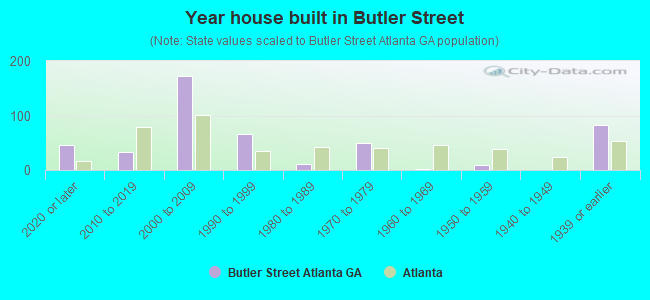
- Year house built in Butler Street
- 462020 or later
- 332010 to 2019
- 1732000 to 2009
- 661990 to 1999
- 111980 to 1989
- 491970 to 1979
- 21960 to 1969
- 101950 to 1959
- 01940 to 1949
- 831939 or earlier
City-data.com crime index for city in 2020 (higher means more crime):
| City: | 140.2 |
| U.S. average: | 219.5 |
Travel time to work (commute)
![Travel time to work (commute)]()
- 11Less than 5 minutes
- 1305 to 9 minutes
- 12810 to 14 minutes
- 18315 to 19 minutes
- 11820 to 24 minutes
- 4625 to 29 minutes
- 10630 to 34 minutes
- 8035 to 39 minutes
- 4040 to 44 minutes
- 1845 to 59 minutes
- 1960 to 89 minutes
- 490 or more minutes

Means of transportation to work
![Means of transportation to work]()
- 49.6%220Drove a car alone
- 8.3%37Carpooled
- 1.6%7Bus
- 1.1%5Subway or elevated rail
- 0.9%4Taxi
- 3.2%14Bicycle
- 5.9%26Walked
- 0.7%3Other means
- 27.7%123Worked at home

Time leaving home to go to work
![Time leaving home to go to work]()
- 1112:00 a.m. to 4:59 a.m.
- 125:00 a.m. to 5:29 a.m.
- 426:00 a.m. to 6:29 a.m.
- 746:30 a.m. to 6:59 a.m.
- 977:00 a.m. to 7:29 a.m.
- 1337:30 a.m. to 7:59 a.m.
- 2368:00 a.m. to 8:29 a.m.
- 458:30 a.m. to 8:59 a.m.
- 959:00 a.m. to 9:59 a.m.
- 510:00 a.m. to 10:59 a.m.
- 2311:00 a.m. to 11:59 a.m.
- 3712:00 p.m. to 3:59 p.m.
- 864:00 p.m. to 11:59 p.m.

Occupations of males:
- Percentage of males in management occupations (except farmers):
Here: 23.2% city: 16.5%
- Percentage of males in business and financial operations occupations:
Here: 5.3% city: 10.8%
- Percentage of males in computer and mathematical occupations:
Here: 24.2% city: 8.5%
- Percentage of males in architecture and engineering occupations:
Here: 27.1% city: 4.2%
- Percentage of males in life, physical, and social science occupations:
Here: 5.3% city: 1.8%
- Percentage of males in legal occupations:
Here: 3.1% city: 3.3%
- Percentage of males in education, training, and library occupations:
Here: 3.8% city: 5.1%
- Percentage of males in arts, design, entertainment, sports, and media occupations:
Here: 3.1% city: 4.8%
- Percentage of males in healthcare practitioners and technical occupations:
Here: 2.8% city: 3.4%
- Percentage of males in service occupations:
Here: 10.9% city: 11.5%
- Percentage of males in sales and office occupations:
Here: 15.8% city: 15.1%
- Percentage of males in farming, fishing, and forestry occupations:
Here: 2.9% city: 0.2%
- Percentage of males in construction, extraction, and maintenance occupations:
Here: 2.9% city: 2.4%
- Percentage of males in production occupations:
Here: 5.8% city: 1.9%
- Percentage of males in material moving occupations:
Here: 2.5% city: 4.3%
Occupations of females:
- Percentage of females in management occupations (except farmers):
Here: 26.4% city: 14.0%
- Percentage of females in business and financial operations occupations:
Here: 1.5% city: 10.8%
- Percentage of females in computer and mathematical occupations:
Here: 3.6% city: 3.2%
- Percentage of females in architecture and engineering occupations:
Here: 2.2% city: 1.4%
- Percentage of females in life, physical, and social science occupations:
Here: 8.2% city: 1.9%
- Percentage of females in community and social services occupations:
Here: 7.1% city: 2.5%
- Percentage of females in legal occupations:
Here: 6.7% city: 3.1%
- Percentage of females in education, training, and library occupations:
Here: 15.7% city: 8.9%
- Percentage of females in arts, design, entertainment, sports, and media occupations:
Here: 9.5% city: 4.9%
- Percentage of females in healthcare practitioners and technical occupations:
Here: 16.7% city: 7.6%
- Percentage of females in service occupations:
Here: 14.2% city: 13.9%
- Percentage of females in sales and office occupations:
Here: 8.4% city: 21.9%
- Percentage of females in material moving occupations:
Here: 6.9% city: 1.6%
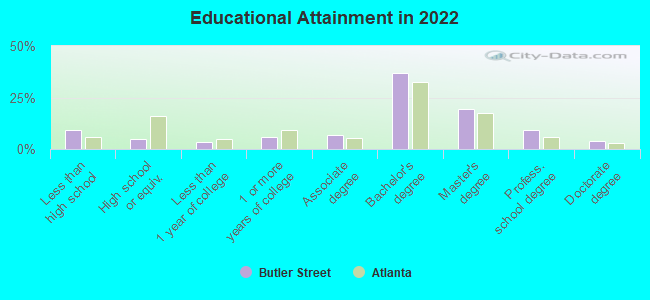
Education in this neighborhood (subdivision or community):
- Percentage of people 3 years and older in K-12 schools:
Butler Street: 3.2% Atlanta: 12.5%
- Percentage of people 3 years and older in undergraduate colleges:
Butler Street: 7.7% Atlanta: 8.9%
- Percentage of people 3 years and older in grad. or professional schools:
Butler Street: 4.6% Atlanta: 3.3%
- Percentage of students K-12 enrolled in private schools:
Butler Street: 19.0% Atlanta: 22.5%
Percentage of population below poverty level:
| Butler Street: | 12.0% |
| Atlanta: | 17.3% |
Median year owner moved in (as recorded in 2022):
Median year renter moved in (as recorded in 2022):
| Butler Street: | 2012 |
| Atlanta: | 2015 |
Median year renter moved in (as recorded in 2022):
| Butler Street: | 2018 |
| Atlanta: | 2020 |
Percentage of married-couple families with both working:
| Butler Street: | 59.7% |
| Atlanta: | 79.0% |
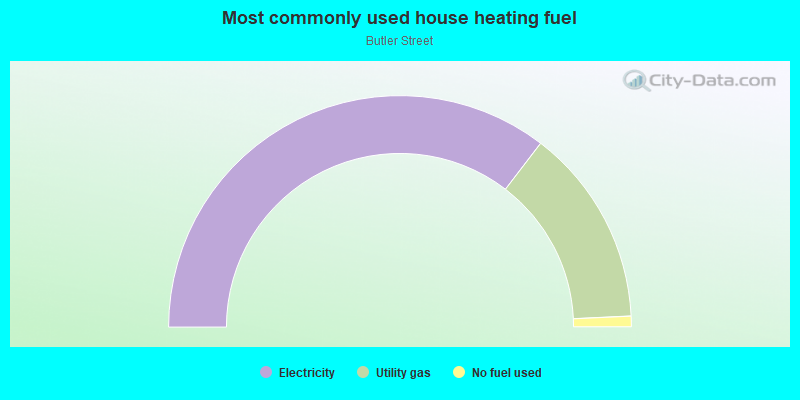
- 70.8%Electricity
- 27.7%Utility gas
- 1.5%No fuel used
Roads and streets:
Edgewood Ave SE (Edgewood Ave NE)
Length: 0.41 miles
Direction: E-W
Address range: 300 to 477
Direction: E-W
Address range: 300 to 477
Auburn Ave NE
Length: 0.40 miles
Direction: E-W
Address range: 300 to 470
Direction: E-W
Address range: 300 to 470
Irwin St NE
Length: 0.40 miles
Direction: E-W
Address range: 301 to 461
Direction: E-W
Address range: 301 to 461
Boulevard Dr NE
Length: 0.36 miles
Direction: N-S
Direction: N-S
Jackson St NE
Length: 0.36 miles
Direction: N-S
Address range: 1 to 195
Direction: N-S
Address range: 1 to 195
Hilliard St NE
Length: 0.33 miles
Direction: N-S
Address range: 1 to 203
Direction: N-S
Address range: 1 to 203
Old Wheat St NE
Length: 0.25 miles
Direction: E-W
Address range: 296 to 403
Direction: E-W
Address range: 296 to 403
John Wesley Dobbs Ave NE
Length: 0.21 miles
Direction: E-W
Address range: 258 to 469
Direction: E-W
Address range: 258 to 469
Cain St NE
Length: 0.15 miles
Direction: E-W
Address range: 300 to 499
Direction: E-W
Address range: 300 to 499
Fort St NE
Length: 0.15 miles
Direction: N-S
Address range: 1 to 115
Direction: N-S
Address range: 1 to 115
Jackson Pl NE
Length: 0.14 miles
Direction: E-W
Address range: 308 to 359
Direction: E-W
Address range: 308 to 359
Wm Holmes Borders Sr Dr NE
Length: 0.08 miles
Direction: N-S
Address range: 1 to 99
Direction: N-S
Address range: 1 to 99
Hilliard St SE
Length: 0.02 miles
Direction: N-S
Address range: 1 to 14
Direction: N-S
Address range: 1 to 14