Brighton Terrace neighborhood in Brighton, Colorado (CO), 80601 detailed profile
Settings
X

Business Search - 14 Million verified businesses
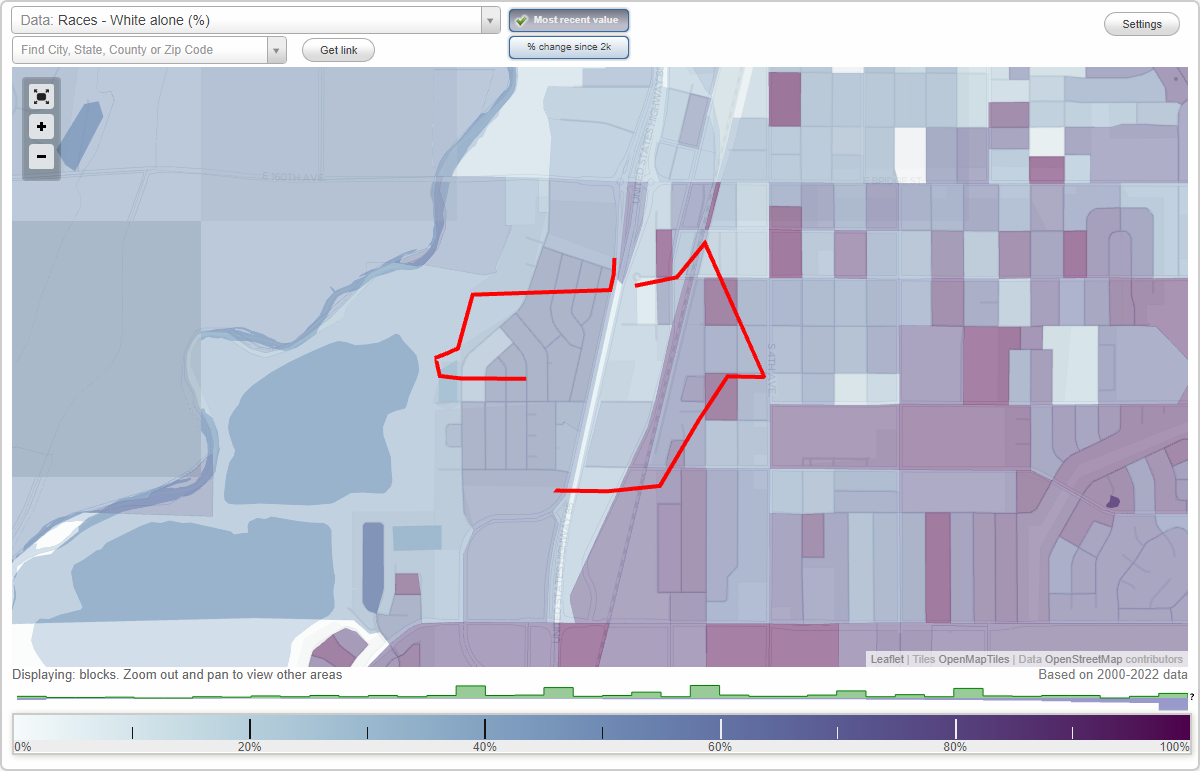
Area: 0.196 square miles
Population: 236
Population density:
| Brighton Terrace: | 1,203 people per square mile |
| Brighton: | 2,376 people per square mile |

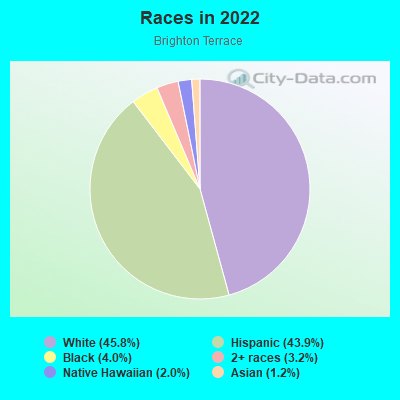
- 11645.8%White
- 11143.9%Hispanic or Latino
- 104.0%Black
- 83.2%Two or more races
- 52.0%Native Hawaiian and Other
Pacific Islander - 31.2%Asian
Median household income in 2022:
| Brighton Terrace: | $50,659 |
| Brighton: | $86,975 |
Distribution of median household income
![Distribution of median household income]()
- 13Less than $10,000
- 10$10,000 to $19,999
- 16$20,000 to $29,999
- 14$30,000 to $39,999
- 13$40,000 to $49,999
- 20$50,000 to $59,999
- 5$60,000 to $74,999
- 7$75,000 to $99,999
- 6$100,000 to $124,999
- 6$125,000 to $149,999
- 4$150,000 to $199,999
- 3$200,000 or more

Distribution of owner-occupied house/condo value
![Distribution of owner-occupied house/condo value]()
- 11Less than $50,000
- 4$50,000 to $99,999
- 3$100,000 to $149,999
- 5$150,000 to $199,999
- 6$200,000 to $249,999
- 5$250,000 to $299,999
- 11$300,000 to $399,999
- 8$400,000 to $499,999
- 3$500,000 to $749,999
- 8$750,000 to $999,999
- 2$1,000,000 or more

Distribution of rent paid by renters
![Distribution of rent paid by renters]()
- 4$100 to $199
- 2$200 to $299
- 10$300 to $399
- 4$500 to $599
- 23$600 to $699
- 8$700 to $799
- 4$800 to $899
- 3$900 to $999
- 37$1,000 to $1,249
- 26$1,250 to $1,499
- 6$1,500 to $1,999
- 10$2,000 or more

Median rent in 2022:
| Brighton Terrace: | $1,315 |
| Brighton: | $1,426 |
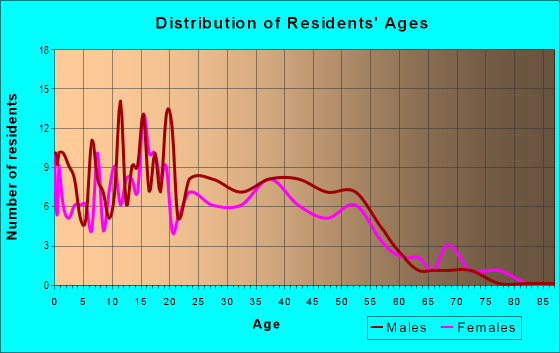
| Males: | 108 |
| Females: | 128 |
Males:
| This neighborhood: | 27.2 years |
| Whole city: | 32.7 years |
| This neighborhood: | 26.4 years |
| Whole city: | 36.0 years |
Average household size:
| Brighton Terrace: | 2.9 people |
| Brighton: | 3.0 people |
Percentage of family households:
| Brighton Terrace: | 55.1% |
| Brighton: | 60.3% |
| Here: | 41.2% |
| Brighton: | 56.9% |
Percentage of married-couple families with children (among all households):
| Brighton Terrace: | 23.0% |
| Brighton: | 24.2% |
Percentage of single-mother households (among all households):
| Brighton Terrace: | 35.8% |
| Brighton: | 7.3% |
Percentage of never married males 15 years old and over:
Percentage of never married females 15 years old and over:
| Brighton Terrace: | 22.9% |
| Brighton: | 17.0% |
Percentage of never married females 15 years old and over:
| Brighton Terrace: | 8.6% |
| city: | 11.6% |
Percentage of people that speak English not well or not at all:
| Brighton Terrace: | 3.9% |
| Brighton: | 2.7% |
Percentage of people born in this state:
Percentage of people born in another U.S. state:
Percentage of native residents but born outside the U.S.:
Percentage of foreign born residents:
| Here: | 59.5% |
| Brighton: | 56.5% |
Percentage of people born in another U.S. state:
| Brighton Terrace: | 31.5% |
| Brighton: | 33.5% |
Percentage of native residents but born outside the U.S.:
| Here: | 0.8% |
| city: | 1.8% |
Percentage of foreign born residents:
| Here: | 8.3% |
| Brighton: | 8.3% |
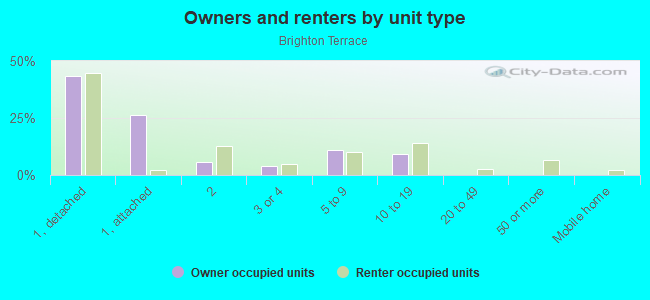
Owner-occupied
Renter-occupied

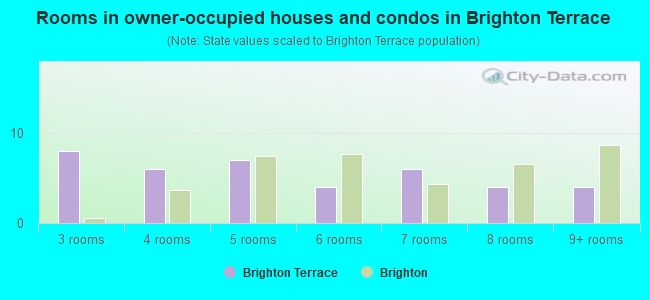
- Rooms in owner-occupied houses and condos in Brighton Terrace
- 01 room
- 02 rooms
- 83 rooms
- 64 rooms
- 75 rooms
- 46 rooms
- 67 rooms
- 48 rooms
- 49+ rooms
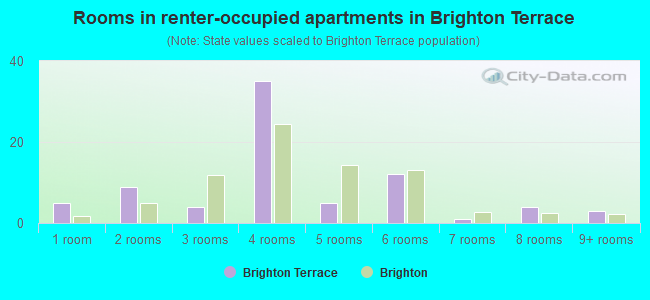
- Rooms in renter-occupied apartments in Brighton Terrace
- 51 room
- 92 rooms
- 43 rooms
- 354 rooms
- 55 rooms
- 126 rooms
- 17 rooms
- 48 rooms
- 39+ rooms
Owner-occupied
Renter-occupied
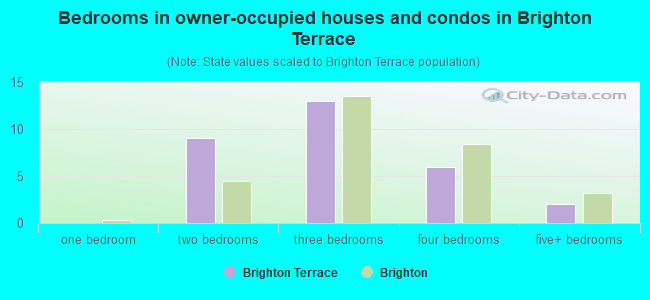
- Bedrooms in owner-occupied houses and condos in Brighton Terrace
- 0no bedroom
- 01 bedroom
- 92 bedrooms
- 133 bedrooms
- 64 bedrooms
- 25+ bedrooms
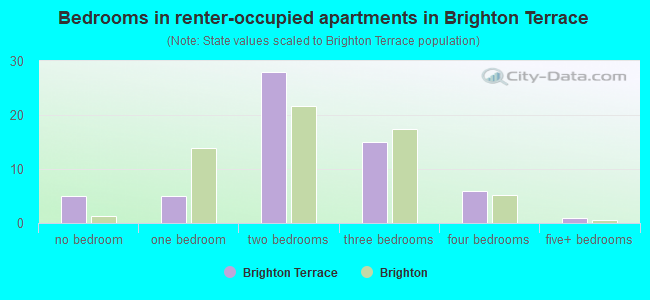
- Bedrooms in renter-occupied apartments in Brighton Terrace
- 5no bedroom
- 51 bedroom
- 282 bedrooms
- 153 bedrooms
- 64 bedrooms
- 15+ bedrooms
Average number of cars or other vehicles available in houses/condos:
Average number of cars or other vehicles available in apartments:
| This neighborhood: | 2.3 |
| Brighton: | 2.5 |
Average number of cars or other vehicles available in apartments:
| Here: | 1.6 |
| city: | 1.7 |
Percentage of units with a mortgage:
| Brighton Terrace: | 69.0% |
| Brighton: | 77.9% |
Housing prices:
- Average estimated value of detached houses in 2022 (33.3% of all units):
Brighton Terrace: $395,416 Colorado: $676,667
- Average estimated value of townhouses or other attached units in 2022 (15.5% of all units):
This neighborhood: $283,456 Colorado: $526,340
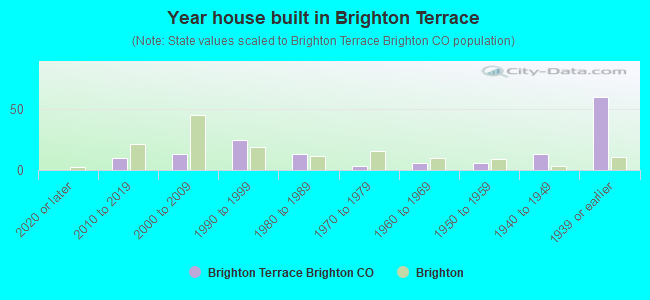
- Year house built in Brighton Terrace
- 02020 or later
- 102010 to 2019
- 132000 to 2009
- 251990 to 1999
- 131980 to 1989
- 31970 to 1979
- 61960 to 1969
- 61950 to 1959
- 131940 to 1949
- 601939 or earlier
City-data.com crime index for city in 2020 (higher means more crime):
| City: | 304.4 |
| U.S. average: | 219.5 |
Travel time to work (commute)
![Travel time to work (commute)]()
- 2Less than 5 minutes
- 445 to 9 minutes
- 5010 to 14 minutes
- 2915 to 19 minutes
- 2620 to 24 minutes
- 725 to 29 minutes
- 5430 to 34 minutes
- 335 to 39 minutes
- 2040 to 44 minutes
- 1445 to 59 minutes
- 1760 to 89 minutes
- 590 or more minutes

Means of transportation to work
![Means of transportation to work]()
- 69.7%77Drove a car alone
- 13.6%15Carpooled
- 6.3%7Bus
- 0.9%1Walked
- 1.8%2Other means
- 13.6%15Worked at home

Time leaving home to go to work
![Time leaving home to go to work]()
- 2712:00 a.m. to 4:59 a.m.
- 185:00 a.m. to 5:29 a.m.
- 625:30 a.m. to 5:59 a.m.
- 126:00 a.m. to 6:29 a.m.
- 436:30 a.m. to 6:59 a.m.
- 237:00 a.m. to 7:29 a.m.
- 277:30 a.m. to 7:59 a.m.
- 108:00 a.m. to 8:29 a.m.
- 78:30 a.m. to 8:59 a.m.
- 139:00 a.m. to 9:59 a.m.
- 510:00 a.m. to 10:59 a.m.
- 211:00 a.m. to 11:59 a.m.
- 1612:00 p.m. to 3:59 p.m.
- 194:00 p.m. to 11:59 p.m.

Occupations of males:
- Percentage of males in management occupations (except farmers):
Here: 10.9% city: 10.5%
- Percentage of males in business and financial operations occupations:
Here: 4.1% city: 3.2%
- Percentage of males in computer and mathematical occupations:
Here: 1.4% city: 3.0%
- Percentage of males in community and social services occupations:
Here: 11.8% city: 1.2%
- Percentage of males in service occupations:
Here: 3.0% city: 9.4%
- Percentage of males in sales and office occupations:
Here: 21.8% city: 15.1%
- Percentage of males in construction, extraction, and maintenance occupations:
Here: 15.1% city: 13.9%
- Percentage of males in production occupations:
Here: 4.5% city: 7.3%
- Percentage of males in transportation occupations:
Here: 21.6% city: 9.7%
- Percentage of males in material moving occupations:
Here: 15.6% city: 10.0%
Occupations of females:
- Percentage of females in management occupations (except farmers):
Here: 6.9% city: 9.8%
- Percentage of females in business and financial operations occupations:
Here: 7.9% city: 7.9%
- Percentage of females in community and social services occupations:
Here: 4.4% city: 2.3%
- Percentage of females in legal occupations:
Here: 1.7% city: 0.4%
- Percentage of females in education, training, and library occupations:
Here: 1.5% city: 12.7%
- Percentage of females in arts, design, entertainment, sports, and media occupations:
Here: 3.4% city: 1.7%
- Percentage of females in healthcare practitioners and technical occupations:
Here: 5.8% city: 5.9%
- Percentage of females in service occupations:
Here: 14.4% city: 18.2%
- Percentage of females in sales and office occupations:
Here: 52.8% city: 30.5%
- Percentage of females in construction, extraction, and maintenance occupations:
Here: 8.2% city: 0.7%
- Percentage of females in production occupations:
Here: 1.3% city: 2.7%
- Percentage of females in material moving occupations:
Here: 5.2% city: 2.6%
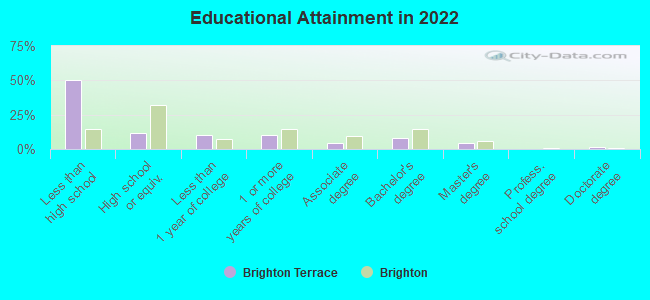
Education in this neighborhood (subdivision or community):
- Percentage of people 3 years and older in K-12 schools:
Brighton Terrace: 24.0% Brighton: 21.7%
- Percentage of people 3 years and older in undergraduate colleges:
Brighton Terrace: 10.1% Brighton: 1.9%
- Percentage of people 3 years and older in grad. or professional schools:
Brighton Terrace: 2.8% Brighton: 0.9%
- Percentage of students K-12 enrolled in private schools:
Brighton Terrace: 7.7% Brighton: 6.3%
Percentage of population below poverty level:
| Brighton Terrace: | 9.0% |
| Brighton: | 9.1% |
Median year owner moved in (as recorded in 2022):
Median year renter moved in (as recorded in 2022):
| Brighton Terrace: | 2013 |
| Brighton: | 2011 |
Median year renter moved in (as recorded in 2022):
| Brighton Terrace: | 2017 |
| Brighton: | 2017 |
Percentage of married-couple families with both working:
| Brighton Terrace: | 83.3% |
| Brighton: | 74.9% |
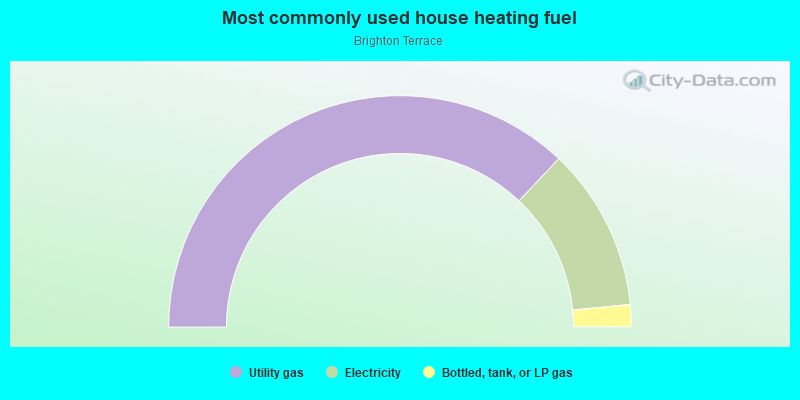
- 74.0%Utility gas
- 22.8%Electricity
- 3.1%Bottled, tank, or LP gas
Highways in this neighborhood:
State Hwy 7 (W Bridge St)
Length: 0.21 miles
Direction: E-W
Direction: E-W
Roads and streets:
Miller Ave
Length: 0.39 miles
Directions: N-S, SW-NE
Address range: 1 to 349
Directions: N-S, SW-NE
Address range: 1 to 349
Aspen Dr
Length: 0.35 miles
Directions: N-S, SE-NW
Address range: 200 to 399
Directions: N-S, SE-NW
Address range: 200 to 399
Birch Ave
Length: 0.27 miles
Directions: N-S, SE-NW
Address range: 200 to 499
Directions: N-S, SE-NW
Address range: 200 to 499
Balsam Ave
Length: 0.27 miles
Directions: E-W, N-S, SE-NW
Address range: 200 to 331
Directions: E-W, N-S, SE-NW
Address range: 200 to 331
W Egbert St
Length: 0.22 miles
Direction: E-W
Address range: 27 to 399
Direction: E-W
Address range: 27 to 399
Ash Ave
Length: 0.21 miles
Directions: N-S, SW-NE
Address range: 200 to 398
Directions: N-S, SW-NE
Address range: 200 to 398
W Southern St
Length: 0.09 miles
Direction: E-W
Address range: 300 to 342
Direction: E-W
Address range: 300 to 342
Egbert Cir
Length: 0.06 miles
Direction: E-W
Address range: 400 to 478
Direction: E-W
Address range: 400 to 478
Elm Ave
Length: 0.06 miles
Direction: SW-NE
Address range: 300 to 323
Direction: SW-NE
Address range: 300 to 323
Cedar Ave
Length: 0.05 miles
Direction: SE-NW
Address range: 300 to 328
Direction: SE-NW
Address range: 300 to 328
Crown Cir
Length: 0.03 miles
Direction: E-W
Address range: 400 to 499
Direction: E-W
Address range: 400 to 499
Birch Cir
Length: 0.03 miles
Directions: E-W, SW-NE
Address range: 300 to 399
Directions: E-W, SW-NE
Address range: 300 to 399
Other features:
3rd Crk
Length: 0.08 miles
Directions: E-W, SW-NE
Directions: E-W, SW-NE