Brentwood neighborhood in Newport News, Virginia (VA), 23601 detailed profile
Settings
X


Business Search - 14 Million verified businesses
Area: 0.169 square miles
Population: 476
Population density:
| Brentwood: | 2,811 people per square mile |
| Newport News: | 2,699 people per square mile |

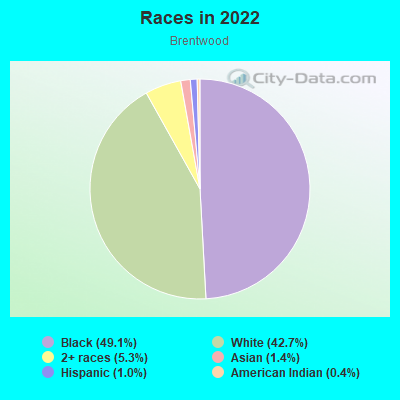
- 24049.1%Black
- 20942.7%White
- 265.3%Two or more races
- 71.4%Asian
- 51.0%Hispanic or Latino
- 20.4%American Indian
Median household income in 2022:
| Brentwood: | $93,334 |
| Newport News: | $64,102 |
Distribution of median household income
![Distribution of median household income]()
- 18Less than $10,000
- 23$10,000 to $19,999
- 13$20,000 to $29,999
- 11$30,000 to $39,999
- 16$40,000 to $49,999
- 9$50,000 to $59,999
- 7$60,000 to $74,999
- 53$75,000 to $99,999
- 31$100,000 to $124,999
- 10$125,000 to $149,999
- 28$150,000 to $199,999
- 30$200,000 or more

Distribution of owner-occupied house/condo value
![Distribution of owner-occupied house/condo value]()
- 4Less than $50,000
- 40$100,000 to $149,999
- 86$150,000 to $199,999
- 59$200,000 to $249,999
- 12$250,000 to $299,999
- 28$300,000 to $399,999
- 5$400,000 to $499,999
- 8$500,000 to $749,999
- 2$750,000 to $999,999

Distribution of rent paid by renters
![Distribution of rent paid by renters]()
- 8Less than $100
- 11$500 to $599
- 5$700 to $799
- 7$800 to $899
- 10$900 to $999
- 9$1,000 to $1,249
- 18$1,250 to $1,499
- 4$1,500 to $1,999
- 1$2,000 or more

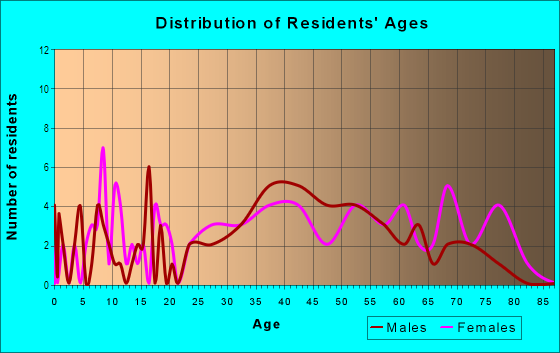
| Males: | 279 |
| Females: | 196 |
Males:
| This neighborhood: | 45.4 years |
| Whole city: | 32.8 years |
| This neighborhood: | 50.9 years |
| Whole city: | 35.9 years |
Average household size:
| Brentwood: | 2.3 people |
| Newport News: | 2.4 people |
Percentage of family households:
| Brentwood: | 40.9% |
| Newport News: | 43.1% |
| Here: | 27.6% |
| Newport News: | 36.0% |
Percentage of married-couple families with children (among all households):
| Brentwood: | 9.2% |
| Newport News: | 23.0% |
Percentage of single-mother households (among all households):
| Brentwood: | 29.5% |
| Newport News: | 14.6% |
Percentage of never married males 15 years old and over:
Percentage of never married females 15 years old and over:
| Brentwood: | 32.3% |
| Newport News: | 21.4% |
Percentage of never married females 15 years old and over:
| Brentwood: | 12.9% |
| city: | 19.2% |
Percentage of people that speak English not well or not at all:
| Brentwood: | 0.6% |
| Newport News: | 1.4% |
Percentage of people born in this state:
Percentage of people born in another U.S. state:
Percentage of native residents but born outside the U.S.:
Percentage of foreign born residents:
| Here: | 61.4% |
| Newport News: | 52.5% |
Percentage of people born in another U.S. state:
| Brentwood: | 30.1% |
| Newport News: | 36.1% |
Percentage of native residents but born outside the U.S.:
| Here: | 2.7% |
| city: | 3.4% |
Percentage of foreign born residents:
| Here: | 5.8% |
| Newport News: | 8.1% |
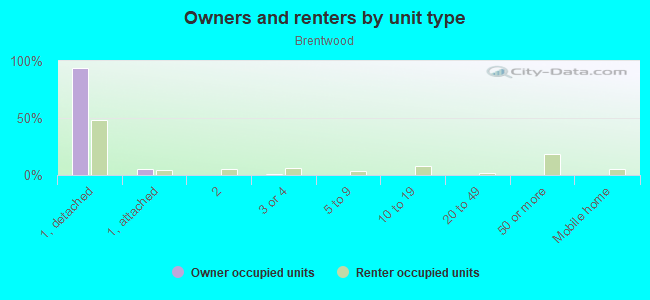
Owner-occupied
Renter-occupied

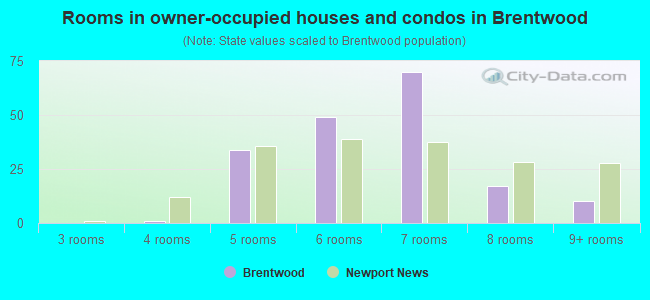
- Rooms in owner-occupied houses and condos in Brentwood
- 01 room
- 02 rooms
- 03 rooms
- 14 rooms
- 345 rooms
- 496 rooms
- 707 rooms
- 178 rooms
- 109+ rooms
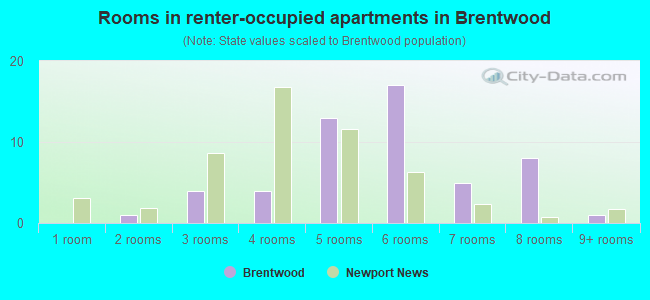
- Rooms in renter-occupied apartments in Brentwood
- 01 room
- 12 rooms
- 43 rooms
- 44 rooms
- 135 rooms
- 176 rooms
- 57 rooms
- 88 rooms
- 19+ rooms
Owner-occupied
Renter-occupied
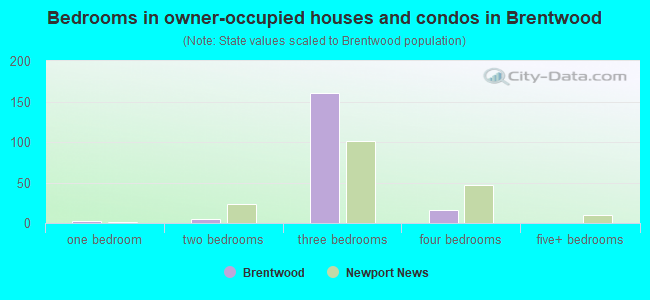
- Bedrooms in owner-occupied houses and condos in Brentwood
- 0no bedroom
- 21 bedroom
- 52 bedrooms
- 1613 bedrooms
- 164 bedrooms
- 05+ bedrooms
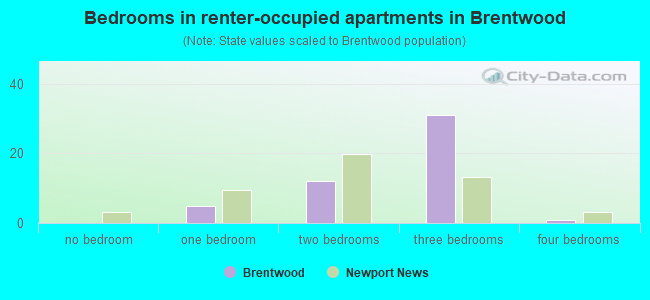
- Bedrooms in renter-occupied apartments in Brentwood
- 0no bedroom
- 51 bedroom
- 122 bedrooms
- 313 bedrooms
- 14 bedrooms
- 05+ bedrooms
Average number of cars or other vehicles available in houses/condos:
Average number of cars or other vehicles available in apartments:
| This neighborhood: | 1.8 |
| Newport News: | 2.1 |
Average number of cars or other vehicles available in apartments:
| Here: | 1.1 |
| city: | 1.3 |
Percentage of units with a mortgage:
| Brentwood: | 59.9% |
| Newport News: | 70.0% |
Average estimated value of detached houses in 2022 (95.4% of all units):
| Brentwood: | $175,583 |
| Newport News: | $282,487 |
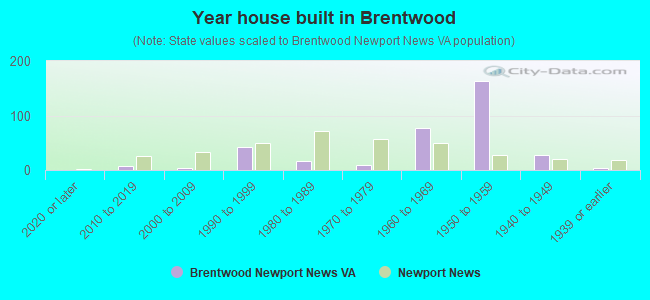
- Year house built in Brentwood
- 02020 or later
- 72010 to 2019
- 42000 to 2009
- 431990 to 1999
- 171980 to 1989
- 101970 to 1979
- 771960 to 1969
- 1631950 to 1959
- 281940 to 1949
- 41939 or earlier
City-data.com crime index for city in 2020 (higher means more crime):
| City: | 274.6 |
| U.S. average: | 219.5 |
Travel time to work (commute)
![Travel time to work (commute)]()
- 4Less than 5 minutes
- 185 to 9 minutes
- 7810 to 14 minutes
- 5015 to 19 minutes
- 2420 to 24 minutes
- 1425 to 29 minutes
- 1530 to 34 minutes
- 235 to 39 minutes
- 1145 to 59 minutes
- 460 to 89 minutes
- 1090 or more minutes

Means of transportation to work
![Means of transportation to work]()
- 71.8%203Drove a car alone
- 9.5%27Carpooled
- 0.4%1Bus
- 3.5%10Bicycle
- 0.7%2Walked
- 10.3%29Other means
- 8.1%23Worked at home

Time leaving home to go to work
![Time leaving home to go to work]()
- 1612:00 a.m. to 4:59 a.m.
- 65:00 a.m. to 5:29 a.m.
- 135:30 a.m. to 5:59 a.m.
- 176:00 a.m. to 6:29 a.m.
- 356:30 a.m. to 6:59 a.m.
- 227:00 a.m. to 7:29 a.m.
- 437:30 a.m. to 7:59 a.m.
- 238:00 a.m. to 8:29 a.m.
- 48:30 a.m. to 8:59 a.m.
- 139:00 a.m. to 9:59 a.m.
- 810:00 a.m. to 10:59 a.m.
- 2012:00 p.m. to 3:59 p.m.
- 84:00 p.m. to 11:59 p.m.

Occupations of males:
- Percentage of males in management occupations (except farmers):
Here: 16.0% city: 8.6%
- Percentage of males in business and financial operations occupations:
Here: 5.4% city: 3.5%
- Percentage of males in life, physical, and social science occupations:
Here: 2.3% city: 1.2%
- Percentage of males in service occupations:
Here: 21.1% city: 15.8%
- Percentage of males in sales and office occupations:
Here: 10.6% city: 13.9%
- Percentage of males in construction, extraction, and maintenance occupations:
Here: 26.2% city: 10.8%
- Percentage of males in production occupations:
Here: 2.7% city: 9.7%
- Percentage of males in transportation occupations:
Here: 8.7% city: 6.0%
- Percentage of males in material moving occupations:
Here: 4.9% city: 7.0%
Occupations of females:
- Percentage of females in life, physical, and social science occupations:
Here: 4.1% city: 0.7%
- Percentage of females in community and social services occupations:
Here: 15.3% city: 3.9%
- Percentage of females in legal occupations:
Here: 10.7% city: 0.8%
- Percentage of females in service occupations:
Here: 27.6% city: 22.8%
- Percentage of females in sales and office occupations:
Here: 46.2% city: 27.1%
- Percentage of females in construction, extraction, and maintenance occupations:
Here: 3.5% city: 1.0%
- Percentage of females in production occupations:
Here: 2.0% city: 4.7%
- Percentage of females in transportation occupations:
Here: 3.4% city: 1.3%
- Percentage of females in material moving occupations:
Here: 4.2% city: 2.5%
Percentage of people 16-64 in Armed Forces:
| Brentwood: | 3.2% |
| Newport News: | 8.2% |
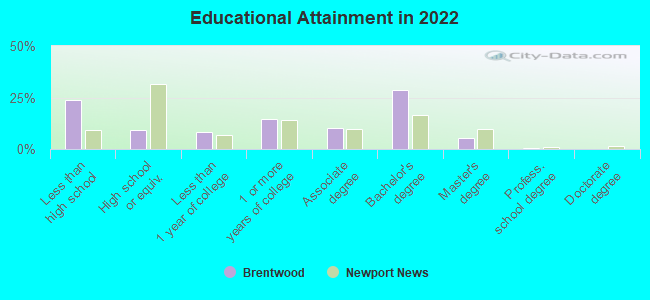
Education in this neighborhood (subdivision or community):
- Percentage of people 3 years and older in K-12 schools:
Brentwood: 24.2% Newport News: 17.3%
- Percentage of people 3 years and older in undergraduate colleges:
Brentwood: 0.6% Newport News: 5.4%
- Percentage of people 3 years and older in grad. or professional schools:
Brentwood: 6.1% Newport News: 1.6%
- Percentage of students K-12 enrolled in private schools:
Brentwood: 13.9% Newport News: 9.9%
Percentage of population below poverty level:
| Brentwood: | 13.9% |
| Newport News: | 16.9% |
Median year owner moved in (as recorded in 2022):
| Brentwood: | 2004 |
| Newport News: | 2009 |
Percentage of married-couple families with both working:
| Brentwood: | 142.1% |
| Newport News: | 67.5% |
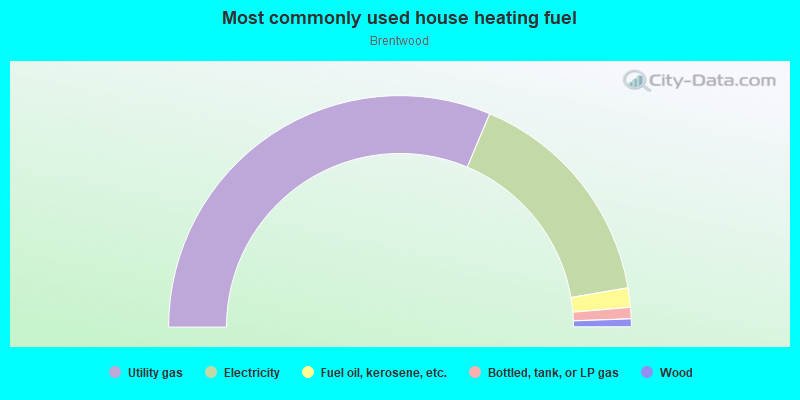
- 62.7%Utility gas
- 31.9%Electricity
- 2.7%Fuel oil, kerosene, etc.
- 1.6%Bottled, tank, or LP gas
- 1.1%Wood
Roads and streets:
Lyliston Ln
Length: 0.59 miles
Direction: E-W
Address range: 9 to 199
Direction: E-W
Address range: 9 to 199
Lilac Ct
Length: 0.07 miles
Direction: N-S
Address range: 1 to 99
Direction: N-S
Address range: 1 to 99
Powellville Ln
Length: 0.03 miles
Direction: N-S
Address range: 500 to 599
Direction: N-S
Address range: 500 to 599