Brady Arts District neighborhood in Tulsa, Oklahoma (OK), 74103, 74120 detailed profile
Settings
X

Business Search - 14 Million verified businesses
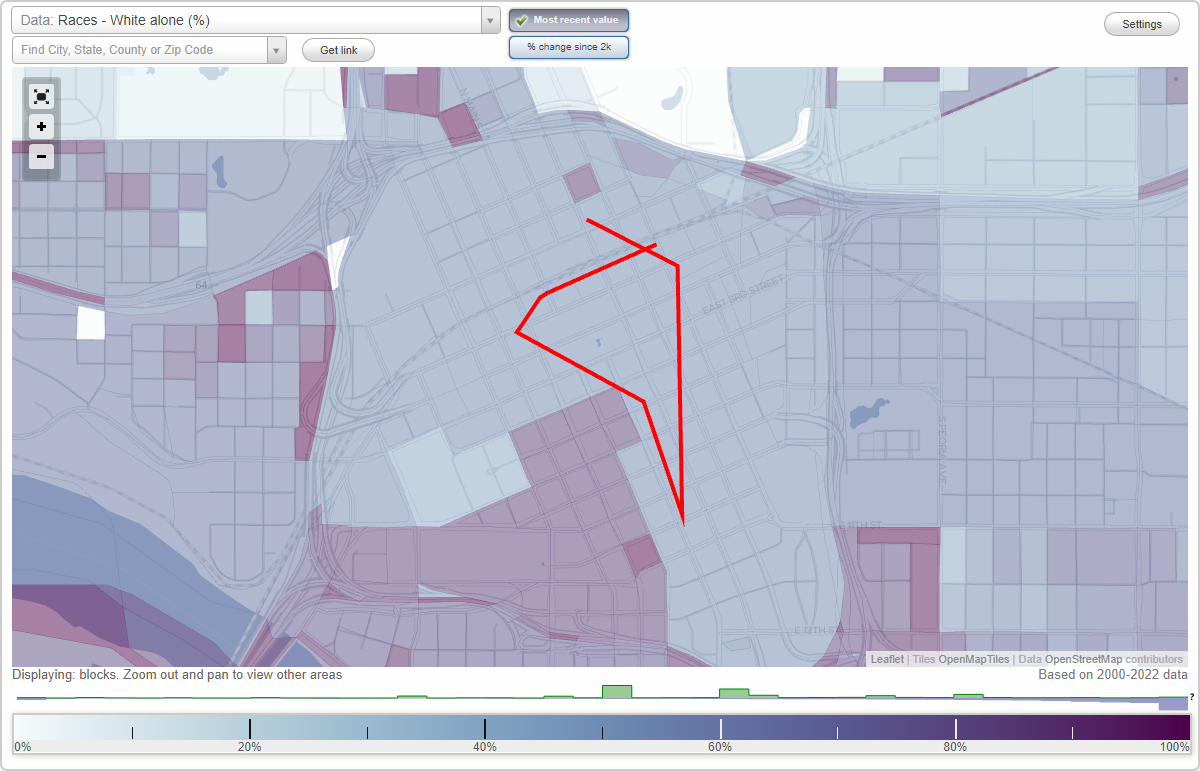
Area: 0.200 square miles
Population: 244
Population density:
| Brady Arts District: | 1,221 people per square mile |
| Tulsa: | 2,262 people per square mile |

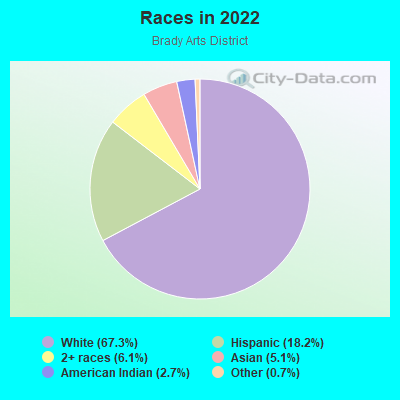
- 20067.3%White
- 5418.2%Hispanic or Latino
- 186.1%Two or more races
- 155.1%Asian
- 82.7%American Indian
- 20.7%Some other race
Median household income in 2022:
| Brady Arts District: | $50,353 |
| Tulsa: | $54,040 |
Distribution of median household income
![Distribution of median household income]()
- 12Less than $10,000
- 10$10,000 to $19,999
- 11$20,000 to $29,999
- 18$30,000 to $39,999
- 20$40,000 to $49,999
- 18$50,000 to $59,999
- 21$60,000 to $74,999
- 26$75,000 to $99,999
- 9$100,000 to $124,999
- 14$125,000 to $149,999
- 2$150,000 to $199,999
- 21$200,000 or more

Distribution of owner-occupied house/condo value
![Distribution of owner-occupied house/condo value]()
- 12Less than $50,000
- 32$50,000 to $99,999
- 25$100,000 to $149,999
- 13$150,000 to $199,999
- 7$200,000 to $249,999
- 4$250,000 to $299,999
- 6$300,000 to $399,999

Distribution of rent paid by renters
![Distribution of rent paid by renters]()
- 1Less than $100
- 5$100 to $199
- 8$200 to $299
- 2$300 to $399
- 8$400 to $499
- 16$500 to $599
- 12$600 to $699
- 5$700 to $799
- 26$800 to $899
- 11$900 to $999
- 44$1,000 to $1,249
- 36$1,250 to $1,499
- 16$1,500 to $1,999
- 23$2,000 or more

Median rent in 2022:
| Brady Arts District: | $1,177 |
| Tulsa: | $802 |
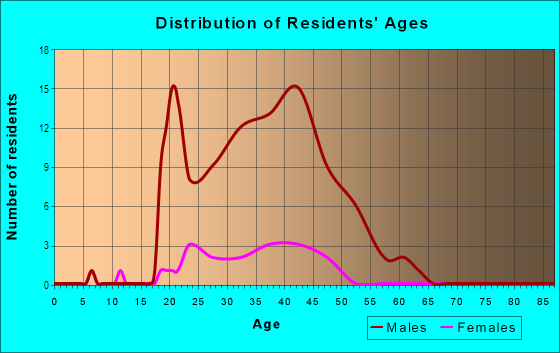
| Males: | 153 |
| Females: | 90 |
Males:
| This neighborhood: | 31.1 years |
| Whole city: | 34.8 years |
| This neighborhood: | 36.7 years |
| Whole city: | 36.7 years |
Average household size:
| Brady Arts District: | 1.8 people |
| Tulsa: | 2.3 people |
Percentage of family households:
| Brady Arts District: | 14.7% |
| Tulsa: | 40.9% |
| Here: | 11.5% |
| Tulsa: | 36.4% |
Percentage of married-couple families with children (among all households):
| Brady Arts District: | 69.9% |
| Tulsa: | 26.0% |
Percentage of single-mother households (among all households):
| Brady Arts District: | 116.4% |
| Tulsa: | 13.4% |
Percentage of never married males 15 years old and over:
Percentage of never married females 15 years old and over:
| Brady Arts District: | 42.3% |
| Tulsa: | 19.4% |
Percentage of never married females 15 years old and over:
| Brady Arts District: | 20.6% |
| city: | 17.6% |
Percentage of people that speak English not well or not at all:
| Brady Arts District: | 2.1% |
| Tulsa: | 5.0% |
Percentage of people born in this state:
Percentage of people born in another U.S. state:
Percentage of native residents but born outside the U.S.:
Percentage of foreign born residents:
| Here: | 51.8% |
| Tulsa: | 55.7% |
Percentage of people born in another U.S. state:
| Brady Arts District: | 37.1% |
| Tulsa: | 31.1% |
Percentage of native residents but born outside the U.S.:
| Here: | 1.8% |
| city: | 1.3% |
Percentage of foreign born residents:
| Here: | 9.3% |
| Tulsa: | 11.8% |
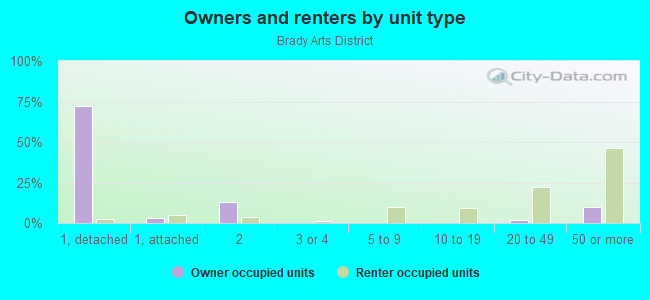
Owner-occupied
Renter-occupied

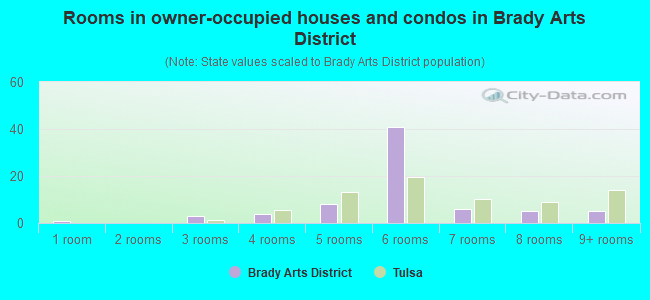
- Rooms in owner-occupied houses and condos in Brady Arts District
- 11 room
- 02 rooms
- 33 rooms
- 44 rooms
- 85 rooms
- 416 rooms
- 67 rooms
- 58 rooms
- 59+ rooms
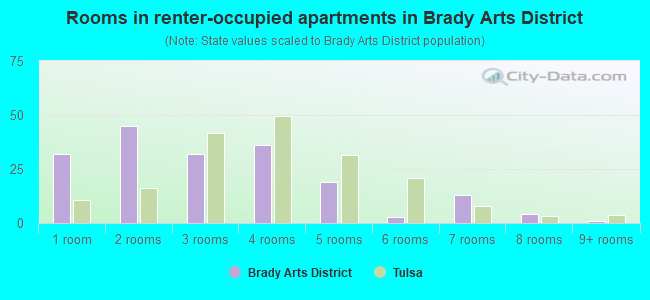
- Rooms in renter-occupied apartments in Brady Arts District
- 321 room
- 452 rooms
- 323 rooms
- 364 rooms
- 195 rooms
- 36 rooms
- 137 rooms
- 48 rooms
- 19+ rooms
Owner-occupied
Renter-occupied
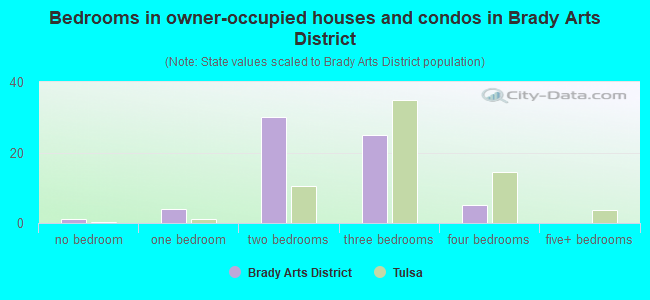
- Bedrooms in owner-occupied houses and condos in Brady Arts District
- 1no bedroom
- 41 bedroom
- 302 bedrooms
- 253 bedrooms
- 54 bedrooms
- 05+ bedrooms
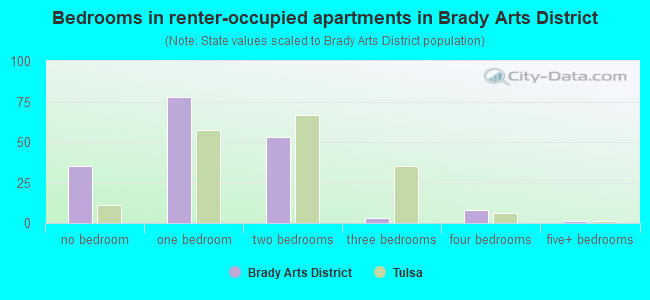
- Bedrooms in renter-occupied apartments in Brady Arts District
- 35no bedroom
- 781 bedroom
- 532 bedrooms
- 33 bedrooms
- 84 bedrooms
- 15+ bedrooms
Average number of cars or other vehicles available in houses/condos:
Average number of cars or other vehicles available in apartments:
| This neighborhood: | |
| Tulsa: |
Average number of cars or other vehicles available in apartments:
| Here: | 1.1 |
| city: | 1.3 |
Percentage of units with a mortgage:
| Brady Arts District: | 38.2% |
| Tulsa: | 57.3% |
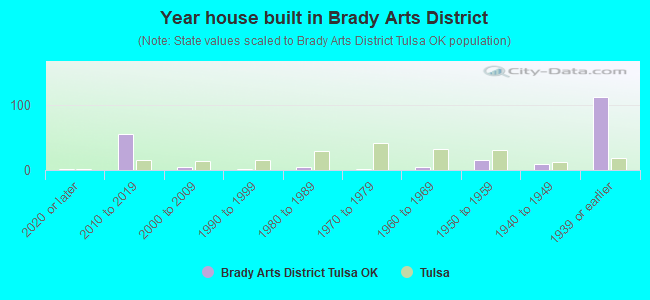
- Year house built in Brady Arts District
- 22020 or later
- 552010 to 2019
- 52000 to 2009
- 21990 to 1999
- 51980 to 1989
- 11970 to 1979
- 41960 to 1969
- 161950 to 1959
- 91940 to 1949
- 1121939 or earlier
Travel time to work (commute)
![Travel time to work (commute)]()
- 12Less than 5 minutes
- 365 to 9 minutes
- 2210 to 14 minutes
- 2515 to 19 minutes
- 820 to 24 minutes
- 1025 to 29 minutes
- 430 to 34 minutes
- 445 to 59 minutes
- 360 to 89 minutes
- 190 or more minutes

Means of transportation to work
![Means of transportation to work]()
- 59.8%115Drove a car alone
- 6.8%13Carpooled
- 1.0%2Bus
- 1.0%2Bicycle
- 14.0%27Walked
- 15.6%30Worked at home

Time leaving home to go to work
![Time leaving home to go to work]()
- 212:00 a.m. to 4:59 a.m.
- 25:00 a.m. to 5:29 a.m.
- 46:00 a.m. to 6:29 a.m.
- 76:30 a.m. to 6:59 a.m.
- 187:00 a.m. to 7:29 a.m.
- 217:30 a.m. to 7:59 a.m.
- 198:00 a.m. to 8:29 a.m.
- 238:30 a.m. to 8:59 a.m.
- 119:00 a.m. to 9:59 a.m.
- 210:00 a.m. to 10:59 a.m.
- 111:00 a.m. to 11:59 a.m.
- 312:00 p.m. to 3:59 p.m.
- 94:00 p.m. to 11:59 p.m.

Occupations of males:
- Percentage of males in management occupations (except farmers):
Here: 18.0% city: 10.6%
- Percentage of males in business and financial operations occupations:
Here: 11.1% city: 4.9%
- Percentage of males in computer and mathematical occupations:
Here: 8.4% city: 3.7%
- Percentage of males in architecture and engineering occupations:
Here: 10.3% city: 3.1%
- Percentage of males in legal occupations:
Here: 1.4% city: 1.6%
- Percentage of males in education, training, and library occupations:
Here: 3.5% city: 3.0%
- Percentage of males in arts, design, entertainment, sports, and media occupations:
Here: 11.0% city: 2.0%
- Percentage of males in healthcare practitioners and technical occupations:
Here: 9.5% city: 4.0%
- Percentage of males in service occupations:
Here: 5.5% city: 13.9%
- Percentage of males in sales and office occupations:
Here: 17.7% city: 15.7%
- Percentage of males in construction, extraction, and maintenance occupations:
Here: 1.3% city: 10.8%
- Percentage of males in material moving occupations:
Here: 3.5% city: 5.5%
Occupations of females:
- Percentage of females in management occupations (except farmers):
Here: 26.0% city: 8.3%
- Percentage of females in business and financial operations occupations:
Here: 9.3% city: 6.3%
- Percentage of females in computer and mathematical occupations:
Here: 4.7% city: 1.4%
- Percentage of females in life, physical, and social science occupations:
Here: 2.6% city: 0.6%
- Percentage of females in community and social services occupations:
Here: 22.0% city: 2.6%
- Percentage of females in legal occupations:
Here: 9.0% city: 1.7%
- Percentage of females in arts, design, entertainment, sports, and media occupations:
Here: 12.4% city: 2.3%
- Percentage of females in healthcare practitioners and technical occupations:
Here: 9.0% city: 9.2%
- Percentage of females in service occupations:
Here: 4.5% city: 21.8%
- Percentage of females in sales and office occupations:
Here: 4.9% city: 28.9%
Percentage of people 16-64 in Armed Forces:
| Brady Arts District: | 0.3% |
| Tulsa: | 0.2% |
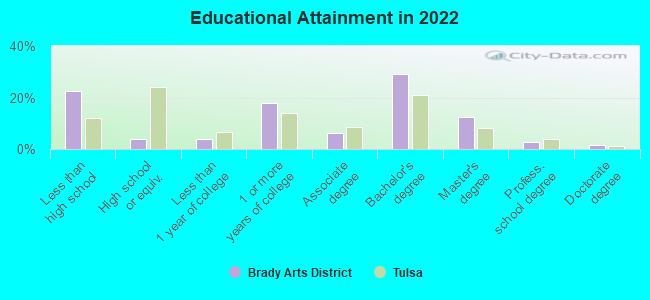
Education in this neighborhood (subdivision or community):
- Percentage of people 3 years and older in K-12 schools:
Brady Arts District: 16.4% Tulsa: 17.8%
- Percentage of people 3 years and older in undergraduate colleges:
Brady Arts District: 8.8% Tulsa: 4.7%
- Percentage of people 3 years and older in grad. or professional schools:
Brady Arts District: 7.1% Tulsa: 1.5%
- Percentage of students K-12 enrolled in private schools:
Brady Arts District: 30.8% Tulsa: 15.2%
Percentage of population below poverty level:
| Brady Arts District: | 22.3% |
| Tulsa: | 20.0% |
Percentage of married-couple families with both working:
| Brady Arts District: | 77.0% |
| Tulsa: | 66.7% |
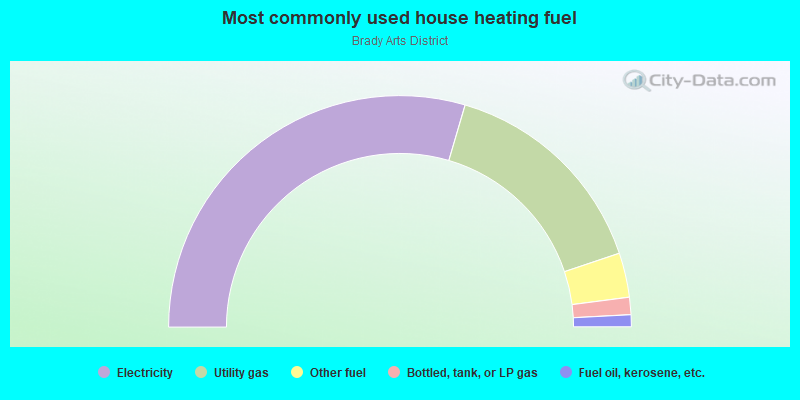
- 59.1%Electricity
- 30.6%Utility gas
- 6.2%Other fuel
- 2.4%Bottled, tank, or LP gas
- 1.7%Fuel oil, kerosene, etc.
Roads and streets:
N Cheyenne Ave
Length: 0.38 miles
Directions: N-S, SE-NW
Address range: 1 to 499
Directions: N-S, SE-NW
Address range: 1 to 499
N Denver Ave
Length: 0.38 miles
Direction: SE-NW
Address range: 1 to 499
Direction: SE-NW
Address range: 1 to 499
E Archer St
Length: 0.34 miles
Direction: E-W
Address range: 1 to 399
Direction: E-W
Address range: 1 to 399
E Brady St
Length: 0.34 miles
Direction: E-W
Address range: 1 to 399
Direction: E-W
Address range: 1 to 399
N Detroit Ave
Length: 0.33 miles
Direction: SE-NW
Address range: 1 to 408
Direction: SE-NW
Address range: 1 to 408
N Boulder Ave
Length: 0.30 miles
Direction: SE-NW
Address range: 100 to 499
Direction: SE-NW
Address range: 100 to 499
N Main St
Length: 0.27 miles
Direction: SE-NW
Address range: 1 to 399
Direction: SE-NW
Address range: 1 to 399
N Cincinnati Ave
Length: 0.27 miles
Direction: SE-NW
Address range: 1 to 399
Direction: SE-NW
Address range: 1 to 399
W Cameron St
Length: 0.26 miles
Direction: E-W
Address range: 1 to 299
Direction: E-W
Address range: 1 to 299
W Archer St
Length: 0.26 miles
Direction: E-W
Address range: 1 to 299
Direction: E-W
Address range: 1 to 299
W Brady St
Length: 0.26 miles
Direction: E-W
Address range: 1 to 299
Direction: E-W
Address range: 1 to 299
E Cameron St
Length: 0.26 miles
Direction: E-W
Address range: 1 to 299
Direction: E-W
Address range: 1 to 299
N Boston Ave
Length: 0.25 miles
Direction: SE-NW
Address range: 100 to 424
Direction: SE-NW
Address range: 100 to 424
N Elgin Ave
Length: 0.24 miles
Direction: SE-NW
Address range: 1 to 300
Direction: SE-NW
Address range: 1 to 300
W Easton St
Length: 0.17 miles
Direction: E-W
Address range: 100 to 299
Direction: E-W
Address range: 100 to 299
N Boulder Ave W
Length: 0.07 miles
Direction: SE-NW
Direction: SE-NW
Railroad features:
St Louis-San Francisco Rlwy
Length: 1.39 miles
Directions: E-W, SW-NE
Directions: E-W, SW-NE
Missouri-Kansas-Texas RR
Length: 0.21 miles
Direction: E-W
Direction: E-W