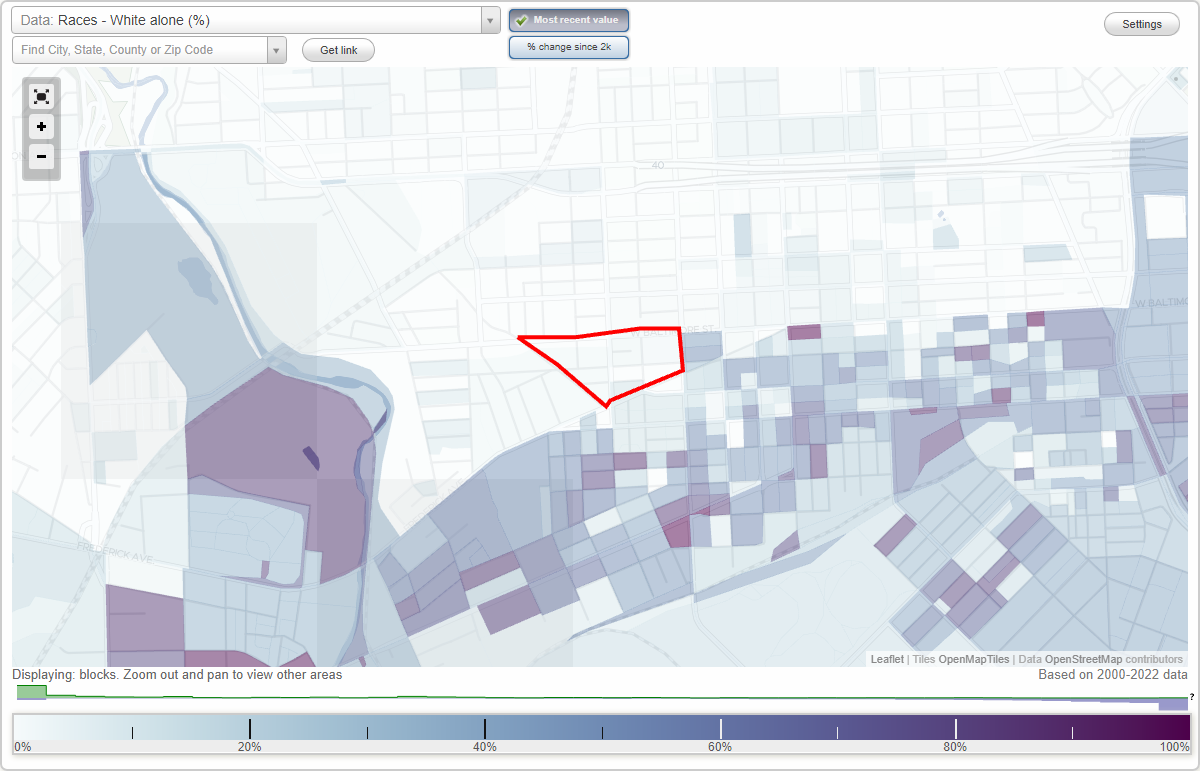
Booth-Boyd neighborhood in Baltimore, Maryland (MD), 21223 detailed profile
Settings
X

Business Search - 14 Million verified businesses
Area: 0.038 square miles
Population: 1,091
Population density:
| Booth-Boyd: | 28,506 people per square mile |
| Baltimore: | 7,053 people per square mile |

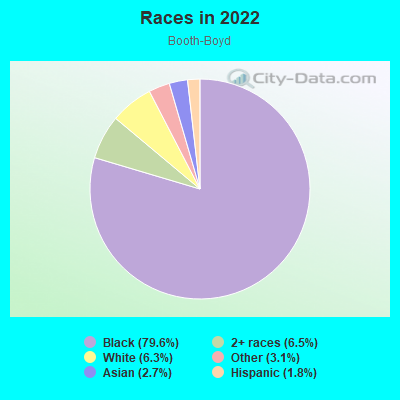
- 93079.6%Black
- 766.5%Two or more races
- 746.3%White
- 363.1%Some other race
- 312.7%Asian
- 211.8%Hispanic or Latino
Distribution of median household income
![Distribution of median household income]()
- 85Less than $10,000
- 58$10,000 to $19,999
- 61$20,000 to $29,999
- 66$30,000 to $39,999
- 54$40,000 to $49,999
- 21$50,000 to $59,999
- 81$60,000 to $74,999
- 128$75,000 to $99,999
- 62$100,000 to $124,999
- 18$125,000 to $149,999
- 65$150,000 to $199,999
- 43$200,000 or more

Distribution of owner-occupied house/condo value
![Distribution of owner-occupied house/condo value]()
- 173Less than $50,000
- 219$50,000 to $99,999
- 16$100,000 to $149,999
- 65$150,000 to $199,999
- 43$200,000 to $249,999
- 7$250,000 to $299,999

Distribution of rent paid by renters
![Distribution of rent paid by renters]()
- 74$100 to $199
- 66$200 to $299
- 12$400 to $499
- 21$500 to $599
- 79$600 to $699
- 87$700 to $799
- 102$800 to $899
- 18$900 to $999
- 30$1,000 to $1,249
- 50$1,250 to $1,499
- 55$1,500 to $1,999

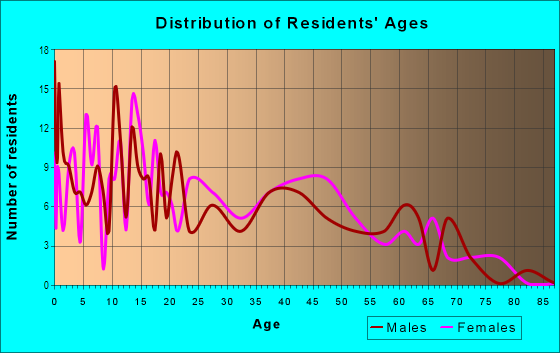
| Males: | 446 |
| Females: | 644 |
Males:
| This neighborhood: | 49.3 years |
| Whole city: | 35.0 years |
| This neighborhood: | 46.8 years |
| Whole city: | 38.2 years |
Average household size:
| Booth-Boyd: | 2.4 people |
| Baltimore: | 2.2 people |
Percentage of family households:
| Booth-Boyd: | 37.4% |
| Baltimore: | 34.2% |
| Here: | 12.5% |
| Baltimore: | 23.3% |
Percentage of married-couple families with children (among all households):
| Booth-Boyd: | 11.5% |
| Baltimore: | 22.4% |
Percentage of single-mother households (among all households):
| Booth-Boyd: | 29.8% |
| Baltimore: | 18.7% |
Percentage of never married males 15 years old and over:
Percentage of never married females 15 years old and over:
| Booth-Boyd: | 30.7% |
| Baltimore: | 25.1% |
Percentage of never married females 15 years old and over:
| Booth-Boyd: | 24.6% |
| city: | 27.5% |
Percentage of people that speak English not well or not at all:
| Booth-Boyd: | 0.8% |
| Baltimore: | 2.3% |
Percentage of people born in this state:
Percentage of people born in another U.S. state:
Percentage of native residents but born outside the U.S.:
Percentage of foreign born residents:
| Here: | 83.9% |
| Baltimore: | 64.4% |
Percentage of people born in another U.S. state:
| Booth-Boyd: | 12.0% |
| Baltimore: | 25.0% |
Percentage of native residents but born outside the U.S.:
| Here: | 0.8% |
| city: | 0.9% |
Percentage of foreign born residents:
| Here: | 3.8% |
| Baltimore: | 9.7% |
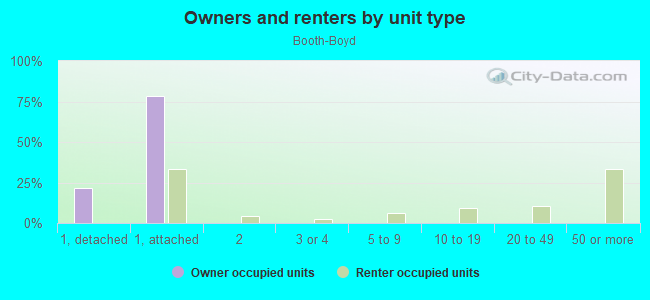
Owner-occupied
Renter-occupied

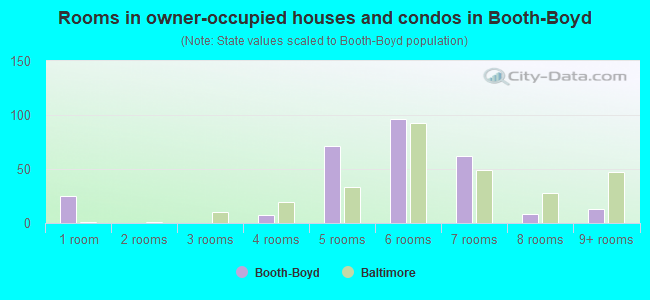
- Rooms in owner-occupied houses and condos in Booth-Boyd
- 251 room
- 02 rooms
- 03 rooms
- 74 rooms
- 715 rooms
- 966 rooms
- 627 rooms
- 88 rooms
- 139+ rooms
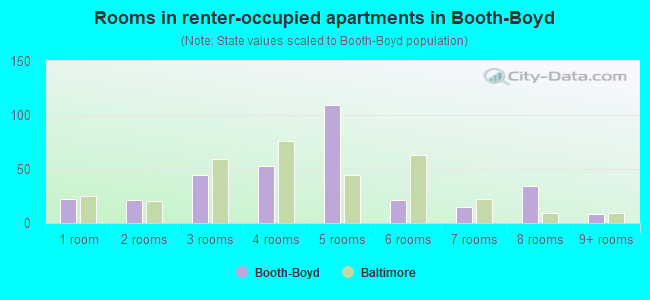
- Rooms in renter-occupied apartments in Booth-Boyd
- 221 room
- 212 rooms
- 443 rooms
- 534 rooms
- 1095 rooms
- 216 rooms
- 157 rooms
- 348 rooms
- 89+ rooms
Owner-occupied
Renter-occupied
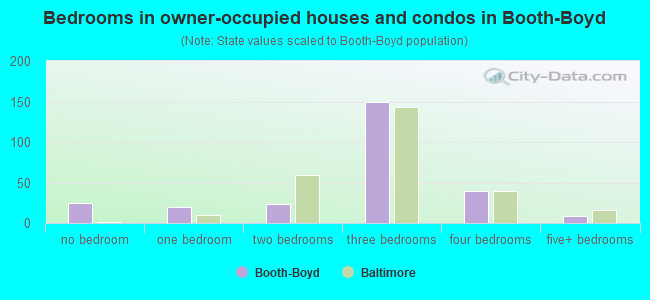
- Bedrooms in owner-occupied houses and condos in Booth-Boyd
- 25no bedroom
- 201 bedroom
- 242 bedrooms
- 1493 bedrooms
- 404 bedrooms
- 95+ bedrooms
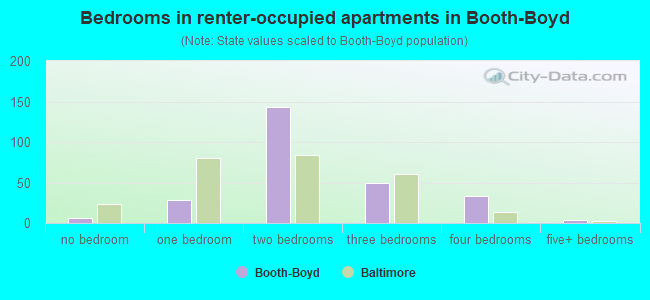
- Bedrooms in renter-occupied apartments in Booth-Boyd
- 6no bedroom
- 281 bedroom
- 1432 bedrooms
- 503 bedrooms
- 334 bedrooms
- 45+ bedrooms
Average number of cars or other vehicles available in houses/condos:
Average number of cars or other vehicles available in apartments:
| This neighborhood: | 2.5 |
| Baltimore: | 1.5 |
Average number of cars or other vehicles available in apartments:
| Here: | |
| city: |
Percentage of units with a mortgage:
| Booth-Boyd: | 42.4% |
| Baltimore: | 64.3% |
Average estimated value of townhouses or other attached units in 2022 (74.9% of all units):
| This neighborhood: | $100,768 |
| city: | $206,258 |
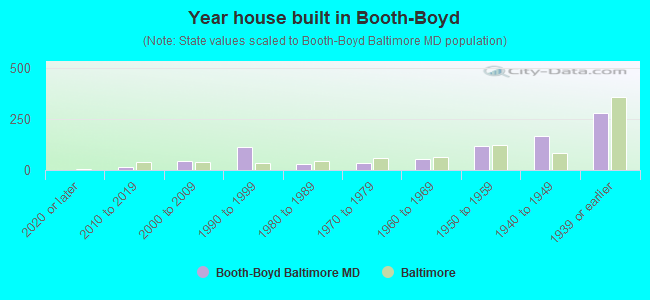
- Year house built in Booth-Boyd
- 02020 or later
- 132010 to 2019
- 422000 to 2009
- 1141990 to 1999
- 281980 to 1989
- 341970 to 1979
- 541960 to 1969
- 1181950 to 1959
- 1671940 to 1949
- 2801939 or earlier
Travel time to work (commute)
![Travel time to work (commute)]()
- 11Less than 5 minutes
- 365 to 9 minutes
- 5210 to 14 minutes
- 5715 to 19 minutes
- 2920 to 24 minutes
- 1125 to 29 minutes
- 4030 to 34 minutes
- 1035 to 39 minutes
- 4845 to 59 minutes
- 1860 to 89 minutes
- 2690 or more minutes

Means of transportation to work
![Means of transportation to work]()
- 48.9%240Drove a car alone
- 4.1%20Carpooled
- 31.6%155Bus
- 0.6%3Subway or elevated rail
- 0.8%4Taxi
- 11.8%58Walked
- 7.5%37Other means
- 7.1%35Worked at home

Time leaving home to go to work
![Time leaving home to go to work]()
- 2212:00 a.m. to 4:59 a.m.
- 295:00 a.m. to 5:29 a.m.
- 235:30 a.m. to 5:59 a.m.
- 206:00 a.m. to 6:29 a.m.
- 316:30 a.m. to 6:59 a.m.
- 317:00 a.m. to 7:29 a.m.
- 277:30 a.m. to 7:59 a.m.
- 378:00 a.m. to 8:29 a.m.
- 218:30 a.m. to 8:59 a.m.
- 359:00 a.m. to 9:59 a.m.
- 910:00 a.m. to 10:59 a.m.
- 311:00 a.m. to 11:59 a.m.
- 2812:00 p.m. to 3:59 p.m.
- 374:00 p.m. to 11:59 p.m.

Occupations of males:
- Percentage of males in computer and mathematical occupations:
Here: 6.2% city: 6.1%
- Percentage of males in life, physical, and social science occupations:
Here: 2.8% city: 2.3%
- Percentage of males in education, training, and library occupations:
Here: 8.3% city: 5.4%
- Percentage of males in service occupations:
Here: 11.5% city: 14.7%
- Percentage of males in sales and office occupations:
Here: 35.5% city: 14.2%
- Percentage of males in construction, extraction, and maintenance occupations:
Here: 5.8% city: 5.6%
- Percentage of males in production occupations:
Here: 10.7% city: 4.2%
- Percentage of males in material moving occupations:
Here: 21.2% city: 7.0%
Occupations of females:
- Percentage of females in management occupations (except farmers):
Here: 9.5% city: 10.1%
- Percentage of females in education, training, and library occupations:
Here: 5.3% city: 10.7%
- Percentage of females in service occupations:
Here: 39.9% city: 20.4%
- Percentage of females in sales and office occupations:
Here: 29.8% city: 22.3%
- Percentage of females in production occupations:
Here: 8.8% city: 2.3%
- Percentage of females in transportation occupations:
Here: 3.9% city: 1.7%
- Percentage of females in material moving occupations:
Here: 2.4% city: 1.9%
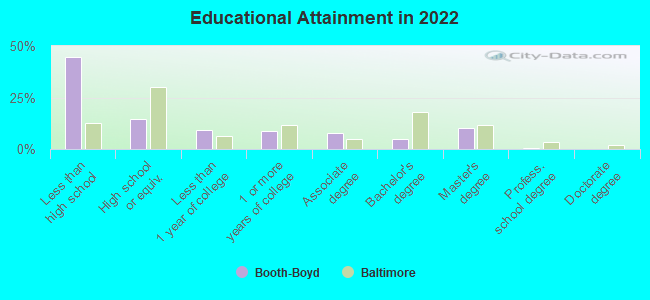
Education in this neighborhood (subdivision or community):
- Percentage of people 3 years and older in K-12 schools:
Booth-Boyd: 24.7% Baltimore: 14.7%
- Percentage of people 3 years and older in undergraduate colleges:
Booth-Boyd: 3.4% Baltimore: 6.0%
- Percentage of people 3 years and older in grad. or professional schools:
Booth-Boyd: 3.3% Baltimore: 2.8%
- Percentage of students K-12 enrolled in private schools:
Booth-Boyd: 5.7% Baltimore: 12.7%
Percentage of population below poverty level:
| Booth-Boyd: | 37.1% |
| Baltimore: | 18.5% |
Median year owner moved in (as recorded in 2022):
| Booth-Boyd: | 1993 |
| Baltimore: | 2009 |
Percentage of married-couple families with both working:
| Booth-Boyd: | 134.8% |
| Baltimore: | 79.2% |
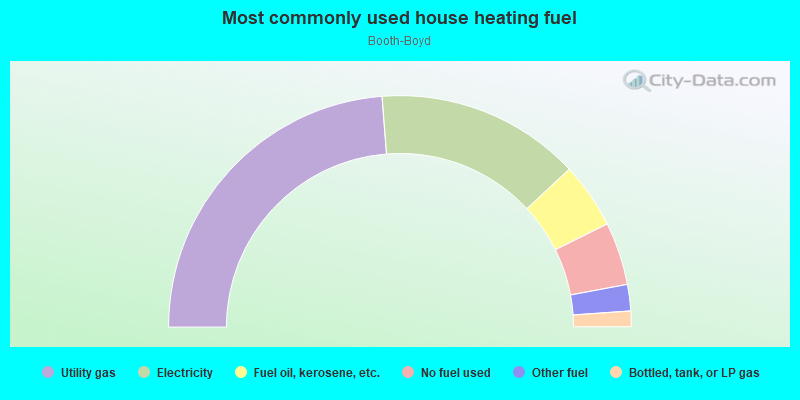
- 47.6%Utility gas
- 28.6%Electricity
- 9.2%Fuel oil, kerosene, etc.
- 8.8%No fuel used
- 3.7%Other fuel
- 2.2%Bottled, tank, or LP gas
Highways in this neighborhood:
US Hwy 1 (S Monroe St)
Length: 0.03 miles
Direction: N-S
Address range: 10 to 20
Direction: N-S
Address range: 10 to 20
Roads and streets:
Hollins St
Length: 0.31 miles
Direction: E-W
Address range: 1900 to 2198
Direction: E-W
Address range: 1900 to 2198
W Baltimore St
Length: 0.27 miles
Direction: E-W
Address range: 1901 to 2324
Direction: E-W
Address range: 1901 to 2324
Booth St
Length: 0.21 miles
Direction: E-W
Address range: 1900 to 2199
Direction: E-W
Address range: 1900 to 2199
S Payson St
Length: 0.10 miles
Direction: N-S
Address range: 1 to 64
Direction: N-S
Address range: 1 to 64
S Pulaski St
Length: 0.10 miles
Direction: N-S
Address range: 1 to 33
Direction: N-S
Address range: 1 to 33
Boyd St
Length: 0.10 miles
Direction: E-W
Address range: 2000 to 2099
Direction: E-W
Address range: 2000 to 2099
S Smallwood St
Length: 0.05 miles
Direction: N-S
Address range: 9 to 99
Direction: N-S
Address range: 9 to 99