Beverly Green neighborhood in Las Vegas, Nevada (NV), 89104 detailed profile
Settings
X

Business Search - 14 Million verified businesses
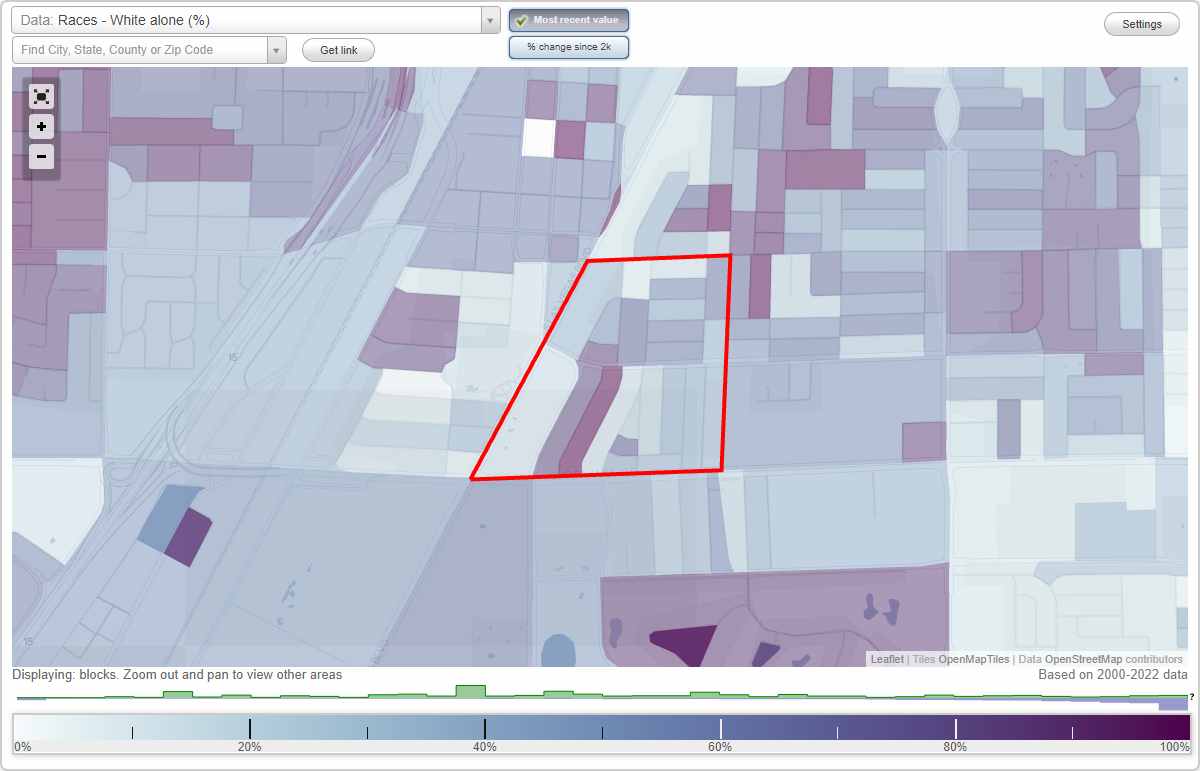
Area: 0.242 square miles
Population: 1,770
Population density:
| Beverly Green: | 7,307 people per square mile |
| Las Vegas: | 5,792 people per square mile |

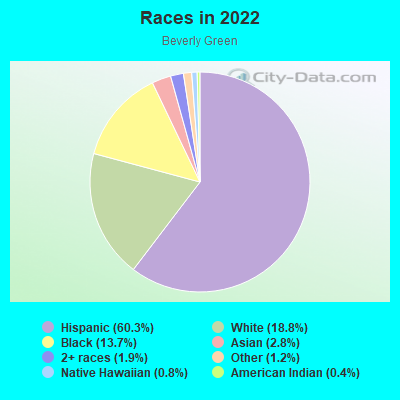
- 1,08460.3%Hispanic or Latino
- 33818.8%White
- 24713.7%Black
- 512.8%Asian
- 351.9%Two or more races
- 211.2%Some other race
- 150.8%Native Hawaiian and Other
Pacific Islander - 80.4%American Indian
Distribution of median household income
![Distribution of median household income]()
- 43Less than $10,000
- 188$10,000 to $19,999
- 78$20,000 to $29,999
- 83$30,000 to $39,999
- 31$40,000 to $49,999
- 25$50,000 to $59,999
- 118$60,000 to $74,999
- 14$75,000 to $99,999
- 87$100,000 to $124,999
- 11$125,000 to $149,999
- 9$150,000 to $199,999
- 32$200,000 or more

Distribution of owner-occupied house/condo value
![Distribution of owner-occupied house/condo value]()
- 7Less than $50,000
- 7$50,000 to $99,999
- 17$150,000 to $199,999
- 52$200,000 to $249,999
- 55$250,000 to $299,999
- 54$300,000 to $399,999
- 30$400,000 to $499,999
- 11$500,000 to $749,999
- 65$1,000,000 or more

Distribution of rent paid by renters
![Distribution of rent paid by renters]()
- 17Less than $100
- 238$100 to $199
- 26$200 to $299
- 20$300 to $399
- 12$400 to $499
- 120$500 to $599
- 76$600 to $699
- 121$700 to $799
- 56$800 to $899
- 41$900 to $999
- 104$1,000 to $1,249
- 51$1,250 to $1,499
- 35$1,500 to $1,999
- 10$2,000 or more

Median rent in 2022:
| Beverly Green: | $884 |
| Las Vegas: | $1,277 |
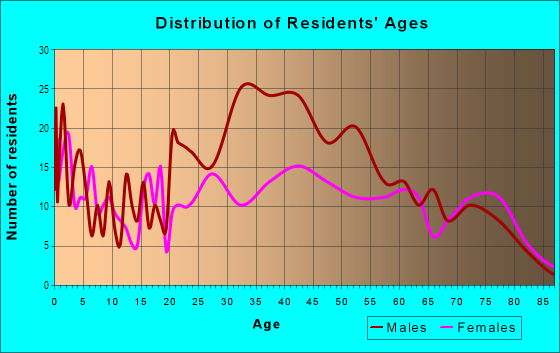
| Males: | 898 |
| Females: | 871 |
Males:
| This neighborhood: | 40.7 years |
| Whole city: | 38.4 years |
| This neighborhood: | 45.0 years |
| Whole city: | 38.9 years |
Average household size:
| Beverly Green: | 2.1 people |
| Las Vegas: | 2.7 people |
Percentage of family households:
| Beverly Green: | 32.2% |
| Las Vegas: | 45.8% |
| Here: | 23.3% |
| Las Vegas: | 40.9% |
Percentage of married-couple families with children (among all households):
| Beverly Green: | 17.4% |
| Las Vegas: | 23.4% |
Percentage of single-mother households (among all households):
| Beverly Green: | 11.4% |
| Las Vegas: | 10.1% |
Percentage of never married males 15 years old and over:
Percentage of never married females 15 years old and over:
| Beverly Green: | 23.3% |
| Las Vegas: | 19.7% |
Percentage of never married females 15 years old and over:
| Beverly Green: | 22.2% |
| city: | 17.0% |
Percentage of people that speak English not well or not at all:
| Beverly Green: | 20.9% |
| Las Vegas: | 7.0% |
Percentage of people born in this state:
Percentage of people born in another U.S. state:
Percentage of native residents but born outside the U.S.:
Percentage of foreign born residents:
| Here: | 22.5% |
| Las Vegas: | 27.3% |
Percentage of people born in another U.S. state:
| Beverly Green: | 42.9% |
| Las Vegas: | 49.8% |
Percentage of native residents but born outside the U.S.:
| Here: | 2.7% |
| city: | 1.9% |
Percentage of foreign born residents:
| Here: | 32.0% |
| Las Vegas: | 21.0% |
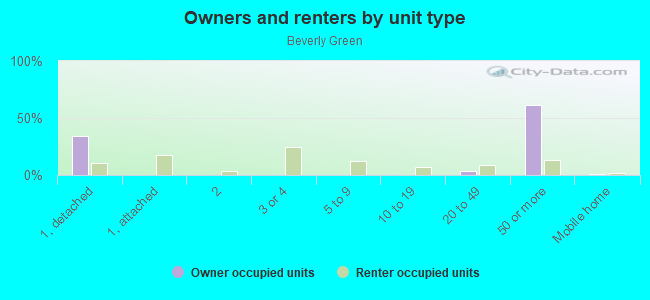
Owner-occupied
Renter-occupied

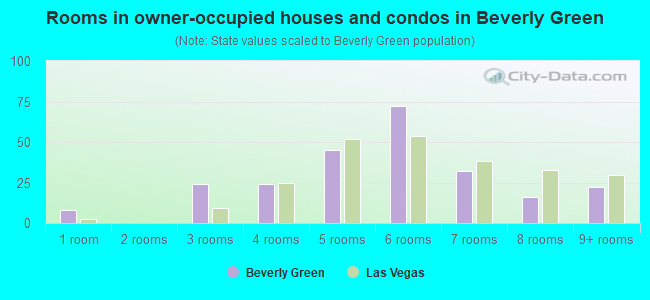
- Rooms in owner-occupied houses and condos in Beverly Green
- 81 room
- 02 rooms
- 243 rooms
- 244 rooms
- 455 rooms
- 726 rooms
- 327 rooms
- 168 rooms
- 229+ rooms
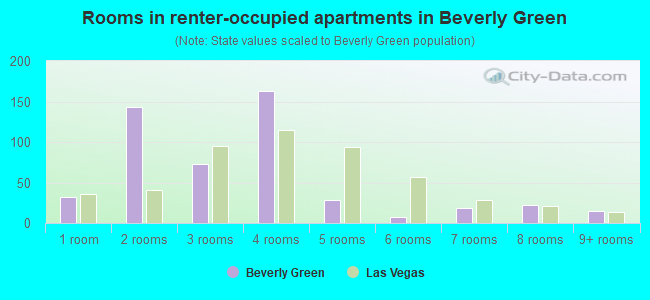
- Rooms in renter-occupied apartments in Beverly Green
- 321 room
- 1432 rooms
- 733 rooms
- 1634 rooms
- 285 rooms
- 76 rooms
- 187 rooms
- 228 rooms
- 159+ rooms
Owner-occupied
Renter-occupied
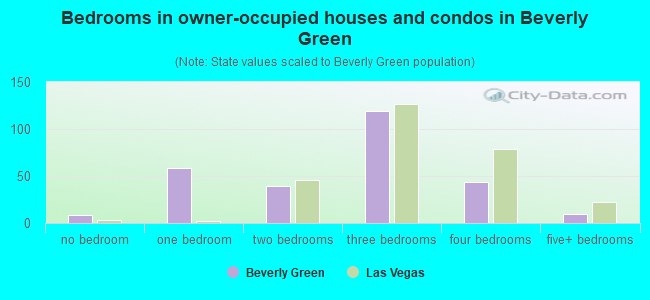
- Bedrooms in owner-occupied houses and condos in Beverly Green
- 8no bedroom
- 581 bedroom
- 392 bedrooms
- 1193 bedrooms
- 444 bedrooms
- 105+ bedrooms
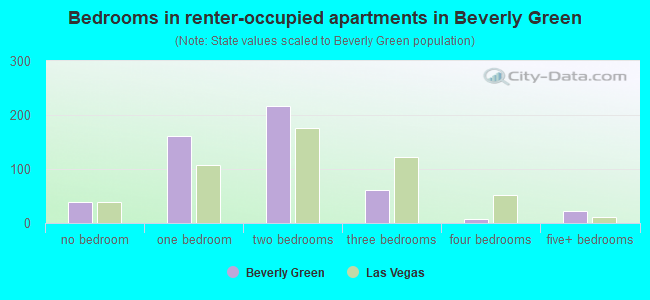
- Bedrooms in renter-occupied apartments in Beverly Green
- 38no bedroom
- 1611 bedroom
- 2172 bedrooms
- 623 bedrooms
- 84 bedrooms
- 225+ bedrooms
Average number of cars or other vehicles available in houses/condos:
Average number of cars or other vehicles available in apartments:
| This neighborhood: | 2.2 |
| Las Vegas: | 2.0 |
Average number of cars or other vehicles available in apartments:
| Here: | 0.6 |
| city: | 1.3 |
Percentage of units with a mortgage:
| Beverly Green: | 48.5% |
| Las Vegas: | 69.3% |
Average estimated value of detached houses in 2022 (33.3% of all units):
| Beverly Green: | $281,634 |
| Nevada: | $549,327 |
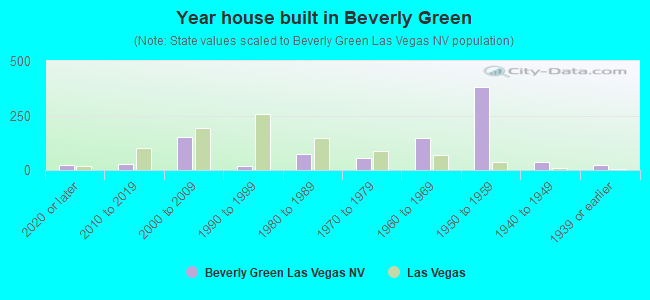
- Year house built in Beverly Green
- 212020 or later
- 262010 to 2019
- 1502000 to 2009
- 181990 to 1999
- 721980 to 1989
- 531970 to 1979
- 1451960 to 1969
- 3801950 to 1959
- 381940 to 1949
- 221939 or earlier
City-data.com crime index for city in 2020 (higher means more crime):
| City: | 280.7 |
| U.S. average: | 219.5 |
Travel time to work (commute)
![Travel time to work (commute)]()
- 13Less than 5 minutes
- 465 to 9 minutes
- 7510 to 14 minutes
- 12515 to 19 minutes
- 10520 to 24 minutes
- 5025 to 29 minutes
- 11230 to 34 minutes
- 735 to 39 minutes
- 1340 to 44 minutes
- 4145 to 59 minutes
- 4960 to 89 minutes
- 1390 or more minutes

Means of transportation to work
![Means of transportation to work]()
- 43.6%326Drove a car alone
- 18.5%138Carpooled
- 13.0%97Bus
- 1.3%10Subway or elevated rail
- 2.4%18Motorcycle
- 4.0%30Bicycle
- 2.8%21Walked
- 6.3%47Other means
- 9.0%67Worked at home

Time leaving home to go to work
![Time leaving home to go to work]()
- 2812:00 a.m. to 4:59 a.m.
- 345:00 a.m. to 5:29 a.m.
- 245:30 a.m. to 5:59 a.m.
- 526:00 a.m. to 6:29 a.m.
- 596:30 a.m. to 6:59 a.m.
- 477:00 a.m. to 7:29 a.m.
- 427:30 a.m. to 7:59 a.m.
- 828:00 a.m. to 8:29 a.m.
- 258:30 a.m. to 8:59 a.m.
- 399:00 a.m. to 9:59 a.m.
- 4110:00 a.m. to 10:59 a.m.
- 311:00 a.m. to 11:59 a.m.
- 5712:00 p.m. to 3:59 p.m.
- 1124:00 p.m. to 11:59 p.m.

Occupations of males:
- Percentage of males in management occupations (except farmers):
Here: 1.8% city: 9.6%
- Percentage of males in computer and mathematical occupations:
Here: 1.4% city: 3.4%
- Percentage of males in life, physical, and social science occupations:
Here: 2.0% city: 0.3%
- Percentage of males in education, training, and library occupations:
Here: 2.4% city: 2.5%
- Percentage of males in arts, design, entertainment, sports, and media occupations:
Here: 3.9% city: 2.5%
- Percentage of males in service occupations:
Here: 41.8% city: 23.3%
- Percentage of males in sales and office occupations:
Here: 15.2% city: 16.6%
- Percentage of males in construction, extraction, and maintenance occupations:
Here: 2.6% city: 10.6%
- Percentage of males in production occupations:
Here: 5.1% city: 3.3%
- Percentage of males in transportation occupations:
Here: 7.1% city: 6.6%
- Percentage of males in material moving occupations:
Here: 9.3% city: 5.4%
Occupations of females:
- Percentage of females in management occupations (except farmers):
Here: 5.8% city: 8.5%
- Percentage of females in computer and mathematical occupations:
Here: 5.2% city: 1.1%
- Percentage of females in community and social services occupations:
Here: 5.0% city: 1.9%
- Percentage of females in education, training, and library occupations:
Here: 1.9% city: 8.0%
- Percentage of females in arts, design, entertainment, sports, and media occupations:
Here: 2.1% city: 1.8%
- Percentage of females in healthcare practitioners and technical occupations:
Here: 4.4% city: 7.4%
- Percentage of females in service occupations:
Here: 47.6% city: 26.5%
- Percentage of females in sales and office occupations:
Here: 26.0% city: 30.5%
- Percentage of females in production occupations:
Here: 1.9% city: 1.8%
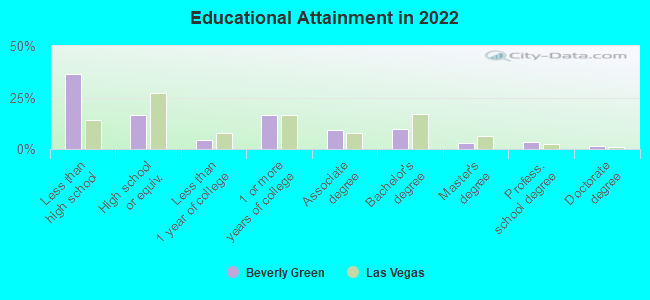
Education in this neighborhood (subdivision or community):
- Percentage of people 3 years and older in K-12 schools:
Beverly Green: 15.0% Las Vegas: 17.4%
- Percentage of people 3 years and older in undergraduate colleges:
Beverly Green: 3.5% Las Vegas: 4.2%
- Percentage of people 3 years and older in grad. or professional schools:
Beverly Green: 0.8% Las Vegas: 1.0%
- Percentage of students K-12 enrolled in private schools:
Beverly Green: 10.0% Las Vegas: 12.9%
Percentage of population below poverty level:
| Beverly Green: | 19.9% |
| Las Vegas: | 14.1% |
Median year owner moved in (as recorded in 2022):
Median year renter moved in (as recorded in 2022):
| Beverly Green: | 2009 |
| Las Vegas: | 2015 |
Median year renter moved in (as recorded in 2022):
| Beverly Green: | 2020 |
| Las Vegas: | 2020 |
Percentage of married-couple families with both working:
| Beverly Green: | 74.6% |
| Las Vegas: | 62.0% |
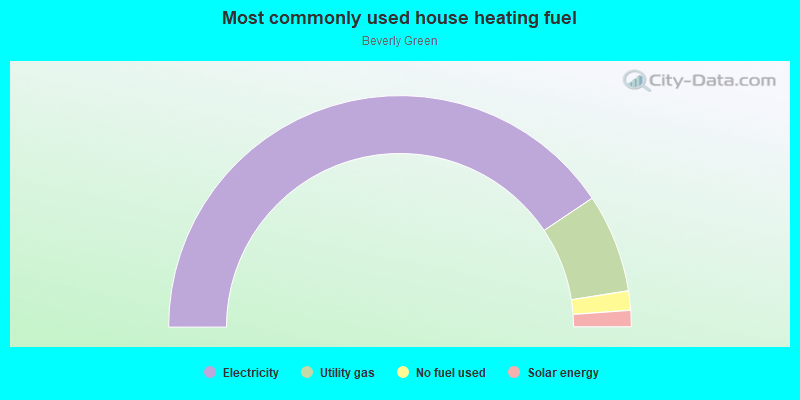
- 81.3%Electricity
- 13.8%Utility gas
- 2.7%No fuel used
- 2.3%Solar energy
Roads and streets:
E Saint Louis Ave
Length: 0.43 miles
Direction: E-W
Address range: 512 to 599
Direction: E-W
Address range: 512 to 599
Santa Paula Dr
Length: 0.26 miles
Directions: N-S, SE-NW
Address range: 1700 to 1999
Directions: N-S, SE-NW
Address range: 1700 to 1999
Barbara Way
Length: 0.25 miles
Direction: E-W
Address range: 400 to 599
Direction: E-W
Address range: 400 to 599
E Canosa Ave
Length: 0.24 miles
Direction: E-W
Address range: 500 to 599
Direction: E-W
Address range: 500 to 599
San Pablo Dr
Length: 0.22 miles
Directions: E-W, SE-NW
Address range: 400 to 599
Directions: E-W, SE-NW
Address range: 400 to 599
Santa Rosa Dr
Length: 0.22 miles
Direction: N-S
Address range: 2000 to 2399
Direction: N-S
Address range: 2000 to 2399
Van Patten Pl
Length: 0.21 miles
Direction: N-S
Address range: 2000 to 2398
Direction: N-S
Address range: 2000 to 2398
Santa Ynez Dr
Length: 0.21 miles
Direction: N-S
Address range: 2000 to 2399
Direction: N-S
Address range: 2000 to 2399
Weldon Pl
Length: 0.21 miles
Directions: E-W, SW-NE
Address range: 1700 to 1999
Directions: E-W, SW-NE
Address range: 1700 to 1999
Rexford Dr
Length: 0.21 miles
Direction: N-S
Address range: 1712 to 1999
Direction: N-S
Address range: 1712 to 1999
S Beverly Way
Length: 0.20 miles
Direction: N-S
Address range: 1700 to 1999
Direction: N-S
Address range: 1700 to 1999
Santa Rita Dr
Length: 0.19 miles
Directions: N-S, SW-NE
Address range: 2000 to 2309
Directions: N-S, SW-NE
Address range: 2000 to 2309
Bonita Ave
Length: 0.17 miles
Direction: E-W
Address range: 500 to 599
Direction: E-W
Address range: 500 to 599
Ellen Way
Length: 0.17 miles
Direction: E-W
Address range: 500 to 599
Direction: E-W
Address range: 500 to 599
S 6th St
Length: 0.10 miles
Direction: N-S
Address range: 1900 to 1999
Direction: N-S
Address range: 1900 to 1999
el Centro Pl
Length: 0.09 miles
Direction: E-W
Address range: 600 to 699
Direction: E-W
Address range: 600 to 699
San Pedro Dr (San Pedro)
Length: 0.06 miles
Directions: E-W, SE-NW
Address range: 500 to 599
Directions: E-W, SE-NW
Address range: 500 to 599