Better Waverly neighborhood in Baltimore, Maryland (MD), 21218 detailed profile
Settings
X

Business Search - 14 Million verified businesses
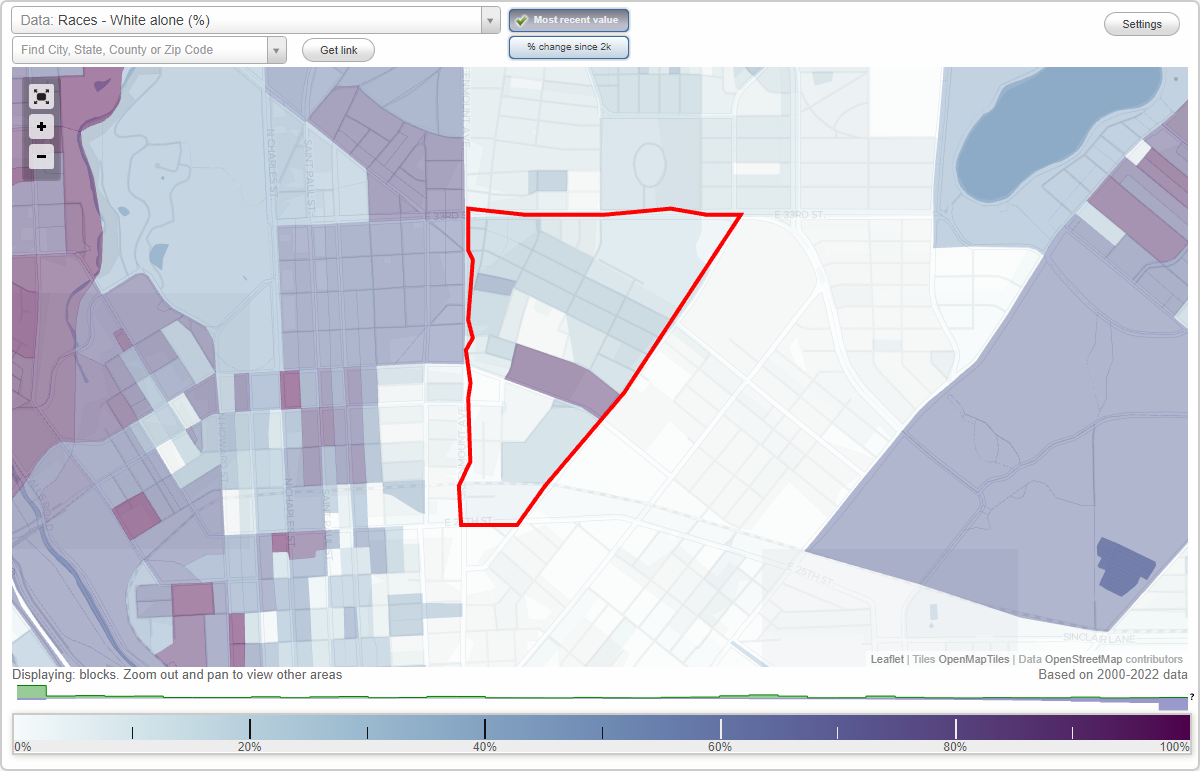
Area: 0.274 square miles
Population: 2,718
Population density:
| Better Waverly: | 9,930 people per square mile |
| Baltimore: | 7,053 people per square mile |

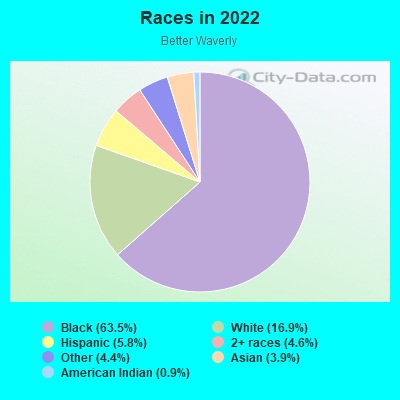
- 1,88463.5%Black
- 50016.9%White
- 1715.8%Hispanic or Latino
- 1374.6%Two or more races
- 1324.4%Some other race
- 1173.9%Asian
- 260.9%American Indian
Distribution of median household income
![Distribution of median household income]()
- 112Less than $10,000
- 226$10,000 to $19,999
- 191$20,000 to $29,999
- 191$30,000 to $39,999
- 171$40,000 to $49,999
- 112$50,000 to $59,999
- 162$60,000 to $74,999
- 134$75,000 to $99,999
- 140$100,000 to $124,999
- 79$125,000 to $149,999
- 111$150,000 to $199,999
- 39$200,000 or more

Distribution of owner-occupied house/condo value
![Distribution of owner-occupied house/condo value]()
- 322Less than $50,000
- 286$50,000 to $99,999
- 205$100,000 to $149,999
- 171$150,000 to $199,999
- 107$200,000 to $249,999
- 21$250,000 to $299,999
- 34$300,000 to $399,999
- 47$400,000 to $499,999
- 19$500,000 to $749,999
- 22$750,000 to $999,999

Distribution of rent paid by renters
![Distribution of rent paid by renters]()
- 68Less than $100
- 338$100 to $199
- 211$200 to $299
- 100$300 to $399
- 205$400 to $499
- 140$500 to $599
- 667$600 to $699
- 186$700 to $799
- 180$800 to $899
- 75$900 to $999
- 67$1,000 to $1,249
- 104$1,250 to $1,499
- 126$1,500 to $1,999
- 139$2,000 or more

Median rent in 2022:
| Better Waverly: | $978 |
| Baltimore: | $1,043 |
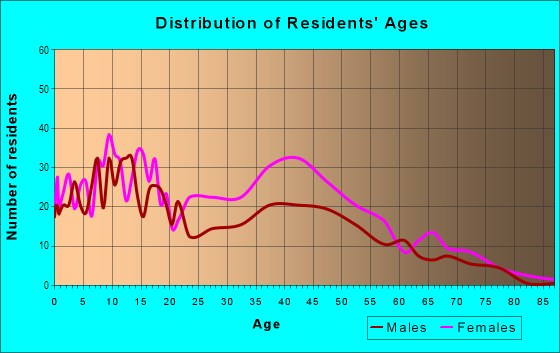
| Males: | 1,219 |
| Females: | 1,498 |
Males:
| This neighborhood: | 32.5 years |
| Whole city: | 35.0 years |
| This neighborhood: | 41.1 years |
| Whole city: | 38.2 years |
Average household size:
| Better Waverly: | 2.4 people |
| Baltimore: | 2.2 people |
Percentage of family households:
| Better Waverly: | 29.0% |
| Baltimore: | 34.2% |
| Here: | 16.9% |
| Baltimore: | 23.3% |
Percentage of married-couple families with children (among all households):
| Better Waverly: | 32.0% |
| Baltimore: | 22.4% |
Percentage of single-mother households (among all households):
| Better Waverly: | 88.6% |
| Baltimore: | 18.7% |
Percentage of never married males 15 years old and over:
Percentage of never married females 15 years old and over:
| Better Waverly: | 27.4% |
| Baltimore: | 25.1% |
Percentage of never married females 15 years old and over:
| Better Waverly: | 27.6% |
| city: | 27.5% |
Percentage of people that speak English not well or not at all:
| Better Waverly: | 1.6% |
| Baltimore: | 2.3% |
Percentage of people born in this state:
Percentage of people born in another U.S. state:
Percentage of native residents but born outside the U.S.:
Percentage of foreign born residents:
| Here: | 68.3% |
| Baltimore: | 64.4% |
Percentage of people born in another U.S. state:
| Better Waverly: | 24.4% |
| Baltimore: | 25.0% |
Percentage of native residents but born outside the U.S.:
| Here: | 3.0% |
| city: | 0.9% |
Percentage of foreign born residents:
| Here: | 4.4% |
| Baltimore: | 9.7% |
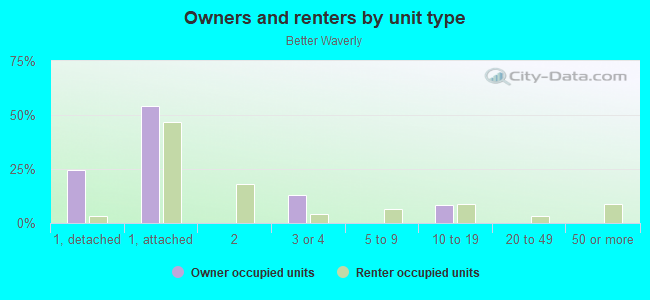
Owner-occupied
Renter-occupied

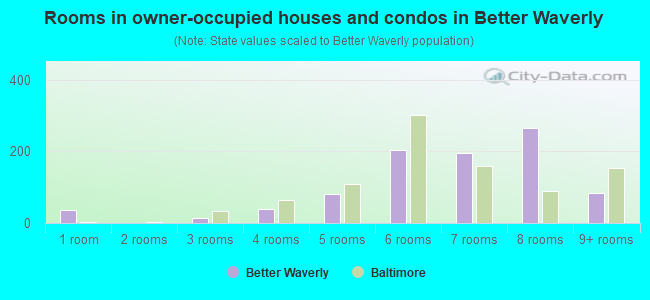
- Rooms in owner-occupied houses and condos in Better Waverly
- 371 room
- 02 rooms
- 133 rooms
- 384 rooms
- 825 rooms
- 2056 rooms
- 1967 rooms
- 2658 rooms
- 849+ rooms
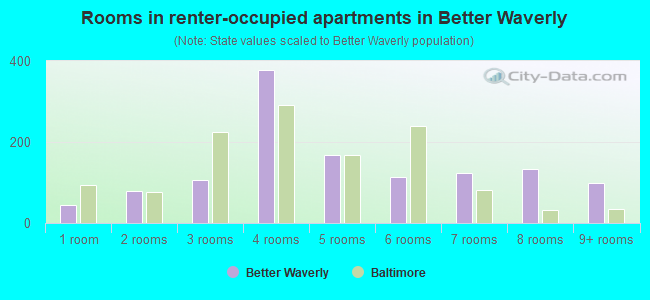
- Rooms in renter-occupied apartments in Better Waverly
- 451 room
- 802 rooms
- 1063 rooms
- 3784 rooms
- 1695 rooms
- 1136 rooms
- 1237 rooms
- 1338 rooms
- 999+ rooms
Owner-occupied
Renter-occupied
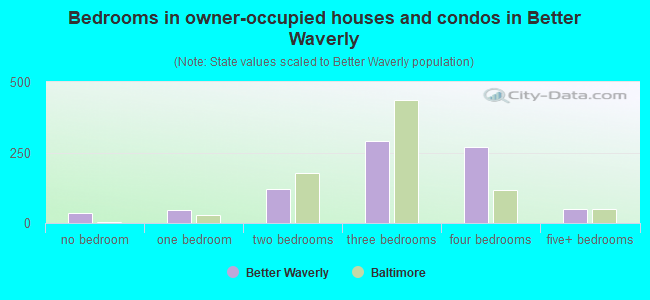
- Bedrooms in owner-occupied houses and condos in Better Waverly
- 37no bedroom
- 461 bedroom
- 1192 bedrooms
- 2903 bedrooms
- 2704 bedrooms
- 495+ bedrooms
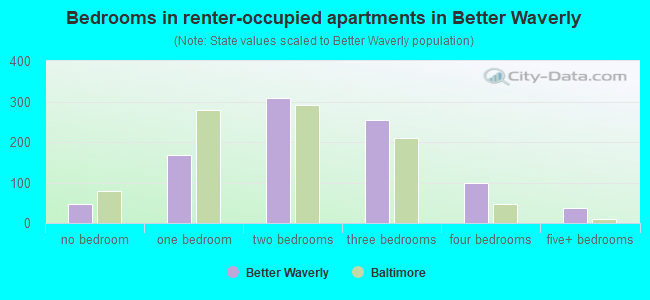
- Bedrooms in renter-occupied apartments in Better Waverly
- 46no bedroom
- 1691 bedroom
- 3092 bedrooms
- 2553 bedrooms
- 1004 bedrooms
- 385+ bedrooms
Average number of cars or other vehicles available in houses/condos:
Average number of cars or other vehicles available in apartments:
| This neighborhood: | 1.4 |
| Baltimore: | 1.5 |
Average number of cars or other vehicles available in apartments:
| Here: | 0.6 |
| city: | 0.8 |
Percentage of units with a mortgage:
| Better Waverly: | 68.8% |
| Baltimore: | 64.3% |
Average estimated value of townhouses or other attached units in 2022 (66.6% of all units):
| This neighborhood: | $165,823 |
| city: | $206,258 |
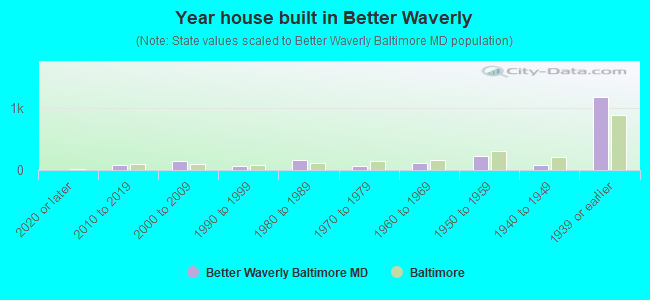
- Year house built in Better Waverly
- 02020 or later
- 802010 to 2019
- 1452000 to 2009
- 681990 to 1999
- 1541980 to 1989
- 701970 to 1979
- 1161960 to 1969
- 2281950 to 1959
- 821940 to 1949
- 1,1771939 or earlier
Travel time to work (commute)
![Travel time to work (commute)]()
- 35Less than 5 minutes
- 505 to 9 minutes
- 10710 to 14 minutes
- 26715 to 19 minutes
- 9620 to 24 minutes
- 3625 to 29 minutes
- 24130 to 34 minutes
- 5235 to 39 minutes
- 6640 to 44 minutes
- 10945 to 59 minutes
- 5360 to 89 minutes
- 2590 or more minutes

Means of transportation to work
![Means of transportation to work]()
- 54.1%728Drove a car alone
- 14.2%191Carpooled
- 16.9%228Bus
- 15.4%207Subway or elevated rail
- 1.6%22Long-distance train or commuter rail
- 1.0%13Light rail, streetcar or trolley
- 3.8%51Taxi
- 4.2%57Bicycle
- 7.1%96Walked
- 2.8%37Other means
- 17.1%230Worked at home

Time leaving home to go to work
![Time leaving home to go to work]()
- 1012:00 a.m. to 4:59 a.m.
- 635:00 a.m. to 5:29 a.m.
- 155:30 a.m. to 5:59 a.m.
- 506:00 a.m. to 6:29 a.m.
- 1106:30 a.m. to 6:59 a.m.
- 627:00 a.m. to 7:29 a.m.
- 517:30 a.m. to 7:59 a.m.
- 1508:00 a.m. to 8:29 a.m.
- 538:30 a.m. to 8:59 a.m.
- 1209:00 a.m. to 9:59 a.m.
- 9110:00 a.m. to 10:59 a.m.
- 2511:00 a.m. to 11:59 a.m.
- 14712:00 p.m. to 3:59 p.m.
- 1074:00 p.m. to 11:59 p.m.

Occupations of males:
- Percentage of males in management occupations (except farmers):
Here: 6.7% city: 10.7%
- Percentage of males in business and financial operations occupations:
Here: 3.2% city: 5.9%
- Percentage of males in computer and mathematical occupations:
Here: 3.0% city: 6.1%
- Percentage of males in life, physical, and social science occupations:
Here: 1.5% city: 2.3%
- Percentage of males in community and social services occupations:
Here: 1.5% city: 1.6%
- Percentage of males in education, training, and library occupations:
Here: 9.4% city: 5.4%
- Percentage of males in arts, design, entertainment, sports, and media occupations:
Here: 2.0% city: 2.8%
- Percentage of males in healthcare practitioners and technical occupations:
Here: 2.5% city: 4.0%
- Percentage of males in service occupations:
Here: 28.3% city: 14.7%
- Percentage of males in sales and office occupations:
Here: 19.1% city: 14.2%
- Percentage of males in construction, extraction, and maintenance occupations:
Here: 4.8% city: 5.6%
- Percentage of males in production occupations:
Here: 3.6% city: 4.2%
- Percentage of males in transportation occupations:
Here: 2.1% city: 6.8%
- Percentage of males in material moving occupations:
Here: 7.3% city: 7.0%
Occupations of females:
- Percentage of females in management occupations (except farmers):
Here: 9.9% city: 10.1%
- Percentage of females in business and financial operations occupations:
Here: 2.7% city: 6.6%
- Percentage of females in computer and mathematical occupations:
Here: 1.0% city: 2.4%
- Percentage of females in life, physical, and social science occupations:
Here: 3.0% city: 2.5%
- Percentage of females in community and social services occupations:
Here: 7.4% city: 3.6%
- Percentage of females in education, training, and library occupations:
Here: 11.2% city: 10.7%
- Percentage of females in arts, design, entertainment, sports, and media occupations:
Here: 5.0% city: 2.4%
- Percentage of females in healthcare practitioners and technical occupations:
Here: 5.9% city: 9.8%
- Percentage of females in service occupations:
Here: 19.6% city: 20.4%
- Percentage of females in sales and office occupations:
Here: 28.7% city: 22.3%
- Percentage of females in material moving occupations:
Here: 4.1% city: 1.9%
Percentage of people 16-64 in Armed Forces:
| Better Waverly: | 0.0% |
| Baltimore: | 0.4% |
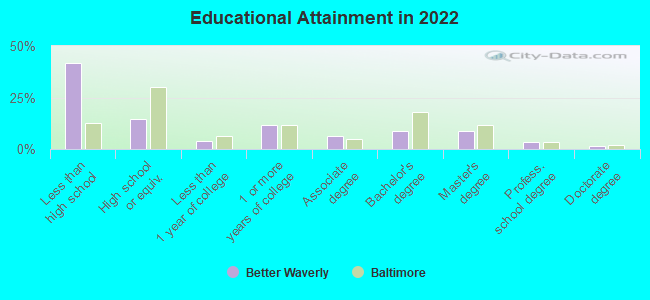
Education in this neighborhood (subdivision or community):
- Percentage of people 3 years and older in K-12 schools:
Better Waverly: 25.5% Baltimore: 14.7%
- Percentage of people 3 years and older in undergraduate colleges:
Better Waverly: 5.7% Baltimore: 6.0%
- Percentage of people 3 years and older in grad. or professional schools:
Better Waverly: 5.3% Baltimore: 2.8%
- Percentage of students K-12 enrolled in private schools:
Better Waverly: 27.5% Baltimore: 12.7%
Percentage of population below poverty level:
| Better Waverly: | 27.1% |
| Baltimore: | 18.5% |
Median year renter moved in (as recorded in 2022):
| Better Waverly: | 2017 |
| Baltimore: | 2019 |
Percentage of married-couple families with both working:
| Better Waverly: | 224.2% |
| Baltimore: | 79.2% |
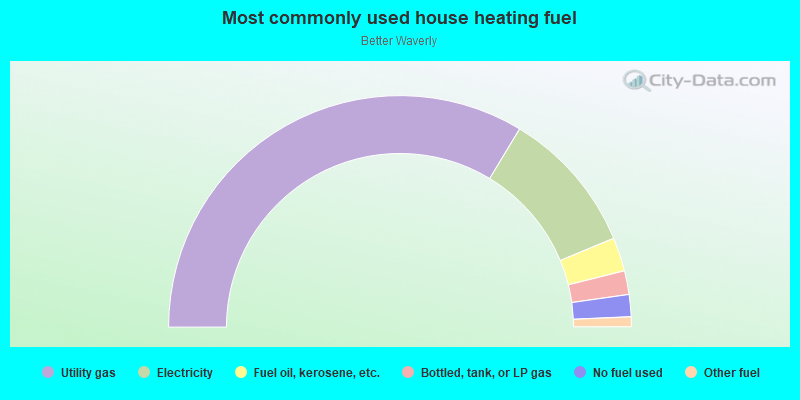
- 67.3%Utility gas
- 20.2%Electricity
- 4.7%Fuel oil, kerosene, etc.
- 3.3%Bottled, tank, or LP gas
- 3.1%No fuel used
- 1.4%Other fuel
Highways in this neighborhood:
State Hwy 45 (Greenmount Ave)
Length: 0.06 miles
Direction: N-S
Address range: 2500 to 2534
Direction: N-S
Address range: 2500 to 2534
Roads and streets:
E 33rd St
Length: 0.73 miles
Direction: E-W
Direction: E-W
Montpelier St
Length: 0.55 miles
Direction: E-W
Address range: 500 to 1199
Direction: E-W
Address range: 500 to 1199
Loch Raven Rd
Length: 0.54 miles
Direction: SW-NE
Address range: 2500 to 3098
Direction: SW-NE
Address range: 2500 to 3098
Gorsuch Ave
Length: 0.44 miles
Direction: E-W
Address range: 600 to 999
Direction: E-W
Address range: 600 to 999
Mathews St
Length: 0.44 miles
Directions: N-S, SW-NE
Address range: 2600 to 3099
Directions: N-S, SW-NE
Address range: 2600 to 3099
E 30th St
Length: 0.42 miles
Directions: E-W, SE-NW
Address range: 517 to 1199
Directions: E-W, SE-NW
Address range: 517 to 1199
Homestead St
Length: 0.40 miles
Directions: E-W, SE-NW
Address range: 600 to 999
Directions: E-W, SE-NW
Address range: 600 to 999
Frisby St
Length: 0.31 miles
Directions: N-S, SW-NE
Address range: 3000 to 3299
Directions: N-S, SW-NE
Address range: 3000 to 3299
Exeter Hall Ave
Length: 0.30 miles
Directions: E-W, SE-NW
Address range: 700 to 1199
Directions: E-W, SE-NW
Address range: 700 to 1199
Ellerslie Ave
Length: 0.30 miles
Directions: N-S, SE-NW, SW-NE
Address range: 3000 to 3299
Directions: N-S, SE-NW, SW-NE
Address range: 3000 to 3299
Independence St
Length: 0.25 miles
Directions: SE-NW, SW-NE
Address range: 2900 to 3049
Directions: SE-NW, SW-NE
Address range: 2900 to 3049
Reese St
Length: 0.23 miles
Directions: E-W, N-S, SE-NW, SW-NE
Address range: 2700 to 3099
Directions: E-W, N-S, SE-NW, SW-NE
Address range: 2700 to 3099
Old York Rd
Length: 0.17 miles
Direction: N-S
Address range: 3012 to 3299
Direction: N-S
Address range: 3012 to 3299
Belle Terre Ave
Length: 0.17 miles
Direction: E-W
Address range: 700 to 899
Direction: E-W
Address range: 700 to 899
E 25th St
Length: 0.17 miles
Direction: E-W
Address range: 500 to 599
Direction: E-W
Address range: 500 to 599
Tinges Ln
Length: 0.16 miles
Direction: SW-NE
Address range: 3000 to 3299
Direction: SW-NE
Address range: 3000 to 3299
Boone St
Length: 0.13 miles
Direction: N-S
Address range: 2600 to 2799
Direction: N-S
Address range: 2600 to 2799
Fillmore St
Length: 0.13 miles
Directions: E-W, SW-NE
Address range: 1100 to 1299
Directions: E-W, SW-NE
Address range: 1100 to 1299
E 27th St
Length: 0.12 miles
Direction: E-W
Address range: 512 to 699
Direction: E-W
Address range: 512 to 699
E 26th St
Length: 0.12 miles
Direction: E-W
Address range: 500 to 599
Direction: E-W
Address range: 500 to 599
Rabes Ave
Length: 0.12 miles
Direction: N-S
Direction: N-S
E 31st St
Length: 0.11 miles
Direction: E-W
Address range: 600 to 699
Direction: E-W
Address range: 600 to 699
E 28th St
Length: 0.09 miles
Direction: E-W
Direction: E-W
Hartz Ln
Length: 0.09 miles
Direction: SW-NE
Address range: 3000 to 3099
Direction: SW-NE
Address range: 3000 to 3099
E 29th St
Length: 0.08 miles
Direction: E-W
Address range: 600 to 699
Direction: E-W
Address range: 600 to 699
Avon Ave
Length: 0.08 miles
Direction: N-S
Address range: 3200 to 3299
Direction: N-S
Address range: 3200 to 3299
Westerwald Ave
Length: 0.06 miles
Direction: N-S
Address range: 3200 to 3299
Direction: N-S
Address range: 3200 to 3299
Limond Pl
Length: 0.04 miles
Direction: N-S
Address range: 2900 to 2999
Direction: N-S
Address range: 2900 to 2999
E 32nd St
Length: 0.03 miles
Direction: E-W
Address range: 600 to 699
Direction: E-W
Address range: 600 to 699
Railroad features:
Baltimore and Ohio RR
Length: 0.19 miles
Direction: E-W
Direction: E-W