Bergen Hill neighborhood in Jersey City, New Jersey (NJ), 07304 detailed profile
Settings
X

Business Search - 14 Million verified businesses
Area: 0.096 square miles
Population: 4,518
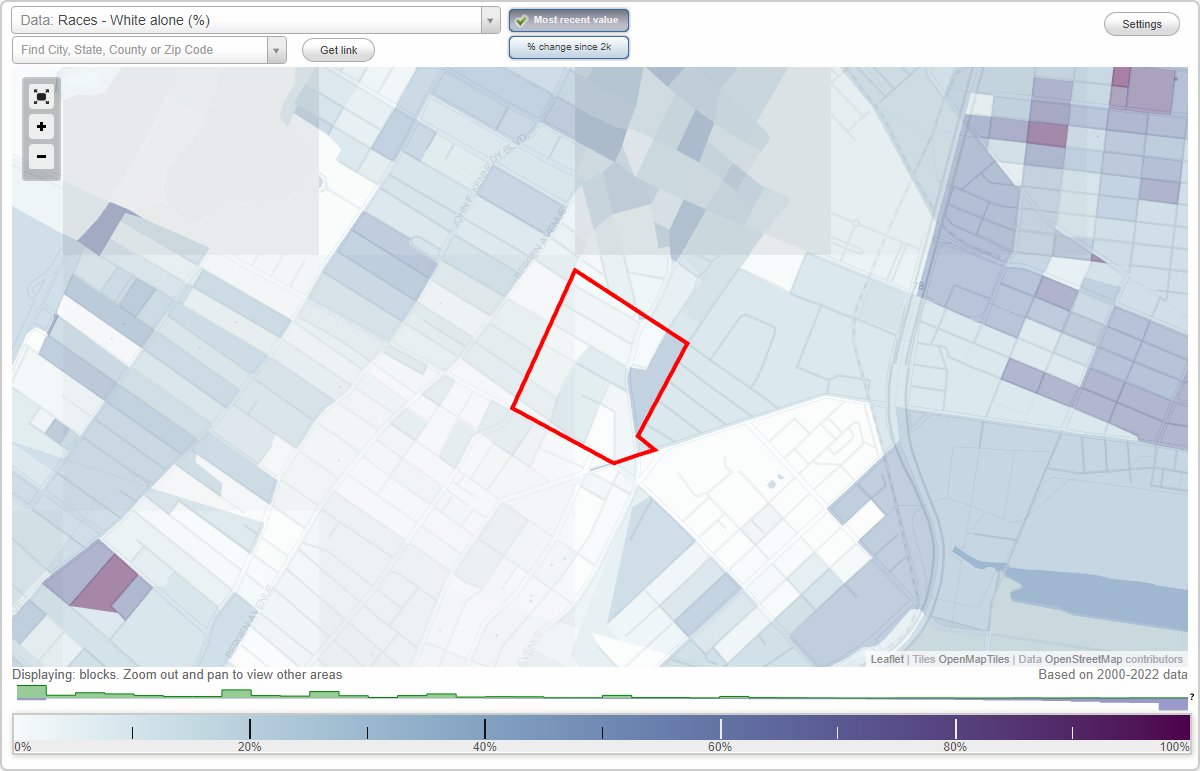
Population density:
| Bergen Hill: | 47,170 people per square mile |
| Jersey City: | 19,218 people per square mile |

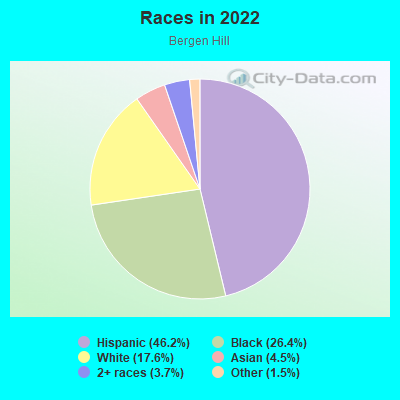
- 2,08546.2%Hispanic or Latino
- 1,19426.4%Black
- 79717.6%White
- 2044.5%Asian
- 1683.7%Two or more races
- 691.5%Some other race
Distribution of median household income
![Distribution of median household income]()
- 168Less than $10,000
- 235$10,000 to $19,999
- 139$20,000 to $29,999
- 34$30,000 to $39,999
- 91$40,000 to $49,999
- 151$50,000 to $59,999
- 107$60,000 to $74,999
- 48$75,000 to $99,999
- 149$100,000 to $124,999
- 101$125,000 to $149,999
- 56$150,000 to $199,999
- 371$200,000 or more

Distribution of owner-occupied house/condo value
![Distribution of owner-occupied house/condo value]()
- 38Less than $50,000
- 20$50,000 to $99,999
- 13$100,000 to $149,999
- 17$150,000 to $199,999
- 25$200,000 to $249,999
- 64$250,000 to $299,999
- 15$300,000 to $399,999
- 122$400,000 to $499,999
- 127$500,000 to $749,999
- 317$750,000 to $999,999
- 17$1,000,000 or more

Distribution of rent paid by renters
![Distribution of rent paid by renters]()
- 121$100 to $199
- 93$200 to $299
- 43$300 to $399
- 176$400 to $499
- 76$500 to $599
- 30$600 to $699
- 64$700 to $799
- 20$800 to $899
- 105$900 to $999
- 181$1,000 to $1,249
- 141$1,250 to $1,499
- 249$1,500 to $1,999
- 158$2,000 or more

Median rent in 2022:
| Bergen Hill: | $1,367 |
| Jersey City: | $1,738 |
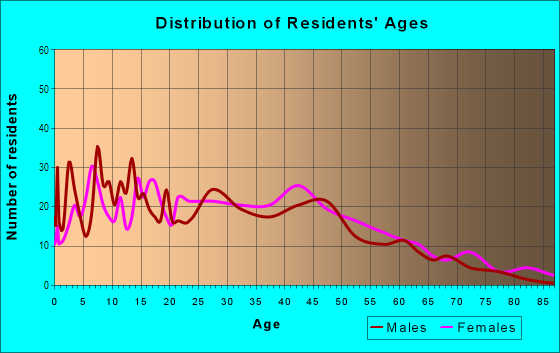
| Males: | 2,165 |
| Females: | 2,353 |
Males:
| This neighborhood: | 38.6 years |
| Whole city: | 34.1 years |
| This neighborhood: | 40.7 years |
| Whole city: | 36.2 years |
Average household size:
| Bergen Hill: | 16.4 people |
| Jersey City: | 2.2 people |
Percentage of family households:
| Bergen Hill: | 44.2% |
| Jersey City: | 39.8% |
| Here: | 40.6% |
| Jersey City: | 34.2% |
Percentage of married-couple families with children (among all households):
| Bergen Hill: | 12.8% |
| Jersey City: | 29.4% |
Percentage of single-mother households (among all households):
| Bergen Hill: | 17.0% |
| Jersey City: | 13.3% |
Percentage of never married males 15 years old and over:
Percentage of never married females 15 years old and over:
| Bergen Hill: | 24.1% |
| Jersey City: | 23.6% |
Percentage of never married females 15 years old and over:
| Bergen Hill: | 20.3% |
| city: | 22.6% |
Percentage of people that speak English not well or not at all:
| Bergen Hill: | 10.5% |
| Jersey City: | 7.2% |
Percentage of people born in this state:
Percentage of people born in another U.S. state:
Percentage of native residents but born outside the U.S.:
Percentage of foreign born residents:
| Here: | 42.9% |
| Jersey City: | 34.5% |
Percentage of people born in another U.S. state:
| Bergen Hill: | 24.8% |
| Jersey City: | 22.1% |
Percentage of native residents but born outside the U.S.:
| Here: | 6.1% |
| city: | 3.8% |
Percentage of foreign born residents:
| Here: | 26.2% |
| Jersey City: | 39.6% |
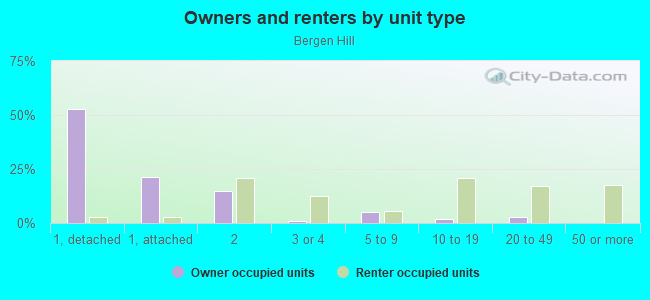
Owner-occupied
Renter-occupied

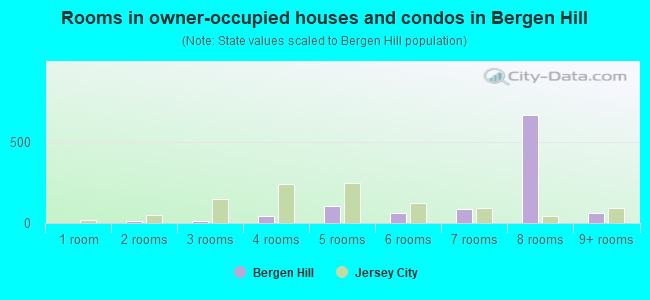
- Rooms in owner-occupied houses and condos in Bergen Hill
- 01 room
- 122 rooms
- 123 rooms
- 414 rooms
- 1045 rooms
- 616 rooms
- 887 rooms
- 6648 rooms
- 649+ rooms
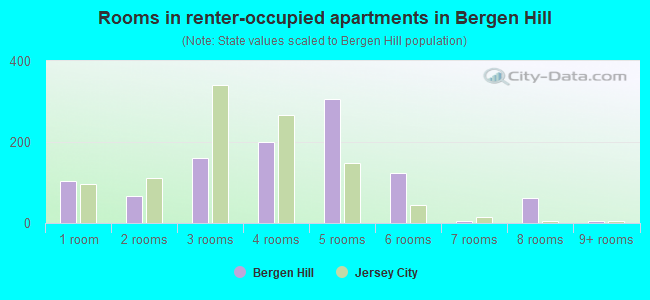
- Rooms in renter-occupied apartments in Bergen Hill
- 1031 room
- 672 rooms
- 1613 rooms
- 2014 rooms
- 3055 rooms
- 1236 rooms
- 67 rooms
- 618 rooms
- 59+ rooms
Owner-occupied
Renter-occupied
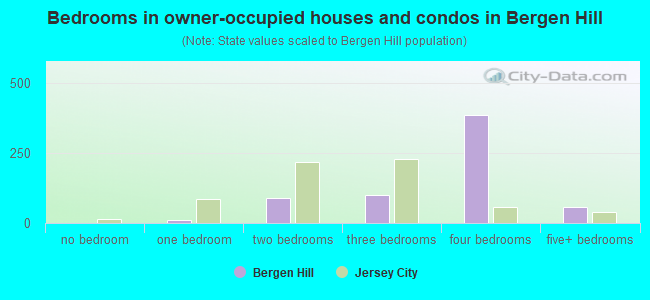
- Bedrooms in owner-occupied houses and condos in Bergen Hill
- 0no bedroom
- 91 bedroom
- 912 bedrooms
- 993 bedrooms
- 3864 bedrooms
- 585+ bedrooms
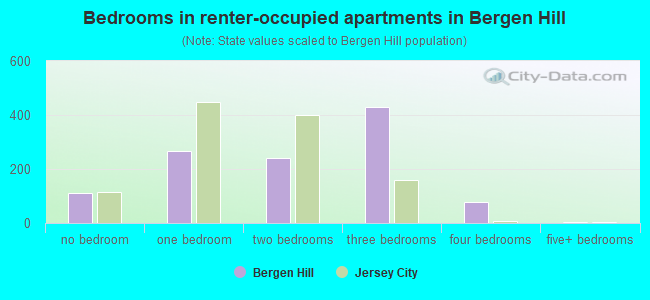
- Bedrooms in renter-occupied apartments in Bergen Hill
- 112no bedroom
- 2671 bedroom
- 2422 bedrooms
- 4313 bedrooms
- 794 bedrooms
- 55+ bedrooms
Average number of cars or other vehicles available in houses/condos:
Average number of cars or other vehicles available in apartments:
| This neighborhood: | 2.0 |
| Jersey City: | 1.3 |
Average number of cars or other vehicles available in apartments:
| Here: | 0.7 |
| city: | 0.6 |
Percentage of units with a mortgage:
| Bergen Hill: | 87.8% |
| Jersey City: | 69.4% |
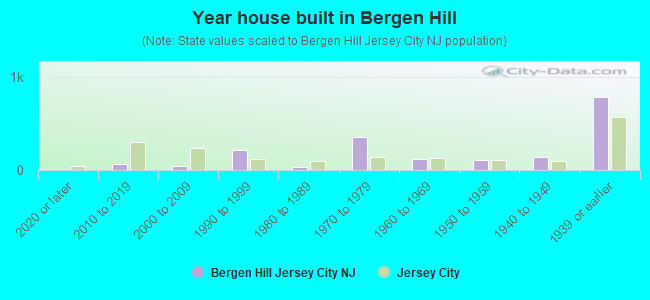
- Year house built in Bergen Hill
- 02020 or later
- 662010 to 2019
- 402000 to 2009
- 2101990 to 1999
- 311980 to 1989
- 3591970 to 1979
- 1231960 to 1969
- 1031950 to 1959
- 1371940 to 1949
- 7821939 or earlier
City-data.com crime index for city in 2020 (higher means more crime):
| City: | 198.8 |
| U.S. average: | 219.5 |
Travel time to work (commute)
![Travel time to work (commute)]()
- 31Less than 5 minutes
- 225 to 9 minutes
- 24310 to 14 minutes
- 13115 to 19 minutes
- 14420 to 24 minutes
- 2325 to 29 minutes
- 22830 to 34 minutes
- 3235 to 39 minutes
- 3340 to 44 minutes
- 31445 to 59 minutes
- 27660 to 89 minutes
- 8490 or more minutes

Means of transportation to work
![Means of transportation to work]()
- 26.9%579Drove a car alone
- 6.7%145Carpooled
- 7.9%171Bus
- 23.4%505Subway or elevated rail
- 1.2%26Long-distance train or commuter rail
- 26.6%572Light rail, streetcar or trolley
- 1.9%40Taxi
- 1.3%29Bicycle
- 19.7%425Walked
- 2.1%45Other means
- 7.7%166Worked at home

Time leaving home to go to work
![Time leaving home to go to work]()
- 4212:00 a.m. to 4:59 a.m.
- 275:00 a.m. to 5:29 a.m.
- 275:30 a.m. to 5:59 a.m.
- 556:00 a.m. to 6:29 a.m.
- 256:30 a.m. to 6:59 a.m.
- 2157:00 a.m. to 7:29 a.m.
- 597:30 a.m. to 7:59 a.m.
- 5168:00 a.m. to 8:29 a.m.
- 428:30 a.m. to 8:59 a.m.
- 1849:00 a.m. to 9:59 a.m.
- 17910:00 a.m. to 10:59 a.m.
- 911:00 a.m. to 11:59 a.m.
- 6812:00 p.m. to 3:59 p.m.
- 654:00 p.m. to 11:59 p.m.

Occupations of males:
- Percentage of males in management occupations (except farmers):
Here: 22.2% city: 12.9%
- Percentage of males in business and financial operations occupations:
Here: 3.9% city: 9.9%
- Percentage of males in computer and mathematical occupations:
Here: 5.1% city: 13.5%
- Percentage of males in education, training, and library occupations:
Here: 1.1% city: 3.6%
- Percentage of males in arts, design, entertainment, sports, and media occupations:
Here: 4.2% city: 3.5%
- Percentage of males in service occupations:
Here: 18.1% city: 10.4%
- Percentage of males in sales and office occupations:
Here: 18.7% city: 13.4%
- Percentage of males in construction, extraction, and maintenance occupations:
Here: 2.9% city: 5.6%
- Percentage of males in transportation occupations:
Here: 2.1% city: 7.2%
- Percentage of males in material moving occupations:
Here: 3.2% city: 4.2%
Occupations of females:
- Percentage of females in management occupations (except farmers):
Here: 2.7% city: 11.5%
- Percentage of females in business and financial operations occupations:
Here: 2.5% city: 11.7%
- Percentage of females in computer and mathematical occupations:
Here: 7.4% city: 5.3%
- Percentage of females in legal occupations:
Here: 2.8% city: 2.6%
- Percentage of females in education, training, and library occupations:
Here: 31.7% city: 8.3%
- Percentage of females in arts, design, entertainment, sports, and media occupations:
Here: 3.0% city: 4.9%
- Percentage of females in healthcare practitioners and technical occupations:
Here: 1.2% city: 6.5%
- Percentage of females in service occupations:
Here: 24.1% city: 17.9%
- Percentage of females in sales and office occupations:
Here: 17.0% city: 21.2%
- Percentage of females in production occupations:
Here: 2.1% city: 2.7%
- Percentage of females in transportation occupations:
Here: 3.3% city: 0.7%
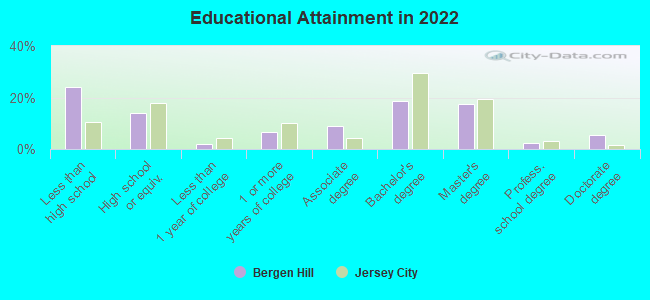
Education in this neighborhood (subdivision or community):
- Percentage of people 3 years and older in K-12 schools:
Bergen Hill: 25.5% Jersey City: 12.9%
- Percentage of people 3 years and older in undergraduate colleges:
Bergen Hill: 7.9% Jersey City: 4.5%
- Percentage of people 3 years and older in grad. or professional schools:
Bergen Hill: 3.6% Jersey City: 2.2%
- Percentage of students K-12 enrolled in private schools:
Bergen Hill: 4.2% Jersey City: 10.8%
Percentage of population below poverty level:
| Bergen Hill: | 25.1% |
| Jersey City: | 12.8% |
Median year owner moved in (as recorded in 2022):
Median year renter moved in (as recorded in 2022):
| Bergen Hill: | 2004 |
| Jersey City: | 2010 |
Median year renter moved in (as recorded in 2022):
| Bergen Hill: | 2017 |
| Jersey City: | 2019 |
Percentage of married-couple families with both working:
| Bergen Hill: | 65.2% |
| Jersey City: | 63.9% |
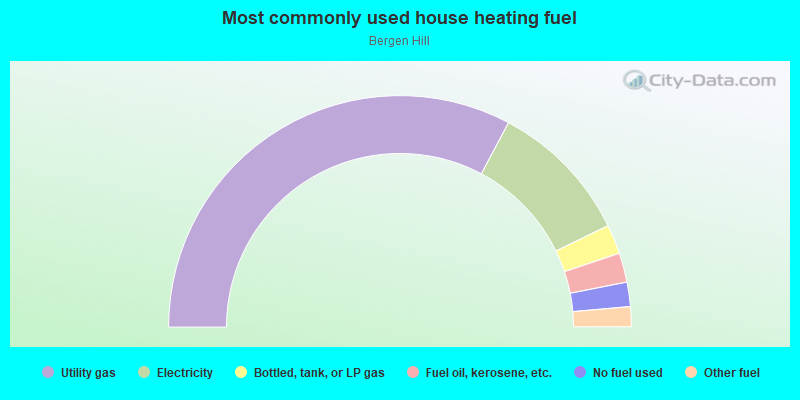
- 65.5%Utility gas
- 20.0%Electricity
- 4.1%Bottled, tank, or LP gas
- 4.1%Fuel oil, kerosene, etc.
- 3.4%No fuel used
- 2.8%Other fuel
Roads and streets:
Co Rd 617 (Summit Ave)
Length: 0.33 miles
Directions: N-S, SW-NE
Address range: 12 to 143
Directions: N-S, SW-NE
Address range: 12 to 143
Co Rd 619 (Cornelison Ave)
Length: 0.26 miles
Direction: SW-NE
Address range: 1 to 98
Direction: SW-NE
Address range: 1 to 98
Crescent Ave
Length: 0.21 miles
Directions: N-S, SW-NE
Address range: 35 to 126
Directions: N-S, SW-NE
Address range: 35 to 126
Fairmount Ave
Length: 0.17 miles
Direction: SE-NW
Address range: 113 to 164
Direction: SE-NW
Address range: 113 to 164
Astor Pl (Co Rd 715)
Length: 0.17 miles
Directions: E-W, SE-NW
Address range: 1 to 90
Directions: E-W, SE-NW
Address range: 1 to 90
Co Rd 715 (Park St)
Length: 0.16 miles
Direction: SW-NE
Address range: 1 to 84
Direction: SW-NE
Address range: 1 to 84
Clifton Pl
Length: 0.15 miles
Directions: E-W, SW-NE
Address range: 2 to 55
Directions: E-W, SW-NE
Address range: 2 to 55
Belmont Ave
Length: 0.13 miles
Direction: SE-NW
Address range: 1 to 43
Direction: SE-NW
Address range: 1 to 43
Harrison Ave
Length: 0.11 miles
Directions: E-W, SE-NW
Address range: 1 to 35
Directions: E-W, SE-NW
Address range: 1 to 35
Ivy Pl
Length: 0.06 miles
Direction: SE-NW
Address range: 1 to 32
Direction: SE-NW
Address range: 1 to 32
Grand St (Co Rd 622)
Length: 0.05 miles
Direction: E-W
Address range: 711 to 732
Direction: E-W
Address range: 711 to 732
Prescott St
Length: 0.05 miles
Direction: E-W
Address range: 70 to 102
Direction: E-W
Address range: 70 to 102
Jewett Ave
Length: 0.04 miles
Direction: SE-NW
Address range: 1 to 15
Direction: SE-NW
Address range: 1 to 15
Storms Ave (Co Rd 623)
Length: 0.03 miles
Direction: N-S
Address range: 1 to 9
Direction: N-S
Address range: 1 to 9
Co Rd 619
Length: 0.00 miles
Direction: SW-NE
Direction: SW-NE