Belmont Shore neighborhood in Long Beach, California (CA), 90803 detailed profile
Settings
X


Business Search - 14 Million verified businesses
Area: 0.427 square miles
Population: 7,164
Population density:
| Belmont Shore: | 16,763 people per square mile |
| Long Beach: | 8,948 people per square mile |

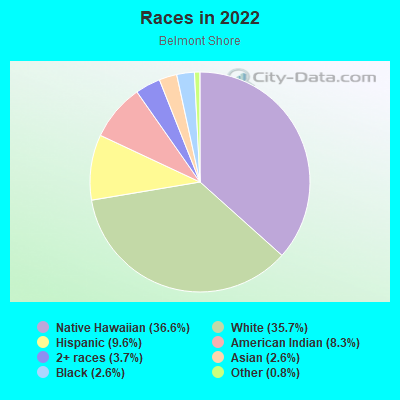
- 4,63136.6%Native Hawaiian and Other
Pacific Islander - 4,52335.7%White
- 1,2219.6%Hispanic or Latino
- 1,0538.3%American Indian
- 4703.7%Two or more races
- 3242.6%Black
- 3352.6%Asian
- 1070.8%Some other race
- 4,63136.6%Native Hawaiian and Other
Median household income in 2022:
| Belmont Shore: | $106,392 |
| Long Beach: | $80,493 |
Distribution of median household income
![Distribution of median household income]()
- 187Less than $10,000
- 465$10,000 to $19,999
- 255$20,000 to $29,999
- 390$30,000 to $39,999
- 334$40,000 to $49,999
- 435$50,000 to $59,999
- 327$60,000 to $74,999
- 733$75,000 to $99,999
- 505$100,000 to $124,999
- 727$125,000 to $149,999
- 498$150,000 to $199,999
- 538$200,000 or more

Distribution of owner-occupied house/condo value
![Distribution of owner-occupied house/condo value]()
- 22Less than $50,000
- 102$300,000 to $399,999
- 169$400,000 to $499,999
- 175$500,000 to $749,999
- 153$750,000 to $999,999
- 981$1,000,000 or more

Distribution of rent paid by renters
![Distribution of rent paid by renters]()
- 116$700 to $799
- 97$800 to $899
- 5$900 to $999
- 349$1,000 to $1,249
- 507$1,250 to $1,499
- 1,216$1,500 to $1,999
- 1,688$2,000 or more

Median rent in 2022:
| Belmont Shore: | $1,933 |
| Long Beach: | $1,643 |
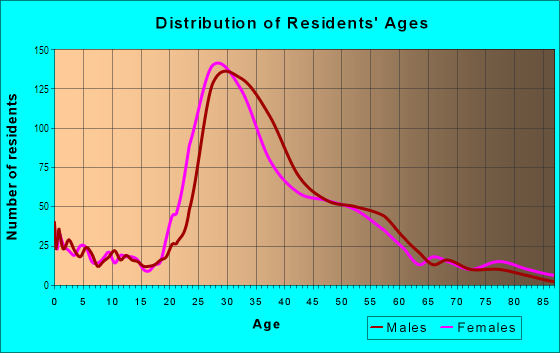
| Males: | 3,781 |
| Females: | 3,382 |
Males:
| This neighborhood: | 43.1 years |
| Whole city: | 35.5 years |
| This neighborhood: | 40.3 years |
| Whole city: | 37.7 years |
Average household size:
| Belmont Shore: | 1.7 people |
| Long Beach: | 2.6 people |
Percentage of family households:
| Belmont Shore: | 30.5% |
| Long Beach: | 43.1% |
| Here: | 27.8% |
| Long Beach: | 35.6% |
Percentage of married-couple families with children (among all households):
| Belmont Shore: | 40.8% |
| Long Beach: | 21.4% |
Percentage of single-mother households (among all households):
| Belmont Shore: | 21.9% |
| Long Beach: | 12.6% |
Percentage of never married males 15 years old and over:
Percentage of never married females 15 years old and over:
| Belmont Shore: | 29.2% |
| Long Beach: | 24.6% |
Percentage of never married females 15 years old and over:
| Belmont Shore: | 22.3% |
| city: | 23.9% |
Percentage of people that speak English not well or not at all:
| Belmont Shore: | 0.2% |
| Long Beach: | 7.4% |
Percentage of people born in this state:
Percentage of people born in another U.S. state:
Percentage of native residents but born outside the U.S.:
Percentage of foreign born residents:
| Here: | 63.3% |
| Long Beach: | 62.4% |
Percentage of people born in another U.S. state:
| Belmont Shore: | 25.4% |
| Long Beach: | 12.5% |
Percentage of native residents but born outside the U.S.:
| Here: | 4.7% |
| city: | 1.4% |
Percentage of foreign born residents:
| Here: | 9.5% |
| Long Beach: | 23.7% |
Owner-occupied
Renter-occupied

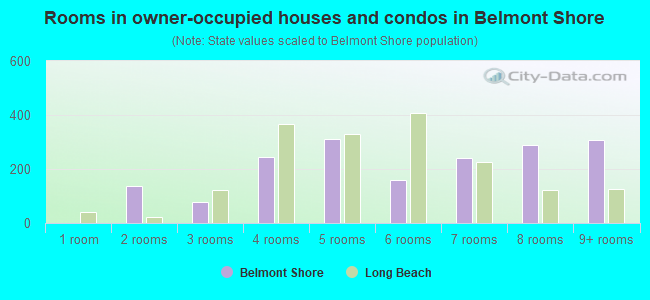
- Rooms in owner-occupied houses and condos in Belmont Shore
- 01 room
- 1382 rooms
- 793 rooms
- 2434 rooms
- 3105 rooms
- 1586 rooms
- 2407 rooms
- 2908 rooms
- 3089+ rooms
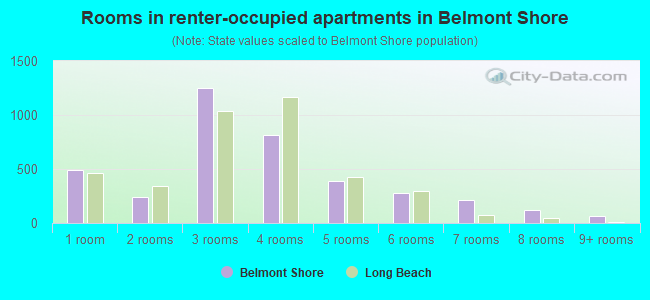
- Rooms in renter-occupied apartments in Belmont Shore
- 4911 room
- 2382 rooms
- 1,2513 rooms
- 8194 rooms
- 3865 rooms
- 2756 rooms
- 2127 rooms
- 1218 rooms
- 649+ rooms
Owner-occupied
Renter-occupied
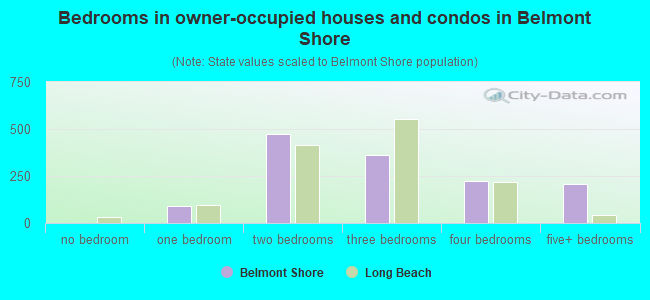
- Bedrooms in owner-occupied houses and condos in Belmont Shore
- 0no bedroom
- 901 bedroom
- 4762 bedrooms
- 3633 bedrooms
- 2244 bedrooms
- 2105+ bedrooms
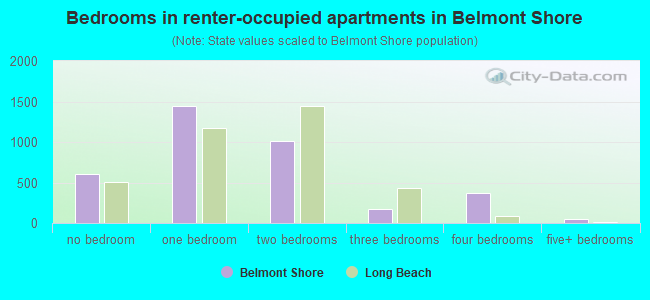
- Bedrooms in renter-occupied apartments in Belmont Shore
- 607no bedroom
- 1,4431 bedroom
- 1,0172 bedrooms
- 1703 bedrooms
- 3724 bedrooms
- 535+ bedrooms
Average number of cars or other vehicles available in houses/condos:
Average number of cars or other vehicles available in apartments:
| This neighborhood: | 1.8 |
| Long Beach: | 2.1 |
Average number of cars or other vehicles available in apartments:
| Here: | 1.3 |
| city: | 1.4 |
Percentage of units with a mortgage:
| Belmont Shore: | 68.8% |
| Long Beach: | 70.2% |
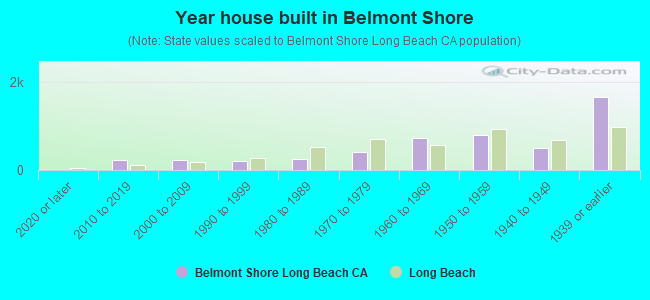
- Year house built in Belmont Shore
- 02020 or later
- 2312010 to 2019
- 2222000 to 2009
- 1991990 to 1999
- 2411980 to 1989
- 3991970 to 1979
- 7181960 to 1969
- 8051950 to 1959
- 4911940 to 1949
- 1,6481939 or earlier

City-data.com crime index for city in 2020 (higher means more crime):
| City: | 312.7 |
| U.S. average: | 219.5 |
Travel time to work (commute)
![Travel time to work (commute)]()
- 56Less than 5 minutes
- 1375 to 9 minutes
- 32710 to 14 minutes
- 34715 to 19 minutes
- 57320 to 24 minutes
- 18025 to 29 minutes
- 59530 to 34 minutes
- 22235 to 39 minutes
- 32340 to 44 minutes
- 25145 to 59 minutes
- 37160 to 89 minutes
- 16890 or more minutes

Means of transportation to work
![Means of transportation to work]()
- 78.0%3,830Drove a car alone
- 4.0%197Carpooled
- 2.4%119Bus
- 0.1%5Taxi
- 0.1%7Motorcycle
- 2.8%139Bicycle
- 2.3%113Walked
- 10.3%505Other means
- 15.7%770Worked at home

Time leaving home to go to work
![Time leaving home to go to work]()
- 13312:00 a.m. to 4:59 a.m.
- 935:00 a.m. to 5:29 a.m.
- 1355:30 a.m. to 5:59 a.m.
- 3496:00 a.m. to 6:29 a.m.
- 2596:30 a.m. to 6:59 a.m.
- 5437:00 a.m. to 7:29 a.m.
- 3737:30 a.m. to 7:59 a.m.
- 7448:00 a.m. to 8:29 a.m.
- 1078:30 a.m. to 8:59 a.m.
- 2819:00 a.m. to 9:59 a.m.
- 16410:00 a.m. to 10:59 a.m.
- 6711:00 a.m. to 11:59 a.m.
- 7812:00 p.m. to 3:59 p.m.
- 1474:00 p.m. to 11:59 p.m.

Occupations of males:
- Percentage of males in management occupations (except farmers):
Here: 18.2% city: 10.3%
- Percentage of males in business and financial operations occupations:
Here: 14.7% city: 5.1%
- Percentage of males in computer and mathematical occupations:
Here: 9.0% city: 4.1%
- Percentage of males in architecture and engineering occupations:
Here: 4.3% city: 3.2%
- Percentage of males in life, physical, and social science occupations:
Here: 3.6% city: 1.0%
- Percentage of males in education, training, and library occupations:
Here: 2.5% city: 3.8%
- Percentage of males in arts, design, entertainment, sports, and media occupations:
Here: 6.6% city: 4.0%
- Percentage of males in healthcare practitioners and technical occupations:
Here: 2.8% city: 3.0%
- Percentage of males in service occupations:
Here: 6.5% city: 16.3%
- Percentage of males in sales and office occupations:
Here: 7.2% city: 15.7%
- Percentage of males in construction, extraction, and maintenance occupations:
Here: 5.6% city: 7.8%
- Percentage of males in production occupations:
Here: 1.3% city: 6.4%
- Percentage of males in transportation occupations:
Here: 11.6% city: 6.8%
- Percentage of males in material moving occupations:
Here: 3.5% city: 5.9%
Occupations of females:
- Percentage of females in management occupations (except farmers):
Here: 12.8% city: 9.5%
- Percentage of females in business and financial operations occupations:
Here: 6.4% city: 6.5%
- Percentage of females in architecture and engineering occupations:
Here: 1.1% city: 1.0%
- Percentage of females in life, physical, and social science occupations:
Here: 3.0% city: 1.0%
- Percentage of females in community and social services occupations:
Here: 2.7% city: 3.3%
- Percentage of females in education, training, and library occupations:
Here: 11.2% city: 8.3%
- Percentage of females in arts, design, entertainment, sports, and media occupations:
Here: 6.0% city: 3.2%
- Percentage of females in healthcare practitioners and technical occupations:
Here: 6.7% city: 7.4%
- Percentage of females in service occupations:
Here: 4.7% city: 21.6%
- Percentage of females in sales and office occupations:
Here: 40.4% city: 27.8%
- Percentage of females in farming, fishing, and forestry occupations:
Here: 1.5% city: 0.2%
- Percentage of females in material moving occupations:
Here: 2.3% city: 2.5%
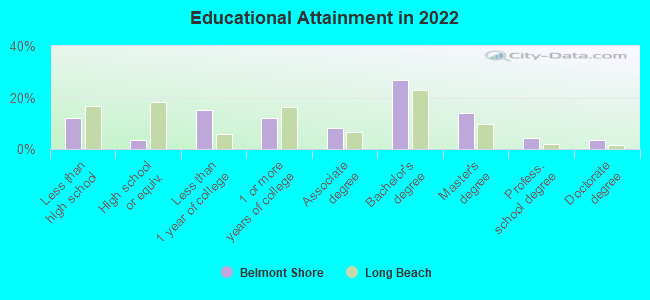
Education in this neighborhood (subdivision or community):
- Percentage of people 3 years and older in K-12 schools:
Belmont Shore: 23.6% Long Beach: 15.8%
- Percentage of people 3 years and older in undergraduate colleges:
Belmont Shore: 5.6% Long Beach: 7.2%
- Percentage of people 3 years and older in grad. or professional schools:
Belmont Shore: 5.8% Long Beach: 1.4%
- Percentage of students K-12 enrolled in private schools:
Belmont Shore: 50.3% Long Beach: 4.5%
Percentage of population below poverty level:
| Belmont Shore: | 5.8% |
| Long Beach: | 13.8% |
Median year owner moved in (as recorded in 2022):
Median year renter moved in (as recorded in 2022):
| Belmont Shore: | 2003 |
| Long Beach: | 2007 |
Median year renter moved in (as recorded in 2022):
| Belmont Shore: | 2016 |
| Long Beach: | 2018 |
Percentage of married-couple families with both working:
| Belmont Shore: | 108.6% |
| Long Beach: | 68.2% |
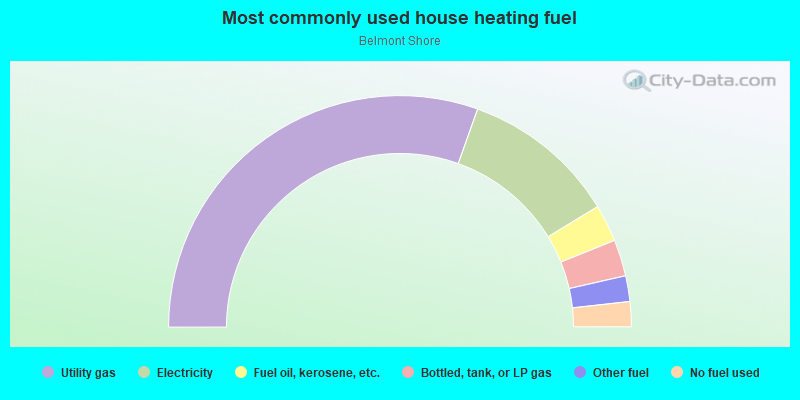
- 60.9%Utility gas
- 21.7%Electricity
- 5.2%Fuel oil, kerosene, etc.
- 5.1%Bottled, tank, or LP gas
- 3.6%Other fuel
- 3.5%No fuel used
Roads and streets:
E Ocean Blvd
Length: 1.02 miles
Directions: E-W, SE-NW
Address range: 3900 to 5349
Directions: E-W, SE-NW
Address range: 3900 to 5349
E 1st St
Length: 0.95 miles
Directions: E-W, SE-NW
Address range: 4034 to 5373
Directions: E-W, SE-NW
Address range: 4034 to 5373
E Livingston Dr
Length: 0.90 miles
Direction: E-W
Address range: 3900 to 5114
Direction: E-W
Address range: 3900 to 5114
E Division St
Length: 0.80 miles
Directions: E-W, SE-NW
Address range: 4300 to 5399
Directions: E-W, SE-NW
Address range: 4300 to 5399
Corona Ave
Length: 0.70 miles
Direction: SW-NE
Address range: 1 to 278
Direction: SW-NE
Address range: 1 to 278
Covina Ave
Length: 0.70 miles
Direction: SW-NE
Address range: 1 to 279
Direction: SW-NE
Address range: 1 to 279
E 2nd St
Length: 0.69 miles
Direction: SE-NW
Address range: 4600 to 5395
Direction: SE-NW
Address range: 4600 to 5395
Laverne Ave
Length: 0.68 miles
Direction: SW-NE
Address range: 1 to 279
Direction: SW-NE
Address range: 1 to 279
Glendora Ave
Length: 0.67 miles
Direction: SW-NE
Address range: 1 to 279
Direction: SW-NE
Address range: 1 to 279
Pomona Ave
Length: 0.64 miles
Direction: SW-NE
Address range: 2 to 269
Direction: SW-NE
Address range: 2 to 269
Santa Ana Ave
Length: 0.61 miles
Direction: SW-NE
Address range: 1 to 275
Direction: SW-NE
Address range: 1 to 275
Granada Ave
Length: 0.58 miles
Direction: SW-NE
Address range: 1 to 255
Direction: SW-NE
Address range: 1 to 255
Nieto Ave
Length: 0.58 miles
Direction: SW-NE
Address range: 1 to 252
Direction: SW-NE
Address range: 1 to 252
Argonne Ave
Length: 0.57 miles
Direction: SW-NE
Address range: 1 to 242
Direction: SW-NE
Address range: 1 to 242
Saint Joseph Ave
Length: 0.54 miles
Directions: N-S, SW-NE
Address range: 1 to 232
Directions: N-S, SW-NE
Address range: 1 to 232
The Toledo
Length: 0.51 miles
Directions: N-S, SE-NW
Address range: 5050 to 5399
Directions: N-S, SE-NW
Address range: 5050 to 5399
Park Ave
Length: 0.47 miles
Directions: N-S, SW-NE
Address range: 1 to 220
Directions: N-S, SW-NE
Address range: 1 to 220
Claremont Ave
Length: 0.45 miles
Direction: SW-NE
Address range: 100 to 266
Direction: SW-NE
Address range: 100 to 266
Roycroft Ave
Length: 0.42 miles
Direction: SW-NE
Address range: 1 to 199
Direction: SW-NE
Address range: 1 to 199
E Broadway
Length: 0.40 miles
Directions: N-S, SE-NW
Address range: 5201 to 5399
Directions: N-S, SE-NW
Address range: 5201 to 5399
Quincy Ave
Length: 0.37 miles
Direction: SW-NE
Address range: 1 to 199
Direction: SW-NE
Address range: 1 to 199
Bay Shore Ave
Length: 0.31 miles
Direction: SW-NE
Address range: 137 to 258
Direction: SW-NE
Address range: 137 to 258
Prospect Ave
Length: 0.31 miles
Direction: SW-NE
Address range: 1 to 198
Direction: SW-NE
Address range: 1 to 198
Ximeno Ave
Length: 0.26 miles
Direction: SW-NE
Address range: 1 to 178
Direction: SW-NE
Address range: 1 to 178
Bennett Ave
Length: 0.21 miles
Direction: SW-NE
Address range: 1 to 140
Direction: SW-NE
Address range: 1 to 140
Roswell Ave
Length: 0.16 miles
Direction: SW-NE
Address range: 1 to 199
Direction: SW-NE
Address range: 1 to 199
Belmont Ave
Length: 0.12 miles
Directions: SE-NW, SW-NE
Address range: 1 to 97
Directions: SE-NW, SW-NE
Address range: 1 to 97
N Termino Ave
Length: 0.06 miles
Direction: N-S
Address range: 1 to 49
Direction: N-S
Address range: 1 to 49
E Shaw St
Length: 0.05 miles
Direction: E-W
Address range: 4900 to 4999
Direction: E-W
Address range: 4900 to 4999
E Division St (N Grand Ave)
Length: 0.05 miles
Direction: SE-NW
Address range: 5300 to 5323
Direction: SE-NW
Address range: 5300 to 5323