Belmont neighborhood in Midland, Texas (TX), 79701 detailed profile
Settings
X


Business Search - 14 Million verified businesses
Area: 0.289 square miles
Population: 269
Population density:
| Belmont: | 929 people per square mile |
| Midland: | 2,018 people per square mile |

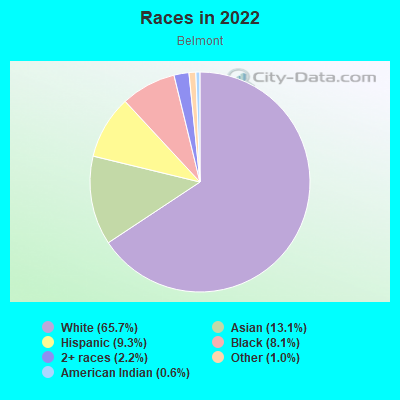
- 20451.0%Hispanic or Latino
- 8320.8%Black
- 379.2%American Indian
- 358.8%White
- 276.8%Asian
- 143.5%Two or more races
Distribution of median household income
![Distribution of median household income]()
- 12Less than $10,000
- 90$10,000 to $19,999
- 71$20,000 to $29,999
- 9$30,000 to $39,999
- 29$40,000 to $49,999
- 8$50,000 to $59,999
- 13$60,000 to $74,999
- 11$75,000 to $99,999
- 6$100,000 to $124,999
- 10$125,000 to $149,999
- 63$150,000 to $199,999

Distribution of owner-occupied house/condo value
![Distribution of owner-occupied house/condo value]()
- 96Less than $50,000
- 112$50,000 to $99,999
- 21$100,000 to $149,999
- 12$150,000 to $199,999
- 10$200,000 to $249,999
- 34$250,000 to $299,999
- 26$300,000 to $399,999
- 3$400,000 to $499,999

Distribution of rent paid by renters
![Distribution of rent paid by renters]()
- 39$300 to $399
- 4$400 to $499
- 3$500 to $599
- 4$600 to $699
- 8$700 to $799
- 6$800 to $899
- 40$900 to $999
- 134$1,000 to $1,249
- 6$1,250 to $1,499
- 30$1,500 to $1,999

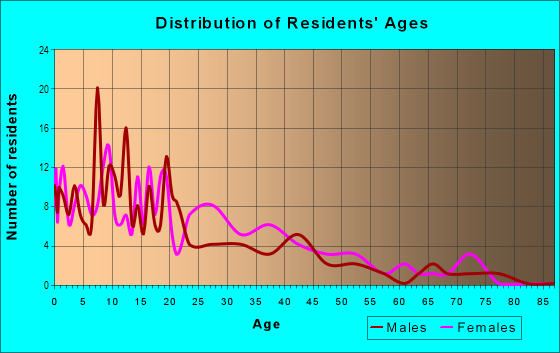
| Males: | 146 |
| Females: | 123 |
Males:
| This neighborhood: | 30.0 years |
| Whole city: | 32.3 years |
| This neighborhood: | 35.1 years |
| Whole city: | 33.3 years |
Average household size:
| Belmont: | 3.0 people |
| Midland: | 2.4 people |
Percentage of family households:
| Belmont: | 44.0% |
| Midland: | 52.0% |
| Here: | 53.4% |
| Midland: | 46.4% |
Percentage of married-couple families with children (among all households):
| Belmont: | 16.9% |
| Midland: | 30.9% |
Percentage of single-mother households (among all households):
| Belmont: | 9.7% |
| Midland: | 8.1% |
Percentage of never married males 15 years old and over:
Percentage of never married females 15 years old and over:
| Belmont: | 28.0% |
| Midland: | 15.2% |
Percentage of never married females 15 years old and over:
| Belmont: | 14.3% |
| city: | 14.9% |
Percentage of people that speak English not well or not at all:
| Belmont: | 12.1% |
| Midland: | 5.7% |
Percentage of people born in this state:
Percentage of people born in another U.S. state:
Percentage of native residents but born outside the U.S.:
Percentage of foreign born residents:
| Here: | 63.9% |
| Midland: | 69.5% |
Percentage of people born in another U.S. state:
| Belmont: | 10.7% |
| Midland: | 18.2% |
Percentage of native residents but born outside the U.S.:
| Here: | 0.0% |
| city: | 1.2% |
Percentage of foreign born residents:
| Here: | 25.4% |
| Midland: | 11.2% |
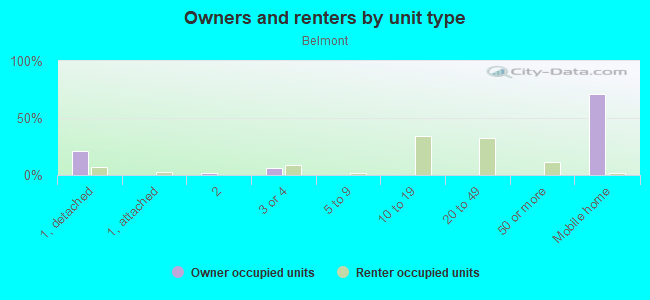
Owner-occupied
Renter-occupied

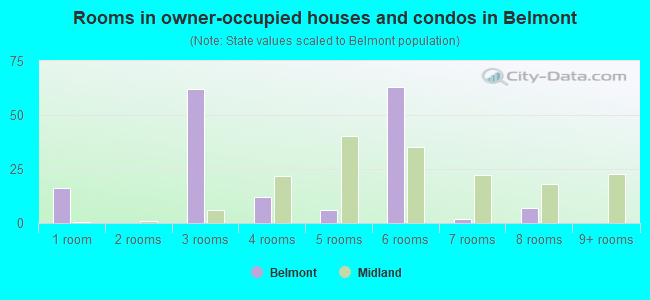
- Rooms in owner-occupied houses and condos in Belmont
- 161 room
- 02 rooms
- 623 rooms
- 124 rooms
- 65 rooms
- 636 rooms
- 27 rooms
- 78 rooms
- 09+ rooms
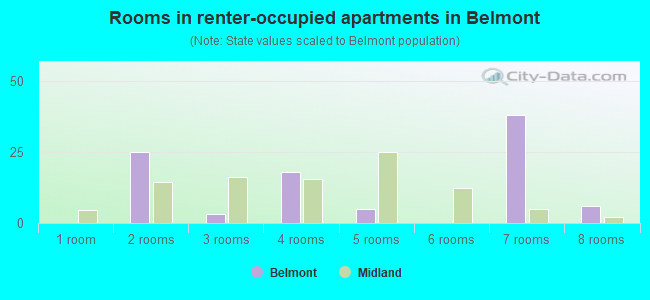
- Rooms in renter-occupied apartments in Belmont
- 01 room
- 252 rooms
- 33 rooms
- 184 rooms
- 55 rooms
- 06 rooms
- 387 rooms
- 68 rooms
- 09+ rooms
Owner-occupied
Renter-occupied
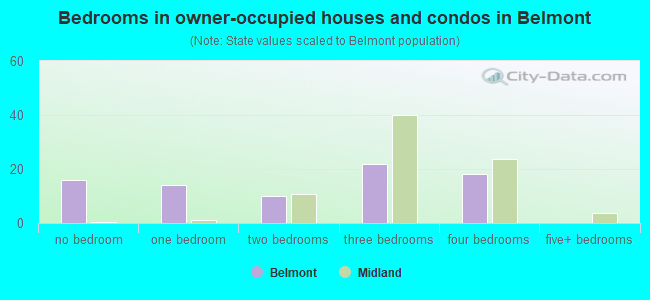
- Bedrooms in owner-occupied houses and condos in Belmont
- 16no bedroom
- 141 bedroom
- 102 bedrooms
- 223 bedrooms
- 184 bedrooms
- 05+ bedrooms
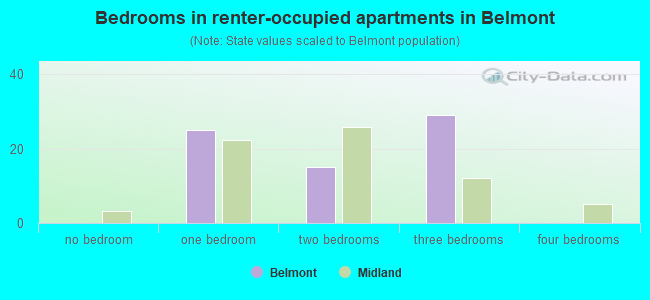
- Bedrooms in renter-occupied apartments in Belmont
- 0no bedroom
- 251 bedroom
- 152 bedrooms
- 293 bedrooms
- 04 bedrooms
- 05+ bedrooms
Average number of cars or other vehicles available in houses/condos:
Average number of cars or other vehicles available in apartments:
| This neighborhood: | 1.5 |
| Midland: | 2.1 |
Average number of cars or other vehicles available in apartments:
| Here: | 0.8 |
| city: | 1.4 |
Percentage of units with a mortgage:
| Belmont: | 8.9% |
| Midland: | 58.2% |
Average estimated value of detached houses in 2022 (77.0% of all units):
| Belmont: | $147,649 |
| Texas: | $369,058 |
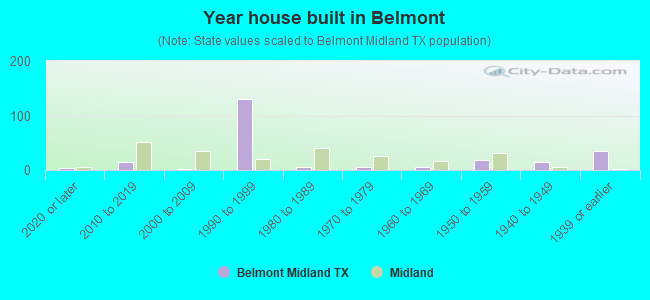
- Year house built in Belmont
- 32020 or later
- 142010 to 2019
- 22000 to 2009
- 1301990 to 1999
- 61980 to 1989
- 61970 to 1979
- 51960 to 1969
- 181950 to 1959
- 151940 to 1949
- 341939 or earlier
City-data.com crime index for city in 2020 (higher means more crime):
| City: | 223.8 |
| U.S. average: | 219.5 |
Travel time to work (commute)
![Travel time to work (commute)]()
- 4Less than 5 minutes
- 285 to 9 minutes
- 6110 to 14 minutes
- 5715 to 19 minutes
- 5220 to 24 minutes
- 125 to 29 minutes
- 2930 to 34 minutes
- 345 to 59 minutes
- 1190 or more minutes

Means of transportation to work
![Means of transportation to work]()
- 60.8%50Drove a car alone
- 32.8%27Carpooled
- 2.4%2Motorcycle
- 3.6%3Walked
- 2.4%2Worked at home

Time leaving home to go to work
![Time leaving home to go to work]()
- 1012:00 a.m. to 4:59 a.m.
- 325:00 a.m. to 5:29 a.m.
- 65:30 a.m. to 5:59 a.m.
- 76:00 a.m. to 6:29 a.m.
- 116:30 a.m. to 6:59 a.m.
- 557:00 a.m. to 7:29 a.m.
- 327:30 a.m. to 7:59 a.m.
- 468:00 a.m. to 8:29 a.m.
- 28:30 a.m. to 8:59 a.m.
- 89:00 a.m. to 9:59 a.m.
- 410:00 a.m. to 10:59 a.m.
- 611:00 a.m. to 11:59 a.m.
- 2212:00 p.m. to 3:59 p.m.
- 44:00 p.m. to 11:59 p.m.

Occupations of males:
- Percentage of males in management occupations (except farmers):
Here: 7.3% city: 14.6%
- Percentage of males in business and financial operations occupations:
Here: 6.5% city: 3.8%
- Percentage of males in life, physical, and social science occupations:
Here: 6.9% city: 1.9%
- Percentage of males in education, training, and library occupations:
Here: 13.4% city: 2.5%
- Percentage of males in service occupations:
Here: 10.3% city: 9.5%
- Percentage of males in sales and office occupations:
Here: 6.8% city: 14.8%
- Percentage of males in construction, extraction, and maintenance occupations:
Here: 3.9% city: 15.1%
- Percentage of males in production occupations:
Here: 21.1% city: 7.5%
- Percentage of males in transportation occupations:
Here: 6.8% city: 5.1%
- Percentage of males in material moving occupations:
Here: 11.2% city: 4.8%
Occupations of females:
- Percentage of females in management occupations (except farmers):
Here: 3.7% city: 11.6%
- Percentage of females in computer and mathematical occupations:
Here: 7.3% city: 1.4%
- Percentage of females in education, training, and library occupations:
Here: 6.3% city: 11.2%
- Percentage of females in arts, design, entertainment, sports, and media occupations:
Here: 7.3% city: 1.7%
- Percentage of females in service occupations:
Here: 46.2% city: 16.8%
- Percentage of females in sales and office occupations:
Here: 26.7% city: 33.2%
- Percentage of females in production occupations:
Here: 16.3% city: 2.0%
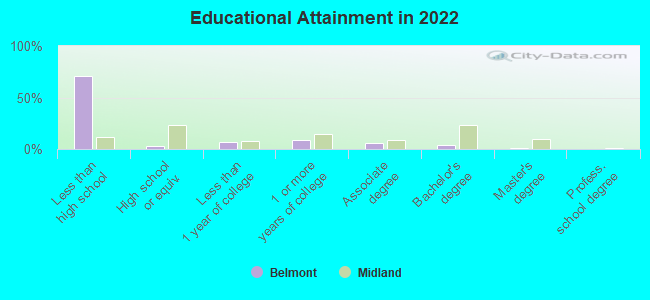
Education in this neighborhood (subdivision or community):
- Percentage of people 3 years and older in K-12 schools:
Belmont: 18.0% Midland: 22.4%
- Percentage of people 3 years and older in undergraduate colleges:
Belmont: 4.5% Midland: 3.0%
- Percentage of people 3 years and older in grad. or professional schools:
Belmont: 3.8% Midland: 1.8%
- Percentage of students K-12 enrolled in private schools:
Belmont: 208.3% Midland: 16.2%
Percentage of population below poverty level:
| Belmont: | 21.6% |
| Midland: | 11.7% |
Median year owner moved in (as recorded in 2022):
| Belmont: | 2004 |
| Midland: | 2015 |
Percentage of married-couple families with both working:
| Belmont: | 75.3% |
| Midland: | 63.2% |
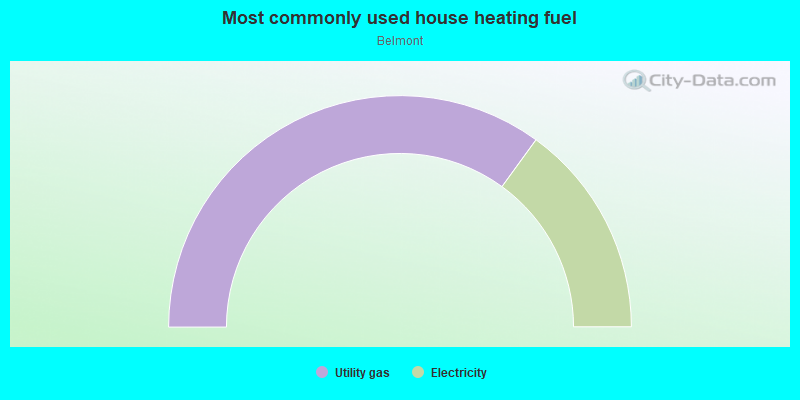
- 70.0%Utility gas
- 30.0%Electricity
Roads and streets:
S Belmont St
Length: 0.75 miles
Direction: N-S
Address range: 1300 to 2399
Direction: N-S
Address range: 1300 to 2399
S Main St
Length: 0.75 miles
Directions: N-S, SE-NW
Address range: 1300 to 2399
Directions: N-S, SE-NW
Address range: 1300 to 2399
S Colorado St
Length: 0.75 miles
Directions: N-S, SE-NW
Address range: 1300 to 2399
Directions: N-S, SE-NW
Address range: 1300 to 2399
S Loraine St
Length: 0.48 miles
Direction: N-S
Address range: 1200 to 1899
Direction: N-S
Address range: 1200 to 1899
W Summit Ave
Length: 0.29 miles
Direction: E-W
Address range: 100 to 399
Direction: E-W
Address range: 100 to 399
Loraine St
Length: 0.27 miles
Direction: N-S
Address range: 2300 to 2399
Direction: N-S
Address range: 2300 to 2399
W Longview Ave
Length: 0.24 miles
Direction: E-W
Address range: 200 to 399
Direction: E-W
Address range: 200 to 399
W Gist Ave
Length: 0.24 miles
Direction: E-W
Address range: 100 to 399
Direction: E-W
Address range: 100 to 399
W Griffin Ave
Length: 0.24 miles
Direction: E-W
Address range: 100 to 399
Direction: E-W
Address range: 100 to 399
W Wolcott Ave
Length: 0.24 miles
Direction: E-W
Address range: 100 to 399
Direction: E-W
Address range: 100 to 399
W Hicks Ave
Length: 0.24 miles
Direction: E-W
Address range: 100 to 399
Direction: E-W
Address range: 100 to 399
W Taylor Ave
Length: 0.24 miles
Direction: E-W
Address range: 100 to 399
Direction: E-W
Address range: 100 to 399
W Francis Ave
Length: 0.24 miles
Direction: E-W
Address range: 100 to 399
Direction: E-W
Address range: 100 to 399
W Stokes Ave
Length: 0.24 miles
Direction: E-W
Address range: 100 to 399
Direction: E-W
Address range: 100 to 399
Collins Ave
Length: 0.24 miles
Direction: E-W
Address range: 100 to 399
Direction: E-W
Address range: 100 to 399
S Baird St
Length: 0.20 miles
Direction: N-S
Address range: 2000 to 2350
Direction: N-S
Address range: 2000 to 2350
Montgomery Ave
Length: 0.08 miles
Direction: E-W
Address range: 100 to 199
Direction: E-W
Address range: 100 to 199
E Stokes Ave
Length: 0.05 miles
Direction: E-W
Address range: 100 to 199
Direction: E-W
Address range: 100 to 199
E Wolcott Ave
Length: 0.05 miles
Direction: E-W
Address range: 100 to 199
Direction: E-W
Address range: 100 to 199
E Longview Ave
Length: 0.05 miles
Direction: E-W
Direction: E-W
E Hicks Ave
Length: 0.04 miles
Direction: E-W
Address range: 100 to 145
Direction: E-W
Address range: 100 to 145
Carter Ave
Length: 0.01 miles
Directions: E-W, SE-NW
Address range: 500 to 502
Directions: E-W, SE-NW
Address range: 500 to 502