Ballpark neighborhood in Denver, Colorado (CO), 80205, 80216 detailed profile
Settings
X


Business Search - 14 Million verified businesses
Area: 0.390 square miles
Population: 264
Population density:
| Ballpark: | 677 people per square mile |
| Denver: | 4,651 people per square mile |

- 17965.8%White
- 4014.7%Hispanic or Latino
- 207.4%Asian
- 134.8%Black
- 114.0%Some other race
- 82.9%American Indian
- 10.4%Two or more races

Distribution of median household income
![Distribution of median household income]()
- 9Less than $10,000
- 9$10,000 to $19,999
- 20$20,000 to $29,999
- 9$30,000 to $39,999
- 7$40,000 to $49,999
- 13$50,000 to $59,999
- 20$60,000 to $74,999
- 19$75,000 to $99,999
- 15$100,000 to $124,999
- 23$125,000 to $149,999
- 4$150,000 to $199,999
- 21$200,000 or more

Distribution of owner-occupied house/condo value
![Distribution of owner-occupied house/condo value]()
- 4$50,000 to $99,999
- 2$100,000 to $149,999
- 3$150,000 to $199,999
- 2$200,000 to $249,999
- 11$250,000 to $299,999
- 19$300,000 to $399,999
- 48$400,000 to $499,999
- 5$500,000 to $749,999
- 8$750,000 to $999,999

Distribution of rent paid by renters
![Distribution of rent paid by renters]()
- 4$200 to $299
- 3$400 to $499
- 4$500 to $599
- 4$600 to $699
- 4$700 to $799
- 3$800 to $899
- 18$900 to $999
- 10$1,000 to $1,249
- 6$1,250 to $1,499
- 27$1,500 to $1,999
- 24$2,000 or more

Median rent in 2022:
| Ballpark: | $978 |
| Denver: | $1,623 |
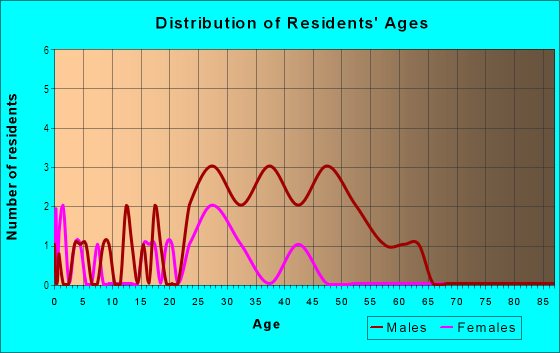
| Males: | 158 |
| Females: | 106 |
Males:
| This neighborhood: | 21.2 years |
| Whole city: | 35.2 years |
| This neighborhood: | 20.5 years |
| Whole city: | 35.1 years |
Average household size:
| Ballpark: | 2.2 people |
| Denver: | 28.0 people |
Percentage of family households:
| Ballpark: | 258.0% |
| Denver: | 35.1% |
| Here: | 197.3% |
| Denver: | 32.5% |
Percentage of married-couple families with children (among all households):
| Ballpark: | 7.1% |
| Denver: | 32.4% |
Percentage of single-mother households (among all households):
| Ballpark: | 2.3% |
| Denver: | 10.3% |
Percentage of never married males 15 years old and over:
Percentage of never married females 15 years old and over:
| Ballpark: | 59.0% |
| Denver: | 25.0% |
Percentage of never married females 15 years old and over:
| Ballpark: | 36.9% |
| city: | 20.8% |
Percentage of people that speak English not well or not at all:
| Ballpark: | 0.0% |
| Denver: | 3.9% |
Percentage of people born in this state:
Percentage of people born in another U.S. state:
Percentage of native residents but born outside the U.S.:
Percentage of foreign born residents:
| Here: | 44.9% |
| Denver: | 38.5% |
Percentage of people born in another U.S. state:
| Ballpark: | 37.5% |
| Denver: | 46.1% |
Percentage of native residents but born outside the U.S.:
| Here: | 0.5% |
| city: | 1.7% |
Percentage of foreign born residents:
| Here: | 17.1% |
| Denver: | 13.8% |

Owner-occupied
Renter-occupied


- Rooms in owner-occupied houses and condos in Ballpark
- 71 room
- 02 rooms
- 13 rooms
- 114 rooms
- 305 rooms
- 156 rooms
- 167 rooms
- 58 rooms
- 89+ rooms

- Rooms in renter-occupied apartments in Ballpark
- 21 room
- 32 rooms
- 63 rooms
- 204 rooms
- 105 rooms
- 56 rooms
- 37 rooms
- 118 rooms
- 19+ rooms
Owner-occupied
Renter-occupied

- Bedrooms in owner-occupied houses and condos in Ballpark
- 7no bedroom
- 31 bedroom
- 352 bedrooms
- 263 bedrooms
- 204 bedrooms
- 35+ bedrooms

- Bedrooms in renter-occupied apartments in Ballpark
- 3no bedroom
- 331 bedroom
- 52 bedrooms
- 243 bedrooms
- 14 bedrooms
- 25+ bedrooms
Average number of cars or other vehicles available in houses/condos:
Average number of cars or other vehicles available in apartments:
| This neighborhood: | |
| Denver: |
Average number of cars or other vehicles available in apartments:
| Here: | 1.6 |
| city: | 1.3 |
Percentage of units with a mortgage:
| Ballpark: | 83.5% |
| Denver: | 75.6% |

- Year house built in Ballpark
- 112020 or later
- 172010 to 2019
- 32000 to 2009
- 21990 to 1999
- 31980 to 1989
- 101970 to 1979
- 111960 to 1969
- 211950 to 1959
- 211940 to 1949
- 771939 or earlier

City-data.com crime index for city in 2020 (higher means more crime):
| City: | 519.0 |
| U.S. average: | 219.5 |
Travel time to work (commute)
![Travel time to work (commute)]()
- 9Less than 5 minutes
- 355 to 9 minutes
- 3910 to 14 minutes
- 4515 to 19 minutes
- 3120 to 24 minutes
- 525 to 29 minutes
- 6030 to 34 minutes
- 835 to 39 minutes
- 440 to 44 minutes
- 2545 to 59 minutes
- 960 to 89 minutes
- 890 or more minutes

Means of transportation to work
![Means of transportation to work]()
- 43.3%71Drove a car alone
- 6.1%10Carpooled
- 1.8%3Bus
- 0.6%1Light rail, streetcar or trolley
- 1.2%2Taxi
- 6.1%10Bicycle
- 33.5%55Walked
- 12.8%21Worked at home

Time leaving home to go to work
![Time leaving home to go to work]()
- 612:00 a.m. to 4:59 a.m.
- 125:00 a.m. to 5:29 a.m.
- 95:30 a.m. to 5:59 a.m.
- 316:00 a.m. to 6:29 a.m.
- 356:30 a.m. to 6:59 a.m.
- 387:00 a.m. to 7:29 a.m.
- 227:30 a.m. to 7:59 a.m.
- 308:00 a.m. to 8:29 a.m.
- 128:30 a.m. to 8:59 a.m.
- 289:00 a.m. to 9:59 a.m.
- 3112:00 p.m. to 3:59 p.m.
- 224:00 p.m. to 11:59 p.m.

Occupations of males:
- Percentage of males in management occupations (except farmers):
Here: 18.1% city: 15.4%
- Percentage of males in business and financial operations occupations:
Here: 12.7% city: 8.3%
- Percentage of males in computer and mathematical occupations:
Here: 9.9% city: 7.4%
- Percentage of males in architecture and engineering occupations:
Here: 2.6% city: 4.5%
- Percentage of males in community and social services occupations:
Here: 6.6% city: 0.9%
- Percentage of males in legal occupations:
Here: 9.3% city: 2.3%
- Percentage of males in education, training, and library occupations:
Here: 3.4% city: 3.1%
- Percentage of males in healthcare practitioners and technical occupations:
Here: 5.2% city: 3.5%
- Percentage of males in service occupations:
Here: 29.7% city: 11.9%
- Percentage of males in sales and office occupations:
Here: 15.6% city: 15.4%
- Percentage of males in farming, fishing, and forestry occupations:
Here: 3.8% city: 0.3%
- Percentage of males in construction, extraction, and maintenance occupations:
Here: 6.1% city: 8.0%
- Percentage of males in production occupations:
Here: 2.9% city: 3.2%
- Percentage of males in transportation occupations:
Here: 12.7% city: 4.2%
- Percentage of males in material moving occupations:
Here: 18.2% city: 3.5%
Occupations of females:
- Percentage of females in management occupations (except farmers):
Here: 3.5% city: 14.0%
- Percentage of females in business and financial operations occupations:
Here: 36.5% city: 10.0%
- Percentage of females in computer and mathematical occupations:
Here: 14.7% city: 2.9%
- Percentage of females in architecture and engineering occupations:
Here: 1.5% city: 1.5%
- Percentage of females in legal occupations:
Here: 10.2% city: 2.4%
- Percentage of females in education, training, and library occupations:
Here: 3.9% city: 7.9%
- Percentage of females in arts, design, entertainment, sports, and media occupations:
Here: 1.1% city: 3.8%
- Percentage of females in healthcare practitioners and technical occupations:
Here: 1.7% city: 10.2%
- Percentage of females in service occupations:
Here: 13.9% city: 16.2%
- Percentage of females in sales and office occupations:
Here: 40.0% city: 21.4%
- Percentage of females in farming, fishing, and forestry occupations:
Here: 6.0% city: 0.1%
- Percentage of females in production occupations:
Here: 4.9% city: 1.7%
- Percentage of females in transportation occupations:
Here: 14.5% city: 1.2%
- Percentage of females in material moving occupations:
Here: 2.2% city: 1.4%
Education in this neighborhood (subdivision or community):
- Percentage of people 3 years and older in K-12 schools:
Ballpark: 21.2% Denver: 12.7%
- Percentage of people 3 years and older in undergraduate colleges:
Ballpark: 80.7% Denver: 4.1%
- Percentage of people 3 years and older in grad. or professional schools:
Ballpark: 6.4% Denver: 2.2%
- Percentage of students K-12 enrolled in private schools:
Ballpark: 8.9% Denver: 11.0%
Percentage of population below poverty level:
| Ballpark: | 24.2% |
| Denver: | 11.8% |
Median year renter moved in (as recorded in 2022):
| Ballpark: | 2020 |
| Denver: | 2021 |
Percentage of married-couple families with both working:
| Ballpark: | 36.3% |
| Denver: | 74.1% |

- 89.1%Utility gas
- 8.7%Electricity
- 1.0%No fuel used
- 0.7%Bottled, tank, or LP gas
- 0.5%Wood
Roads and streets:
Blake St
Length: 1.23 miles
Direction: SW-NE
Address range: 2550 to 3750
Direction: SW-NE
Address range: 2550 to 3750
Arkins Ct
Length: 1.06 miles
Directions: E-W, SW-NE
Address range: 2684 to 3767
Directions: E-W, SW-NE
Address range: 2684 to 3767
Broadway (Brighton Blvd, E Brighton Blvd)
Length: 0.88 miles
Direction: SW-NE
Address range: 2800 to 3599
Direction: SW-NE
Address range: 2800 to 3599
36th St
Length: 0.33 miles
Direction: SE-NW
Address range: 1600 to 2099
Direction: SE-NW
Address range: 1600 to 2099
35th St
Length: 0.30 miles
Direction: SE-NW
Address range: 1600 to 1999
Direction: SE-NW
Address range: 1600 to 1999
Broadway
Length: 0.29 miles
Directions: N-S, SW-NE
Address range: 2561 to 2799
Directions: N-S, SW-NE
Address range: 2561 to 2799
Wynkoop St
Length: 0.23 miles
Directions: N-S, SW-NE
Address range: 3435 to 3599
Directions: N-S, SW-NE
Address range: 3435 to 3599
Denargo Market St
Length: 0.19 miles
Direction: N-S
Direction: N-S
Denargo Market
Length: 0.17 miles
Direction: N-S
Address range: 1 to 1999
Direction: N-S
Address range: 1 to 1999
E 29th St (29th St)
Length: 0.16 miles
Direction: SE-NW
Address range: 1800 to 1999
Direction: SE-NW
Address range: 1800 to 1999
Wazee St
Length: 0.11 miles
Direction: SW-NE
Address range: 3500 to 3648
Direction: SW-NE
Address range: 3500 to 3648
Chestnut Pl
Length: 0.10 miles
Direction: SW-NE
Address range: 3500 to 3599
Direction: SW-NE
Address range: 3500 to 3599
Delgany St
Length: 0.10 miles
Direction: SW-NE
Address range: 3401 to 3599
Direction: SW-NE
Address range: 3401 to 3599
31st St
Length: 0.08 miles
Direction: SE-NW
Address range: 1700 to 1874
Direction: SE-NW
Address range: 1700 to 1874
Railroad features:
Union Pacific RR (Amtrak)
Length: 2.41 miles
Directions: E-W, SW-NE
Directions: E-W, SW-NE