Ardmore neighborhood in Villa Park, Nova Vida, Illinois (IL), 60148, 60181 detailed profile
Settings
X


Business Search - 14 Million verified businesses
Area: 0.468 square miles
Population: 2,265
Population density:
| Ardmore: | 4,840 people per square mile |
| Villa Park: | 4,839 people per square mile |

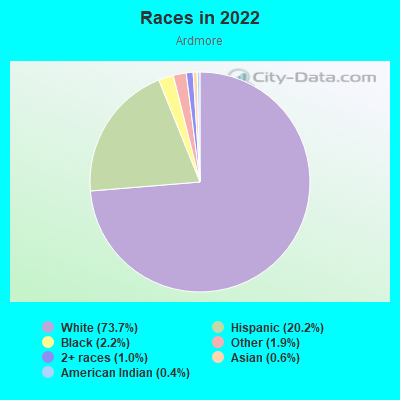
- 1,70073.7%White
- 46620.2%Hispanic or Latino
- 502.2%Black
- 441.9%Some other race
- 241.0%Two or more races
- 150.6%Asian
- 90.4%American Indian

Median household income in 2022:
| Ardmore: | $111,623 |
| Villa Park: | $90,287 |
Distribution of median household income
![Distribution of median household income]()
- 88Less than $10,000
- 20$10,000 to $19,999
- 38$20,000 to $29,999
- 69$30,000 to $39,999
- 64$40,000 to $49,999
- 46$50,000 to $59,999
- 137$60,000 to $74,999
- 89$75,000 to $99,999
- 182$100,000 to $124,999
- 94$125,000 to $149,999
- 104$150,000 to $199,999
- 113$200,000 or more

Distribution of owner-occupied house/condo value
![Distribution of owner-occupied house/condo value]()
- 59Less than $50,000
- 41$50,000 to $99,999
- 48$100,000 to $149,999
- 48$150,000 to $199,999
- 170$200,000 to $249,999
- 134$250,000 to $299,999
- 228$300,000 to $399,999
- 48$400,000 to $499,999
- 45$500,000 to $749,999
- 29$750,000 to $999,999
- 12$1,000,000 or more

Distribution of rent paid by renters
![Distribution of rent paid by renters]()
- 7$200 to $299
- 5$300 to $399
- 11$400 to $499
- 8$500 to $599
- 13$800 to $899
- 11$900 to $999
- 25$1,000 to $1,249
- 19$1,250 to $1,499
- 59$1,500 to $1,999
- 147$2,000 or more

| Males: | 1,099 |
| Females: | 1,166 |
Males:
| This neighborhood: | 35.8 years |
| Whole city: | 36.7 years |
| This neighborhood: | 40.1 years |
| Whole city: | 35.3 years |
Average household size:
| Ardmore: | 2.6 people |
| Villa Park: | 2.8 people |
Percentage of family households:
| Ardmore: | 58.6% |
| Villa Park: | 53.3% |
| Here: | 66.0% |
| Villa Park: | 54.9% |
Percentage of married-couple families with children (among all households):
| Ardmore: | 35.6% |
| Villa Park: | 29.0% |
Percentage of single-mother households (among all households):
| Ardmore: | 1.0% |
| Villa Park: | 4.0% |
Percentage of never married males 15 years old and over:
Percentage of never married females 15 years old and over:
| Ardmore: | 15.9% |
| Villa Park: | 19.9% |
Percentage of never married females 15 years old and over:
| Ardmore: | 15.0% |
| village: | 14.9% |
Percentage of people that speak English not well or not at all:
| Ardmore: | 9.5% |
| Villa Park: | 4.4% |
Percentage of people born in this state:
Percentage of people born in another U.S. state:
Percentage of native residents but born outside the U.S.:
Percentage of foreign born residents:
| Here: | 70.0% |
| Villa Park: | 69.9% |
Percentage of people born in another U.S. state:
| Ardmore: | 15.0% |
| Villa Park: | 12.9% |
Percentage of native residents but born outside the U.S.:
| Here: | 0.6% |
| village: | 1.1% |
Percentage of foreign born residents:
| Here: | 14.4% |
| Villa Park: | 16.0% |
Owner-occupied
Renter-occupied

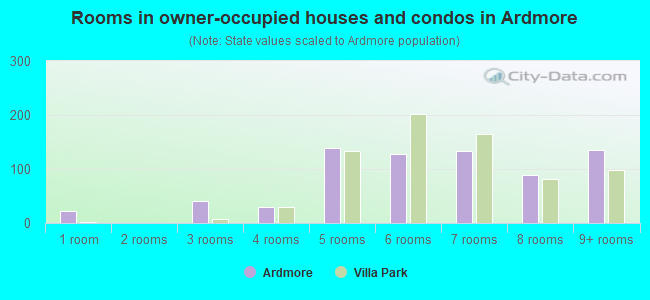
- Rooms in owner-occupied houses and condos in Ardmore
- 231 room
- 02 rooms
- 403 rooms
- 304 rooms
- 1385 rooms
- 1286 rooms
- 1337 rooms
- 898 rooms
- 1369+ rooms
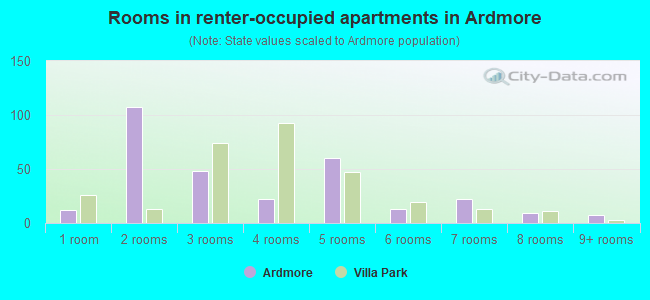
- Rooms in renter-occupied apartments in Ardmore
- 121 room
- 1072 rooms
- 483 rooms
- 224 rooms
- 605 rooms
- 136 rooms
- 227 rooms
- 98 rooms
- 79+ rooms
Owner-occupied
Renter-occupied
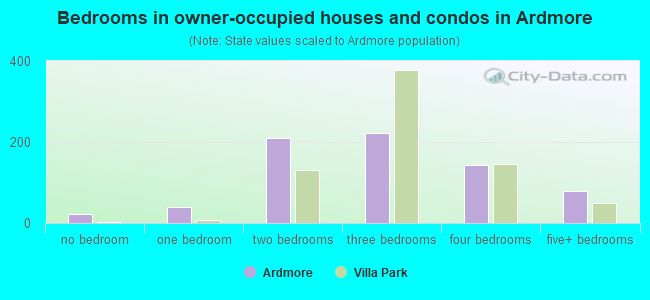
- Bedrooms in owner-occupied houses and condos in Ardmore
- 23no bedroom
- 401 bedroom
- 2102 bedrooms
- 2213 bedrooms
- 1434 bedrooms
- 805+ bedrooms

- Bedrooms in renter-occupied apartments in Ardmore
- 12no bedroom
- 781 bedroom
- 392 bedrooms
- 373 bedrooms
- 84 bedrooms
- 05+ bedrooms
Average number of cars or other vehicles available in houses/condos:
Average number of cars or other vehicles available in apartments:
| This neighborhood: | 2.2 |
| Villa Park: | 2.1 |
Average number of cars or other vehicles available in apartments:
| Here: | 1.9 |
| village: | 1.6 |
Percentage of units with a mortgage:
| Ardmore: | 59.1% |
| Villa Park: | 67.0% |
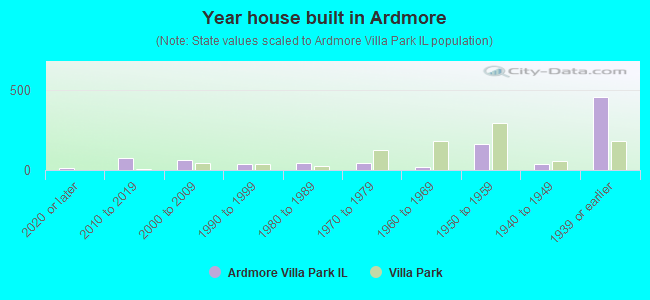
- Year house built in Ardmore
- 112020 or later
- 762010 to 2019
- 622000 to 2009
- 401990 to 1999
- 421980 to 1989
- 461970 to 1979
- 181960 to 1969
- 1621950 to 1959
- 391940 to 1949
- 4561939 or earlier

City-data.com crime index for village in 2020 (higher means more crime):
| City: | 147.7 |
| U.S. average: | 219.5 |
Travel time to work (commute)
![Travel time to work (commute)]()
- 15Less than 5 minutes
- 1695 to 9 minutes
- 20910 to 14 minutes
- 15615 to 19 minutes
- 21020 to 24 minutes
- 17225 to 29 minutes
- 16930 to 34 minutes
- 3635 to 39 minutes
- 8340 to 44 minutes
- 9345 to 59 minutes
- 4860 to 89 minutes
- 1990 or more minutes

Means of transportation to work
![Means of transportation to work]()
- 76.9%1,098Drove a car alone
- 4.1%59Carpooled
- 0.9%13Subway or elevated rail
- 3.7%53Long-distance train or commuter rail
- 0.3%4Taxi
- 3.8%54Bicycle
- 0.8%11Walked
- 1.1%16Other means
- 15.9%227Worked at home

Time leaving home to go to work
![Time leaving home to go to work]()
- 4112:00 a.m. to 4:59 a.m.
- 455:00 a.m. to 5:29 a.m.
- 1035:30 a.m. to 5:59 a.m.
- 1276:00 a.m. to 6:29 a.m.
- 1346:30 a.m. to 6:59 a.m.
- 2207:00 a.m. to 7:29 a.m.
- 1757:30 a.m. to 7:59 a.m.
- 1628:00 a.m. to 8:29 a.m.
- 708:30 a.m. to 8:59 a.m.
- 1179:00 a.m. to 9:59 a.m.
- 2110:00 a.m. to 10:59 a.m.
- 1511:00 a.m. to 11:59 a.m.
- 11012:00 p.m. to 3:59 p.m.
- 774:00 p.m. to 11:59 p.m.

Occupations of males:
- Percentage of males in management occupations (except farmers):
Here: 17.4% village: 12.0%
- Percentage of males in business and financial operations occupations:
Here: 3.7% village: 3.4%
- Percentage of males in computer and mathematical occupations:
Here: 6.6% village: 4.9%
- Percentage of males in architecture and engineering occupations:
Here: 5.1% village: 3.5%
- Percentage of males in community and social services occupations:
Here: 1.2% village: 0.9%
- Percentage of males in education, training, and library occupations:
Here: 7.5% village: 4.2%
- Percentage of males in healthcare practitioners and technical occupations:
Here: 3.4% village: 2.0%
- Percentage of males in service occupations:
Here: 12.3% village: 13.2%
- Percentage of males in sales and office occupations:
Here: 16.9% village: 15.9%
- Percentage of males in production occupations:
Here: 7.5% village: 10.9%
- Percentage of males in transportation occupations:
Here: 2.5% village: 6.1%
- Percentage of males in material moving occupations:
Here: 4.4% village: 7.5%
Occupations of females:
- Percentage of females in management occupations (except farmers):
Here: 17.0% village: 9.4%
- Percentage of females in business and financial operations occupations:
Here: 12.1% village: 7.3%
- Percentage of females in computer and mathematical occupations:
Here: 1.1% village: 1.4%
- Percentage of females in education, training, and library occupations:
Here: 9.9% village: 7.5%
- Percentage of females in arts, design, entertainment, sports, and media occupations:
Here: 1.3% village: 2.5%
- Percentage of females in healthcare practitioners and technical occupations:
Here: 12.0% village: 8.6%
- Percentage of females in service occupations:
Here: 17.9% village: 21.1%
- Percentage of females in sales and office occupations:
Here: 26.0% village: 29.7%
- Percentage of females in production occupations:
Here: 9.5% village: 3.7%
- Percentage of females in transportation occupations:
Here: 1.1% village: 1.5%
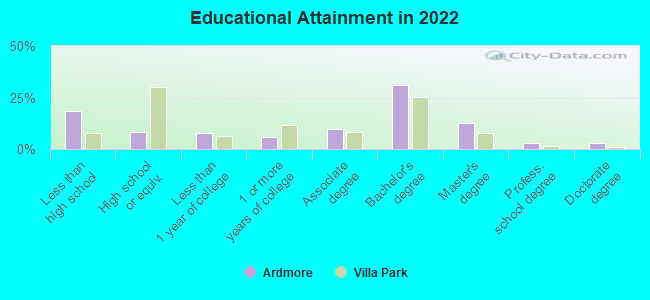
Education in this neighborhood (subdivision or community):
- Percentage of people 3 years and older in K-12 schools:
Ardmore: 12.6% Villa Park: 17.1%
- Percentage of people 3 years and older in undergraduate colleges:
Ardmore: 10.9% Villa Park: 4.9%
- Percentage of people 3 years and older in grad. or professional schools:
Ardmore: 3.9% Villa Park: 1.4%
- Percentage of students K-12 enrolled in private schools:
Ardmore: 50.5% Villa Park: 15.5%
Percentage of population below poverty level:
| Ardmore: | 3.0% |
| Villa Park: | 4.9% |
Median year owner moved in (as recorded in 2022):
| Ardmore: | 2005 |
| Villa Park: | 2005 |
Percentage of married-couple families with both working:
| Ardmore: | 91.5% |
| Villa Park: | 72.9% |
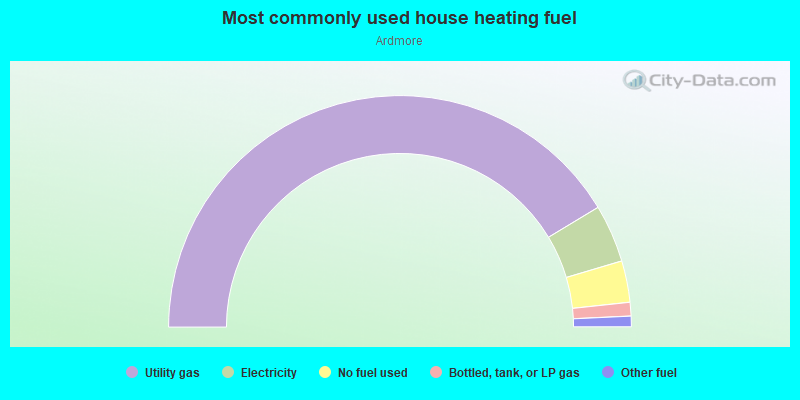
- 82.7%Utility gas
- 8.1%Electricity
- 5.8%No fuel used
- 1.9%Bottled, tank, or LP gas
- 1.5%Other fuel
Roads and streets:
Illinois Prairie Path - Main Stem
Length: 1.69 miles
Direction: E-W
Direction: E-W
Great Western Trl
Length: 1.67 miles
Direction: E-W
Direction: E-W
E Kenilworth Ave
Length: 1.01 miles
Direction: E-W
Address range: 20 to 1158
Direction: E-W
Address range: 20 to 1158
E Park Blvd
Length: 0.70 miles
Direction: E-W
Address range: 1 to 428
Direction: E-W
Address range: 1 to 428
E Central Blvd
Length: 0.70 miles
Direction: E-W
Address range: 1 to 427
Direction: E-W
Address range: 1 to 427
W Kenilworth Ave
Length: 0.69 miles
Directions: E-W, SE-NW
Address range: 1 to 358
Directions: E-W, SE-NW
Address range: 1 to 358
W Central Blvd
Length: 0.68 miles
Direction: E-W
Address range: 1 to 356
Direction: E-W
Address range: 1 to 356
W School St
Length: 0.67 miles
Direction: E-W
Address range: 1 to 356
Direction: E-W
Address range: 1 to 356
S Westmore Meyers Rd (S Meyers Rd, S Westmore Ave)
Length: 0.48 miles
Direction: N-S
Address range: 3 to 303
Direction: N-S
Address range: 3 to 303
S 2nd St (S 2nd Ave)
Length: 0.45 miles
Direction: N-S
Address range: 3 to 249
Direction: N-S
Address range: 3 to 249
S 3rd Ave (S 3rd St)
Length: 0.44 miles
Direction: N-S
Address range: 1 to 299
Direction: N-S
Address range: 1 to 299
S Harvard Ave
Length: 0.41 miles
Direction: N-S
Address range: 28 to 378
Direction: N-S
Address range: 28 to 378
S Wisconsin Ave
Length: 0.37 miles
Direction: N-S
Address range: 95 to 381
Direction: N-S
Address range: 95 to 381
S Michigan Ave
Length: 0.36 miles
Direction: N-S
Address range: 100 to 399
Direction: N-S
Address range: 100 to 399
E North Broadway St
Length: 0.34 miles
Direction: E-W
Address range: 1000 to 1199
Direction: E-W
Address range: 1000 to 1199
E Maple St
Length: 0.34 miles
Direction: E-W
Address range: 1000 to 1148
Direction: E-W
Address range: 1000 to 1148
S Ardmore Ave
Length: 0.33 miles
Direction: N-S
Address range: 66 to 327
Direction: N-S
Address range: 66 to 327
S Yale Ave
Length: 0.31 miles
Direction: N-S
Address range: 90 to 368
Direction: N-S
Address range: 90 to 368
S Princeton Ave
Length: 0.27 miles
Direction: N-S
Address range: 100 to 335
Direction: N-S
Address range: 100 to 335
E Emerson Ave
Length: 0.25 miles
Direction: E-W
Address range: 1000 to 1122
Direction: E-W
Address range: 1000 to 1122
S Cornell Ave
Length: 0.20 miles
Direction: N-S
Address range: 100 to 319
Direction: N-S
Address range: 100 to 319
S Illinois Ave
Length: 0.17 miles
Direction: N-S
Address range: 100 to 239
Direction: N-S
Address range: 100 to 239
S Summit Ave
Length: 0.16 miles
Direction: N-S
Address range: 100 to 236
Direction: N-S
Address range: 100 to 236
S Addison St
Length: 0.15 miles
Direction: N-S
Address range: 206 to 399
Direction: N-S
Address range: 206 to 399
Kenilworth Ct
Length: 0.14 miles
Direction: E-W
Address range: 1 to 99
Direction: E-W
Address range: 1 to 99
S Villa Ave
Length: 0.11 miles
Direction: N-S
Address range: 156 to 228
Direction: N-S
Address range: 156 to 228
S Euclid Ave
Length: 0.09 miles
Direction: N-S
Address range: 114 to 222
Direction: N-S
Address range: 114 to 222
S Myrtle Ave
Length: 0.09 miles
Direction: N-S
Address range: 89 to 225
Direction: N-S
Address range: 89 to 225
S Cortesi Ave
Length: 0.08 miles
Direction: N-S
Address range: 248 to 337
Direction: N-S
Address range: 248 to 337
S Addison Ave
Length: 0.05 miles
Direction: N-S
Address range: 15 to 105
Direction: N-S
Address range: 15 to 105
Myrtle Ave
Length: 0.05 miles
Direction: E-W
Direction: E-W
Ovaltine Ct
Length: 0.01 miles
Direction: E-W
Direction: E-W