Alderwood Heights neighborhood in Lynnwood, Washington (WA), 98037 detailed profile
Settings
X


Business Search - 14 Million verified businesses
Area: 0.030 square miles
Population: 236
Population density:
| Alderwood Heights: | 7,808 people per square mile |
| Lynnwood: | 5,219 people per square mile |

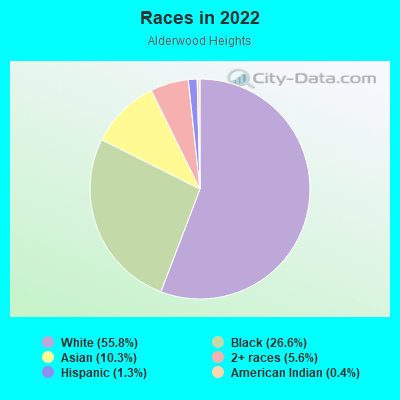
- 13055.8%White
- 6226.6%Black
- 2410.3%Asian
- 135.6%Two or more races
- 31.3%Hispanic or Latino
- 10.4%American Indian
Median household income in 2022:
| Alderwood Heights: | $95,768 |
| Lynnwood: | $72,241 |
Distribution of median household income
![Distribution of median household income]()
- 3Less than $10,000
- 14$10,000 to $19,999
- 3$20,000 to $29,999
- 10$30,000 to $39,999
- 5$40,000 to $49,999
- 5$50,000 to $59,999
- 8$60,000 to $74,999
- 41$75,000 to $99,999
- 6$100,000 to $124,999
- 4$125,000 to $149,999
- 20$150,000 to $199,999
- 10$200,000 or more

Distribution of owner-occupied house/condo value
![Distribution of owner-occupied house/condo value]()
- 3Less than $50,000
- 3$50,000 to $99,999
- 1$200,000 to $249,999
- 1$250,000 to $299,999
- 7$300,000 to $399,999
- 4$400,000 to $499,999
- 4$500,000 to $749,999
- 14$750,000 to $999,999
- 6$1,000,000 or more

Distribution of rent paid by renters
![Distribution of rent paid by renters]()
- 1$600 to $699
- 2$800 to $899
- 2$900 to $999
- 10$1,000 to $1,249
- 21$1,250 to $1,499
- 51$1,500 to $1,999
- 8$2,000 or more

Median rent in 2022:
| Alderwood Heights: | $1,648 |
| Lynnwood: | $1,466 |
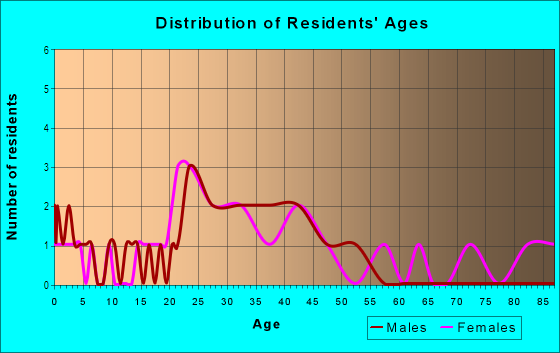
| Males: | 98 |
| Females: | 137 |
Males:
| This neighborhood: | 44.6 years |
| Whole city: | 38.5 years |
| This neighborhood: | 40.8 years |
| Whole city: | 40.7 years |
Average household size:
| Alderwood Heights: | 2.1 people |
| Lynnwood: | 2.5 people |
Percentage of family households:
| Alderwood Heights: | 39.6% |
| Lynnwood: | 42.8% |
| Here: | 48.5% |
| Lynnwood: | 41.5% |
Percentage of married-couple families with children (among all households):
| Alderwood Heights: | 45.7% |
| Lynnwood: | 30.2% |
Percentage of single-mother households (among all households):
| Alderwood Heights: | 3.0% |
| Lynnwood: | 6.8% |
Percentage of never married males 15 years old and over:
Percentage of never married females 15 years old and over:
| Alderwood Heights: | 11.6% |
| Lynnwood: | 19.2% |
Percentage of never married females 15 years old and over:
| Alderwood Heights: | 12.3% |
| city: | 15.0% |
Percentage of people that speak English not well or not at all:
| Alderwood Heights: | 4.6% |
| Lynnwood: | 7.8% |
Percentage of people born in this state:
Percentage of people born in another U.S. state:
Percentage of native residents but born outside the U.S.:
Percentage of foreign born residents:
| Here: | 35.1% |
| Lynnwood: | 42.0% |
Percentage of people born in another U.S. state:
| Alderwood Heights: | 24.9% |
| Lynnwood: | 25.3% |
Percentage of native residents but born outside the U.S.:
| Here: | 2.2% |
| city: | 2.5% |
Percentage of foreign born residents:
| Here: | 37.9% |
| Lynnwood: | 30.1% |
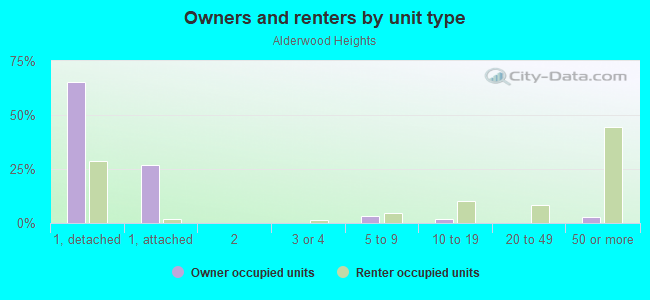
Owner-occupied
Renter-occupied

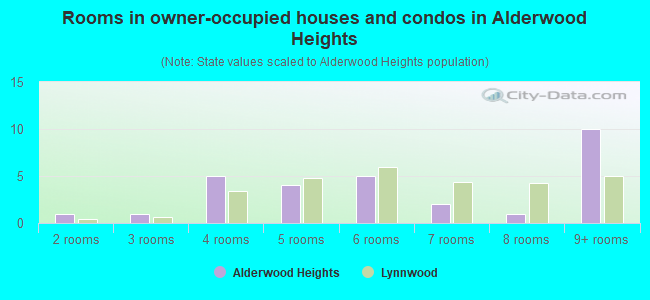
- Rooms in owner-occupied houses and condos in Alderwood Heights
- 01 room
- 12 rooms
- 13 rooms
- 54 rooms
- 45 rooms
- 56 rooms
- 27 rooms
- 18 rooms
- 109+ rooms
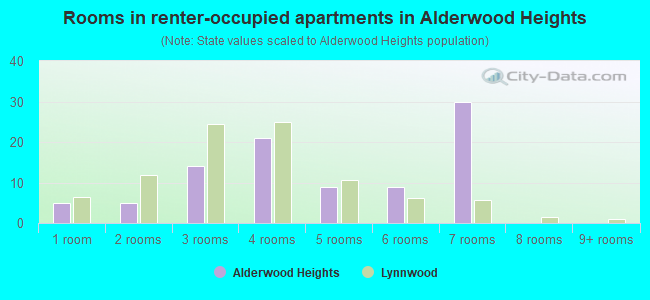
- Rooms in renter-occupied apartments in Alderwood Heights
- 51 room
- 52 rooms
- 143 rooms
- 214 rooms
- 95 rooms
- 96 rooms
- 307 rooms
- 08 rooms
- 09+ rooms
Owner-occupied
Renter-occupied
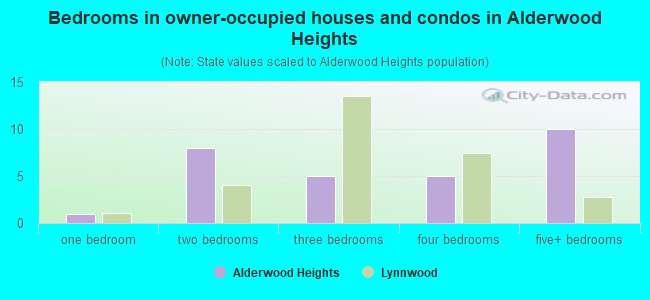
- Bedrooms in owner-occupied houses and condos in Alderwood Heights
- 0no bedroom
- 11 bedroom
- 82 bedrooms
- 53 bedrooms
- 54 bedrooms
- 105+ bedrooms
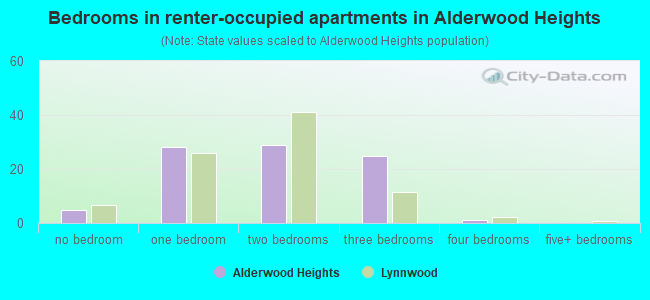
- Bedrooms in renter-occupied apartments in Alderwood Heights
- 5no bedroom
- 281 bedroom
- 292 bedrooms
- 253 bedrooms
- 14 bedrooms
- 05+ bedrooms
Average number of cars or other vehicles available in houses/condos:
Average number of cars or other vehicles available in apartments:
| This neighborhood: | 2.1 |
| Lynnwood: | 2.1 |
Average number of cars or other vehicles available in apartments:
| Here: | 1.4 |
| city: | 1.3 |
Percentage of units with a mortgage:
| Alderwood Heights: | 25.6% |
| Lynnwood: | 70.4% |
Housing prices:
- Average estimated value of detached houses in 2022 (40.4% of all units):
Alderwood Heights: $866,787 Lynnwood: $639,462
- Average estimated value of townhouses or other attached units in 2022 (8.8% of all units):
This neighborhood: $355,750 city: $431,799
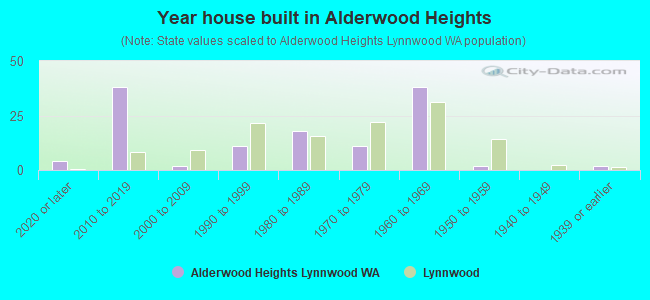
- Year house built in Alderwood Heights
- 42020 or later
- 382010 to 2019
- 22000 to 2009
- 111990 to 1999
- 181980 to 1989
- 111970 to 1979
- 381960 to 1969
- 21950 to 1959
- 01940 to 1949
- 21939 or earlier
City-data.com crime index for city in 2020 (higher means more crime):
| City: | 283.8 |
| U.S. average: | 219.5 |
Travel time to work (commute)
![Travel time to work (commute)]()
- 6Less than 5 minutes
- 195 to 9 minutes
- 1010 to 14 minutes
- 1015 to 19 minutes
- 920 to 24 minutes
- 825 to 29 minutes
- 2430 to 34 minutes
- 635 to 39 minutes
- 240 to 44 minutes
- 445 to 59 minutes
- 1360 to 89 minutes
- 490 or more minutes

Means of transportation to work
![Means of transportation to work]()
- 70.0%99Drove a car alone
- 11.3%16Carpooled
- 7.1%10Bus
- 0.7%1Ferryboat
- 5.0%7Walked
- 5.7%8Worked at home

Time leaving home to go to work
![Time leaving home to go to work]()
- 1412:00 a.m. to 4:59 a.m.
- 25:00 a.m. to 5:29 a.m.
- 35:30 a.m. to 5:59 a.m.
- 186:00 a.m. to 6:29 a.m.
- 76:30 a.m. to 6:59 a.m.
- 147:00 a.m. to 7:29 a.m.
- 117:30 a.m. to 7:59 a.m.
- 58:00 a.m. to 8:29 a.m.
- 48:30 a.m. to 8:59 a.m.
- 99:00 a.m. to 9:59 a.m.
- 210:00 a.m. to 10:59 a.m.
- 311:00 a.m. to 11:59 a.m.
- 1112:00 p.m. to 3:59 p.m.
- 124:00 p.m. to 11:59 p.m.

Occupations of males:
- Percentage of males in management occupations (except farmers):
Here: 4.8% city: 10.7%
- Percentage of males in business and financial operations occupations:
Here: 11.2% city: 6.3%
- Percentage of males in computer and mathematical occupations:
Here: 8.0% city: 7.0%
- Percentage of males in architecture and engineering occupations:
Here: 3.8% city: 3.1%
- Percentage of males in community and social services occupations:
Here: 1.1% city: 1.8%
- Percentage of males in service occupations:
Here: 72.7% city: 17.8%
- Percentage of males in sales and office occupations:
Here: 4.6% city: 14.5%
- Percentage of males in construction, extraction, and maintenance occupations:
Here: 3.5% city: 8.5%
- Percentage of males in production occupations:
Here: 1.2% city: 4.8%
- Percentage of males in transportation occupations:
Here: 4.5% city: 7.3%
- Percentage of males in material moving occupations:
Here: 5.0% city: 5.3%
Occupations of females:
- Percentage of females in business and financial operations occupations:
Here: 10.8% city: 7.0%
- Percentage of females in life, physical, and social science occupations:
Here: 1.8% city: 0.9%
- Percentage of females in legal occupations:
Here: 1.6% city: 1.6%
- Percentage of females in education, training, and library occupations:
Here: 2.0% city: 7.8%
- Percentage of females in arts, design, entertainment, sports, and media occupations:
Here: 6.1% city: 4.0%
- Percentage of females in healthcare practitioners and technical occupations:
Here: 10.7% city: 10.6%
- Percentage of females in service occupations:
Here: 15.0% city: 21.4%
- Percentage of females in sales and office occupations:
Here: 51.3% city: 27.9%
Percentage of people 16-64 in Armed Forces:
| Alderwood Heights: | 0.1% |
| Lynnwood: | 0.1% |
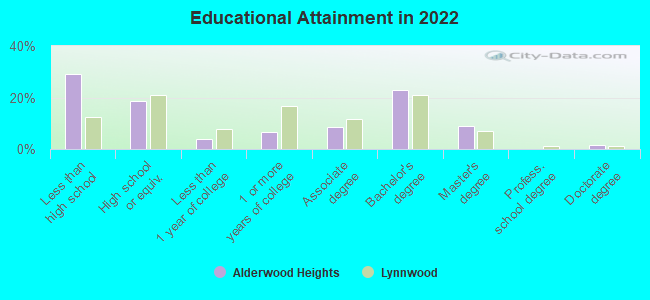
Education in this neighborhood (subdivision or community):
- Percentage of people 3 years and older in K-12 schools:
Alderwood Heights: 8.0% Lynnwood: 13.6%
- Percentage of people 3 years and older in undergraduate colleges:
Alderwood Heights: 2.7% Lynnwood: 6.0%
- Percentage of people 3 years and older in grad. or professional schools:
Alderwood Heights: 2.2% Lynnwood: 1.1%
- Percentage of students K-12 enrolled in private schools:
Alderwood Heights: 16.7% Lynnwood: 12.3%
Percentage of population below poverty level:
| Alderwood Heights: | 8.4% |
| Lynnwood: | 14.9% |
Median year owner moved in (as recorded in 2022):
Median year renter moved in (as recorded in 2022):
| Alderwood Heights: | 2006 |
| Lynnwood: | 2008 |
Median year renter moved in (as recorded in 2022):
| Alderwood Heights: | 2018 |
| Lynnwood: | 2016 |
Percentage of married-couple families with both working:
| Alderwood Heights: | 105.1% |
| Lynnwood: | 64.7% |
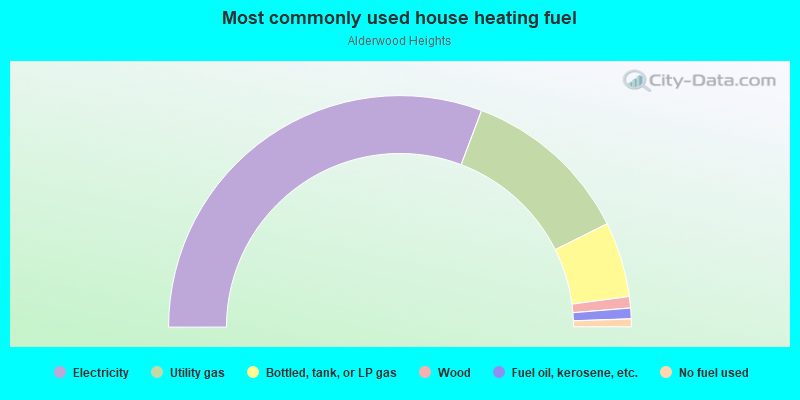
- 61.5%Electricity
- 23.8%Utility gas
- 10.5%Bottled, tank, or LP gas
- 1.6%Wood
- 1.5%Fuel oil, kerosene, etc.
- 1.1%No fuel used
Roads and streets:
36th Ave W
Length: 0.37 miles
Directions: N-S, SE-NW
Address range: 18000 to 18399
Directions: N-S, SE-NW
Address range: 18000 to 18399
184th St SW (Pioneer Park Rd)
Length: 0.14 miles
Direction: E-W
Direction: E-W