The median household income in Waterford, CT in 2022 was $94,839, which was 6.8% greater than the median annual income of $88,429 across the entire state of Connecticut. Compared to the median income of $56,047 in 2000 this represents an increase of 40.9%. The per capita income in 2022 was $49,037, which means an increase of 45.3% compared to 2000 when it was $26,807.
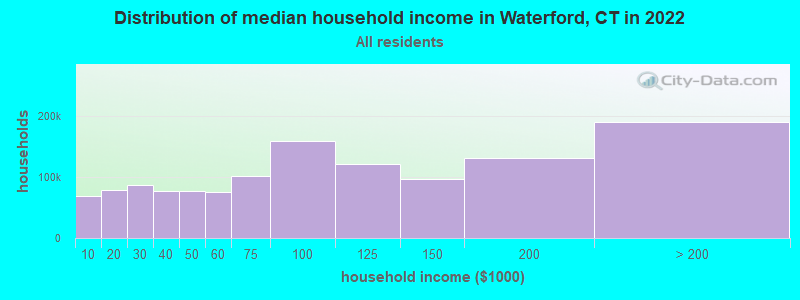
Income statistics for all residents
Median household income in Waterford, CT in 2022:
Waterford:
$94,839
State:
$88,429
Change in median household income between 2000 and 2022:
Waterford, Connecticut:
+69.2%
Connecticut:
+64.0%
Number of households with income < $10k:
Waterford:
5.2% (38,630)
Connecticut:
5.1% (72,746)
Number of households with income $10k - 20k:
Waterford:
5.8% (43,561)
State:
5.7% (81,643)
Number of households with income $20k - 30k:
Waterford:
6.6% (49,307)
State:
6.5% (92,844)
Number of households with income $30k - 40k:
Waterford:
5.9% (44,249)
State:
5.9% (83,934)
Number of households with income $40k - 50k:
Waterford:
5.9% (43,966)
Connecticut:
5.8% (83,025)
Number of households with income $50k - 60k:
Waterford:
5.8% (43,111)
State:
5.7% (81,788)
Number of households with income $60k - 75k:
Waterford:
8.1% (60,404)
State:
8.1% (115,651)
Number of households with income $75k - 100k:
Waterford:
12.6% (94,338)
State:
12.6% (180,173)
Number of households with income $100k - 125k:
Waterford:
9.8% (73,441)
State:
9.9% (141,231)
Number of households with income $125k - 150k:
Waterford:
7.8% (58,650)
State:
7.9% (112,826)
Number of households with income $150k - 200k:
Waterford:
10.7% (80,228)
State:
10.8% (154,641)
Number of households with income > $200k:
Waterford:
16.0% (119,856)
Connecticut:
16.3% (233,133)
Aggregate household income in Waterford in 2022: $21,654,433,896
Median family income in Waterford in 2022:
Waterford:
$117,266
State:
$115,183
Median non-family income in Waterford in 2022:
Waterford:
$55,632
Connecticut:
$50,964
Change in median non-family income between 2000 and 2022:
Waterford, Connecticut:
+71.5%
State:
+65.1%
Median per capita income in Waterford in 2022:
Waterford:
$49,038
State:
$51,581
Change in median per capita income between 2000 and 2022:
Waterford, Connecticut:
+82.9%
State:
+79.3%
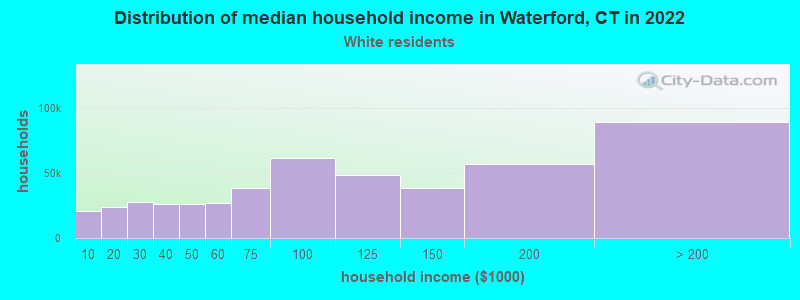
Income statistics for White residents
Median household income in Waterford, CT in 2022:
Waterford:
$93,593
State:
$96,890
Change in median household income between 2000 and 2022:
Waterford, Connecticut:
+69.4%
State:
+68.5%
Number of households with income < $10k:
Waterford:
4.2% (20,471)
Connecticut:
4.2% (42,265)
Number of households with income $10k - 20k:
Waterford:
4.9% (23,536)
Connecticut:
4.8% (48,323)
Number of households with income $20k - 30k:
Waterford:
5.8% (27,990)
State:
5.7% (57,716)
Number of households with income $30k - 40k:
Waterford:
5.4% (25,909)
Connecticut:
5.3% (53,827)
Number of households with income $40k - 50k:
Waterford:
5.3% (25,801)
Connecticut:
5.3% (53,301)
Number of households with income $50k - 60k:
Waterford:
5.6% (26,851)
Connecticut:
5.5% (55,690)
Number of households with income $60k - 75k:
Waterford:
7.9% (38,372)
State:
8.0% (80,329)
Number of households with income $75k - 100k:
Waterford:
12.7% (61,487)
Connecticut:
12.7% (128,070)
Number of households with income $100k - 125k:
Waterford:
10.0% (48,282)
State:
10.0% (101,210)
Number of households with income $125k - 150k:
Waterford:
8.0% (38,762)
State:
8.0% (81,250)
Number of households with income $150k - 200k:
Waterford:
11.8% (56,995)
Connecticut:
11.8% (119,527)
Number of households with income > $200k:
Waterford:
18.4% (89,224)
Connecticut:
18.6% (187,875)
Aggregate household income in Waterford in 2022: $15,379,202,337
Median family income in Waterford in 2022:
Waterford:
$119,164
State:
$128,955
Number of families with income < $10k:
Waterford:
2.1% (77)
Connecticut:
1.9% (11,537)
Number of families with income $10k - 20k:
Waterford:
1.9% (69)
State:
1.8% (11,289)
Number of families with income $20k - 30k:
Waterford:
3.9% (145)
State:
3.0% (18,506)
Number of families with income $30k - 40k:
Waterford:
4.8% (178)
State:
2.9% (18,160)
Number of families with income $40k - 50k:
Waterford:
4.9% (183)
State:
3.9% (24,550)
Number of families with income $50k - 60k:
Waterford:
5.6% (209)
State:
4.3% (26,723)
Number of families with income $60k - 75k:
Waterford:
10.5% (391)
State:
7.1% (44,075)
Number of families with income $75k - 100k:
Waterford:
11.9% (444)
Connecticut:
12.5% (77,679)
Number of families with income $100k - 125k:
Waterford:
12.5% (467)
State:
11.1% (69,086)
Number of families with income $125k - 150k:
Waterford:
12.1% (453)
Connecticut:
9.6% (59,616)
Number of families with income $150k - 200k:
Waterford:
19.7% (736)
Connecticut:
15.7% (97,890)
Number of families with income > $200k:
Waterford:
10.2% (383)
Connecticut:
26.3% (163,417)
Median non-family income in Waterford in 2022:
Waterford:
$56,102
Connecticut:
$54,067
Change in median non-family income between 2000 and 2022:
Waterford, Connecticut:
+73.7%
Connecticut:
+68.7%
Median per capita income in Waterford in 2022:
Waterford:
$51,968
Connecticut:
$59,916
Change in median per capita income between 2000 and 2022:
Waterford, Connecticut:
+92.1%
State:
+90.2%
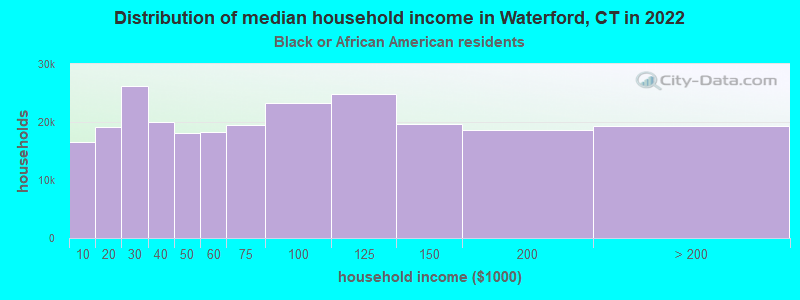
Income statistics for Black or African American residents
Median household income in Waterford, CT in 2022:
Waterford:
$98,288
Connecticut:
$61,803
Change in median household income between 2000 and 2022:
Waterford, Connecticut:
+60.9%
State:
+76.1%
Number of households with income < $10k:
Waterford:
6.8% (16,520)
State:
6.8% (9,494)
Number of households with income $10k - 20k:
Waterford:
7.9% (19,146)
State:
7.9% (11,003)
Number of households with income $20k - 30k:
Waterford:
10.8% (26,179)
Connecticut:
10.8% (15,045)
Number of households with income $30k - 40k:
Waterford:
8.2% (20,013)
Connecticut:
8.2% (11,501)
Number of households with income $40k - 50k:
Waterford:
7.4% (18,124)
State:
7.4% (10,416)
Number of households with income $50k - 60k:
Waterford:
7.5% (18,330)
State:
7.5% (10,534)
Number of households with income $60k - 75k:
Waterford:
8.0% (19,565)
Connecticut:
8.0% (11,244)
Number of households with income $75k - 100k:
Waterford:
9.6% (23,265)
Connecticut:
9.6% (13,370)
Number of households with income $100k - 125k:
Waterford:
10.2% (24,785)
State:
10.2% (14,244)
Number of households with income $125k - 150k:
Waterford:
8.0% (19,569)
State:
8.0% (11,246)
Number of households with income $150k - 200k:
Waterford:
7.7% (18,666)
State:
7.7% (10,727)
Number of households with income > $200k:
Waterford:
7.9% (19,290)
Connecticut:
7.9% (11,086)
Aggregate household income in Waterford in 2022: $34,365,140
Median family income in Waterford in 2022:
Waterford:
$152,958
State:
$87,228
Number of families with income $20k - 30k:
Waterford:
6.1% (6)
Connecticut:
6.0% (5,015)
Number of families with income $60k - 75k:
Waterford:
23.8% (25)
State:
8.2% (6,861)
Number of families with income $75k - 100k:
Waterford:
25.5% (27)
State:
12.7% (10,598)
Number of families with income $100k - 125k:
Waterford:
10.2% (11)
State:
11.4% (9,482)
Number of families with income $125k - 150k:
Waterford:
34.3% (36)
State:
11.2% (9,356)
Median non-family income in Waterford in 2022:
Waterford:
$47,563
State:
$38,608
Change in median non-family income between 2000 and 2022:
Waterford, Connecticut:
+77.0%
State:
+77.0%
Median per capita income in Waterford in 2022:
Waterford:
$40,633
Connecticut:
$36,289
Change in median per capita income between 2000 and 2022:
Waterford, Connecticut:
+115.2%
Connecticut:
+117.5%
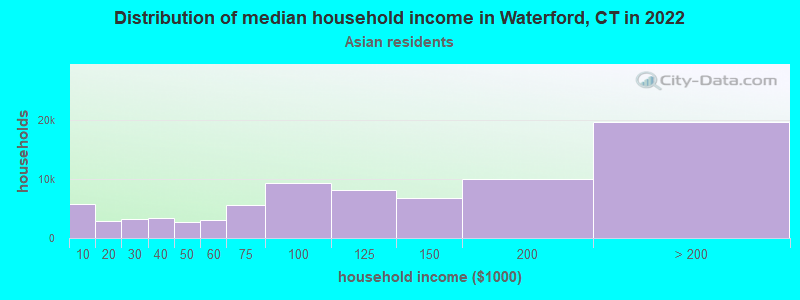
Income statistics for Asian residents
Median household income in Waterford, CT in 2022:
Waterford:
$173,444
State:
$110,568
Change in median household income between 2000 and 2022:
Waterford, Connecticut:
+110.1%
State:
+79.5%
Number of households with income < $10k:
Waterford:
7.1% (5,690)
State:
7.1% (4,245)
Number of households with income $10k - 20k:
Waterford:
3.5% (2,798)
State:
3.5% (2,087)
Number of households with income $20k - 30k:
Waterford:
4.1% (3,303)
Connecticut:
4.1% (2,464)
Number of households with income $30k - 40k:
Waterford:
4.1% (3,321)
Connecticut:
4.1% (2,478)
Number of households with income $40k - 50k:
Waterford:
3.3% (2,659)
Connecticut:
3.3% (1,983)
Number of households with income $50k - 60k:
Waterford:
3.9% (3,121)
Connecticut:
3.9% (2,328)
Number of households with income $60k - 75k:
Waterford:
7.0% (5,668)
Connecticut:
7.0% (4,228)
Number of households with income $75k - 100k:
Waterford:
11.5% (9,264)
State:
11.5% (6,911)
Number of households with income $100k - 125k:
Waterford:
10.2% (8,213)
State:
10.2% (6,127)
Number of households with income $125k - 150k:
Waterford:
8.5% (6,808)
Connecticut:
8.5% (5,079)
Number of households with income $150k - 200k:
Waterford:
12.4% (9,965)
State:
12.4% (7,434)
Number of households with income > $200k:
Waterford:
24.4% (19,653)
State:
24.4% (14,661)
Aggregate household income in Waterford in 2022: $67,073,798
Median family income in Waterford in 2022:
Waterford:
$173,019
Connecticut:
$134,548
Number of families with income $30k - 40k:
Waterford:
2.5% (9)
Connecticut:
3.8% (1,652)
Number of families with income $40k - 50k:
Waterford:
2.6% (9)
State:
2.0% (863)
Number of families with income $50k - 60k:
Waterford:
4.9% (17)
Connecticut:
3.7% (1,635)
Number of families with income $60k - 75k:
Waterford:
1.4% (5)
Connecticut:
6.0% (2,651)
Number of families with income $75k - 100k:
Waterford:
5.3% (19)
Connecticut:
11.0% (4,844)
Number of families with income $100k - 125k:
Waterford:
4.3% (15)
State:
10.5% (4,621)
Number of families with income $125k - 150k:
Waterford:
4.5% (16)
Connecticut:
8.2% (3,588)
Number of families with income $150k - 200k:
Waterford:
18.9% (67)
Connecticut:
14.2% (6,237)
Number of families with income > $200k:
Waterford:
55.6% (197)
State:
30.8% (13,522)
Median non-family income in Waterford in 2022:
Waterford:
$187,651
State:
$63,785
Change in median non-family income between 2000 and 2022:
Waterford, Connecticut:
+148.6%
State:
+77.9%
Median per capita income in Waterford in 2022:
Waterford:
$70,765
State:
$55,295
Change in median per capita income between 2000 and 2022:
Waterford, Connecticut:
+103.6%
State:
+97.8%
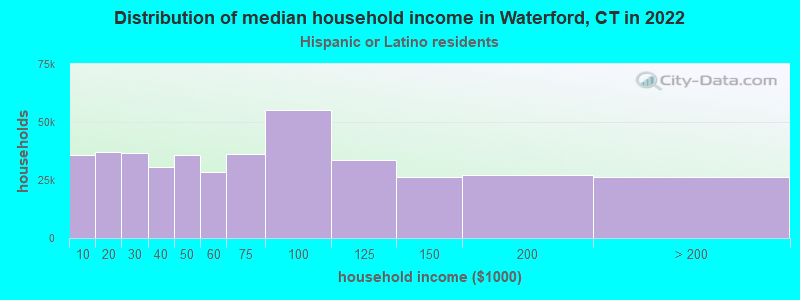
Income statistics for Hispanic or Latino residents
Median household income in Waterford, CT in 2022:
Waterford:
$103,742
State:
$60,275
Change in median household income between 2000 and 2022:
Waterford, Connecticut:
+67.8%
State:
+87.9%
Number of households with income < $10k:
Waterford:
8.7% (35,822)
State:
8.7% (18,584)
Number of households with income $10k - 20k:
Waterford:
9.1% (37,077)
Connecticut:
9.1% (19,235)
Number of households with income $20k - 30k:
Waterford:
8.9% (36,603)
State:
8.9% (18,989)
Number of households with income $30k - 40k:
Waterford:
7.5% (30,778)
Connecticut:
7.5% (15,967)
Number of households with income $40k - 50k:
Waterford:
8.7% (35,595)
State:
8.7% (18,466)
Number of households with income $50k - 60k:
Waterford:
6.9% (28,347)
State:
6.9% (14,706)
Number of households with income $60k - 75k:
Waterford:
8.9% (36,408)
State:
8.9% (18,888)
Number of households with income $75k - 100k:
Waterford:
13.5% (55,262)
State:
13.5% (28,669)
Number of households with income $100k - 125k:
Waterford:
8.2% (33,605)
State:
8.2% (17,434)
Number of households with income $125k - 150k:
Waterford:
6.5% (26,508)
Connecticut:
6.5% (13,752)
Number of households with income $150k - 200k:
Waterford:
6.6% (27,206)
State:
6.6% (14,114)
Number of households with income > $200k:
Waterford:
6.4% (26,273)
State:
6.4% (13,630)
Aggregate household income in Waterford in 2022: $60,746,280
Median family income in Waterford in 2022:
Waterford:
$110,592
State:
$68,336
Number of families with income < $10k:
Waterford:
4.0% (39)
Connecticut:
5.2% (7,456)
Number of families with income $10k - 20k:
Waterford:
5.4% (52)
Connecticut:
6.0% (8,616)
Number of families with income $20k - 30k:
Waterford:
11.3% (109)
State:
8.9% (12,680)
Number of families with income $30k - 40k:
Waterford:
10.7% (103)
State:
8.5% (12,090)
Number of families with income $40k - 50k:
Waterford:
9.7% (94)
Connecticut:
8.8% (12,624)
Number of families with income $50k - 60k:
Waterford:
10.1% (97)
Connecticut:
8.4% (11,924)
Number of families with income $60k - 75k:
Waterford:
10.7% (103)
State:
8.9% (12,677)
Number of families with income $75k - 100k:
Waterford:
12.1% (117)
State:
14.3% (20,457)
Number of families with income $100k - 125k:
Waterford:
7.7% (74)
State:
8.2% (11,720)
Number of families with income $125k - 150k:
Waterford:
8.9% (86)
State:
8.2% (11,729)
Number of families with income $150k - 200k:
Waterford:
7.2% (69)
State:
7.1% (10,096)
Number of families with income > $200k:
Waterford:
2.2% (22)
Connecticut:
7.4% (10,622)
Median non-family income in Waterford in 2022:
Waterford:
$18,376
State:
$36,714
Change in median non-family income between 2000 and 2022:
Waterford, Connecticut:
+73.9%
Connecticut:
+90.0%
Median per capita income in Waterford in 2022:
Waterford:
$22,594
State:
$28,507
Change in median per capita income between 2000 and 2022:
Waterford, Connecticut:
+80.3%
Connecticut:
+117.2%
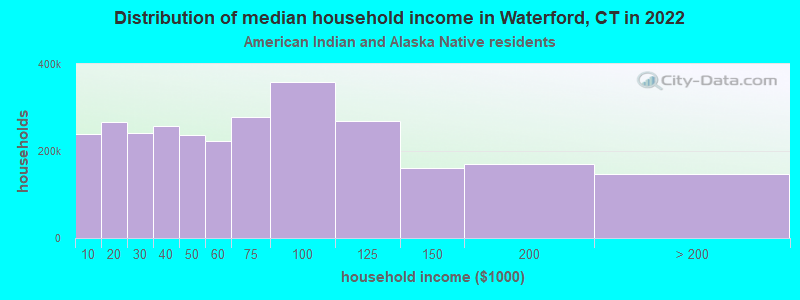
Income statistics for American Indian and Alaska Native residents
Median household income in Waterford, CT in 2022:
Waterford:
$94,574
Connecticut:
$41,848
Change in median household income between 2000 and 2022:
Waterford, Connecticut:
+12.9%
Connecticut:
+12.9%
Number of households with income < $10k:
Waterford:
8.4% (238,273)
Connecticut:
10.2% (340)
Number of households with income $10k - 20k:
Waterford:
9.4% (265,906)
State:
8.5% (283)
Number of households with income $20k - 30k:
Waterford:
8.5% (240,516)
State:
9.4% (314)
Number of households with income $30k - 40k:
Waterford:
9.1% (257,683)
Connecticut:
10.1% (337)
Number of households with income $40k - 50k:
Waterford:
8.3% (236,364)
Connecticut:
13.4% (447)
Number of households with income $50k - 60k:
Waterford:
7.8% (222,872)
State:
3.1% (104)
Number of households with income $60k - 75k:
Waterford:
9.8% (277,800)
Connecticut:
5.6% (188)
Number of households with income $75k - 100k:
Waterford:
12.6% (358,595)
State:
13.4% (447)
Number of households with income $100k - 125k:
Waterford:
9.4% (268,158)
State:
9.5% (317)
Number of households with income $125k - 150k:
Waterford:
5.6% (160,545)
State:
3.9% (131)
Number of households with income $150k - 200k:
Waterford:
6.0% (169,245)
State:
6.3% (212)
Number of households with income > $200k:
Waterford:
5.2% (146,491)
State:
6.8% (228)
Aggregate household income in Waterford in 2022: $5,941,212
Median family income in Waterford in 2022:
Waterford:
$114,873
State:
$57,217
Number of families with income $75k - 100k:
Waterford:
43.1% (38)
State:
17.4% (349)
Number of families with income $100k - 125k:
Waterford:
56.9% (50)
State:
7.9% (159)
Median non-family income in Waterford in 2022:
Waterford:
$27,624
State:
$40,310
Change in median non-family income between 2000 and 2022:
Waterford, Connecticut:
+125.1%
State:
+125.1%
Median per capita income in Waterford in 2022:
Waterford:
$51,921
State:
$25,355
Change in median per capita income between 2000 and 2022:
Waterford, Connecticut:
+45.9%
State:
+39.4%
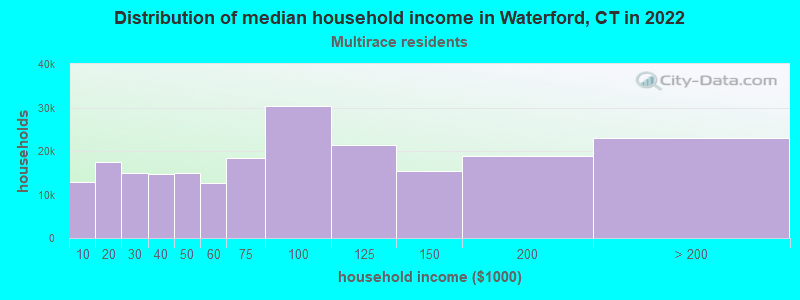
Income statistics for Multirace residents
Median household income in Waterford, CT in 2022:
Waterford:
$137,152
Connecticut:
$77,277
Change in median household income between 2000 and 2022:
Waterford, Connecticut:
+119.4%
State:
+113.6%
Number of households with income < $10k:
Waterford:
6.0% (12,880)
Connecticut:
6.0% (7,457)
Number of households with income $10k - 20k:
Waterford:
8.1% (17,512)
State:
8.1% (10,139)
Number of households with income $20k - 30k:
Waterford:
7.0% (15,030)
State:
7.0% (8,702)
Number of households with income $30k - 40k:
Waterford:
6.9% (14,761)
State:
6.9% (8,546)
Number of households with income $40k - 50k:
Waterford:
7.0% (15,048)
Connecticut:
7.0% (8,712)
Number of households with income $50k - 60k:
Waterford:
5.9% (12,662)
Connecticut:
5.9% (7,331)
Number of households with income $60k - 75k:
Waterford:
8.5% (18,367)
State:
8.5% (10,634)
Number of households with income $75k - 100k:
Waterford:
14.1% (30,398)
State:
14.1% (17,600)
Number of households with income $100k - 125k:
Waterford:
9.9% (21,388)
Connecticut:
9.9% (12,383)
Number of households with income $125k - 150k:
Waterford:
7.2% (15,408)
State:
7.2% (8,921)
Number of households with income $150k - 200k:
Waterford:
8.8% (18,864)
State:
8.8% (10,922)
Number of households with income > $200k:
Waterford:
10.6% (22,880)
State:
10.6% (13,247)
Aggregate household income in Waterford in 2022: $83,559,345
Median family income in Waterford in 2022:
Waterford:
$126,342
Connecticut:
$84,255
Number of families with income $10k - 20k:
Waterford:
5.4% (25)
Connecticut:
4.8% (4,079)
Number of families with income $30k - 40k:
Waterford:
9.9% (46)
State:
6.8% (5,759)
Number of families with income $40k - 50k:
Waterford:
2.5% (12)
State:
6.9% (5,792)
Number of families with income $50k - 60k:
Waterford:
10.8% (50)
State:
7.6% (6,420)
Number of families with income $60k - 75k:
Waterford:
1.6% (8)
State:
7.8% (6,550)
Number of families with income $75k - 100k:
Waterford:
37.3% (174)
State:
14.5% (12,236)
Number of families with income $150k - 200k:
Waterford:
32.6% (152)
State:
9.3% (7,818)
Median non-family income in Waterford in 2022:
Waterford:
$108,049
Connecticut:
$44,462
Change in median non-family income between 2000 and 2022:
Waterford, Connecticut:
+81.0%
State:
+97.6%
Median per capita income in Waterford in 2022:
Waterford:
$32,665
State:
$32,794
Change in median per capita income between 2000 and 2022:
Waterford, Connecticut:
+95.5%
State:
+117.2%
Income statistics for other residents
Number of households with income < $10k:
Waterford:
9.0% (19)
State:
9.0% (8,596)
Number of households with income $10k - 20k:
Waterford:
10.0% (21)
Connecticut:
10.2% (9,773)
Number of households with income $20k - 30k:
Waterford:
9.0% (19)
Connecticut:
9.1% (8,691)
Number of households with income $30k - 40k:
Waterford:
7.6% (16)
Connecticut:
7.8% (7,447)
Number of households with income $40k - 50k:
Waterford:
8.1% (17)
State:
8.2% (7,860)
Number of households with income $50k - 60k:
Waterford:
6.2% (13)
Connecticut:
6.0% (5,757)
Number of households with income $60k - 75k:
Waterford:
9.5% (20)
Connecticut:
9.3% (8,942)
Number of households with income $75k - 100k:
Waterford:
14.3% (30)
State:
14.3% (13,700)
Number of households with income $100k - 125k:
Waterford:
7.1% (15)
State:
7.2% (6,906)
Number of households with income $125k - 150k:
Waterford:
6.7% (14)
State:
6.5% (6,215)
Number of households with income $150k - 200k:
Waterford:
6.2% (13)
State:
6.1% (5,865)
Number of households with income > $200k:
Waterford:
6.2% (13)
Connecticut:
6.3% (6,065)
Aggregate household income in Waterford in 2022: $29,771,822
Median family income in Waterford in 2022:
Waterford:
$188,930
State:
$67,610
Number of families with income $50k - 60k:
Waterford:
4.3% (8)
Connecticut:
5.9% (3,868)
Number of families with income $60k - 75k:
Waterford:
21.7% (40)
State:
9.4% (6,232)
Number of families with income $75k - 100k:
Waterford:
51.9% (96)
Connecticut:
15.7% (10,362)
Number of families with income $100k - 125k:
Waterford:
22.1% (41)
Connecticut:
6.8% (4,502)
Median per capita income in Waterford in 2022:
Waterford:
$33,537
Connecticut:
$29,353
Discuss Waterford, Connecticut (CT) on our hugely popular Connecticut forum.