Ventura, California (CA) income map, earnings map, and wages data
The median household income in Ventura, CA in 2022 was $89,511, which was 2.3% less than the median annual income of $91,551 across the entire state of California. Compared to the median income of $52,070 in 2000 this represents an increase of 41.8%. The per capita income in 2022 was $48,559, which means an increase of 48.9% compared to 2000 when it was $24,809.
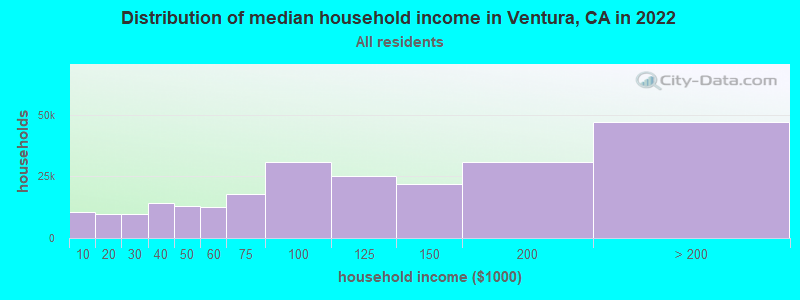
Income statistics for all residents
Median household income in Ventura, CA in 2022:| Ventura: | $89,511 |
| State: | $91,551 |
Change in median household income between 2000 and 2022:| Ventura, California: | +71.9% |
| State: | +92.8% |
Number of households with income < $10k:| Ventura: | 4.3% (10,373) |
| State: | 4.8% (654,370) |
Number of households with income $10k - 20k:| Ventura: | 4.0% (9,771) |
| California: | 5.8% (789,493) |
Number of households with income $20k - 30k:| Ventura: | 3.9% (9,580) |
| State: | 5.7% (778,318) |
Number of households with income $30k - 40k:| Ventura: | 5.9% (14,313) |
| State: | 5.8% (783,170) |
Number of households with income $40k - 50k:| Ventura: | 5.4% (13,177) |
| State: | 5.8% (781,352) |
Number of households with income $50k - 60k:| Ventura: | 5.2% (12,601) |
| State: | 5.6% (760,175) |
Number of households with income $60k - 75k:| Ventura: | 7.3% (17,746) |
| California: | 8.2% (1,104,699) |
Number of households with income $75k - 100k:| Ventura: | 12.6% (30,738) |
| State: | 12.0% (1,627,633) |
Number of households with income $100k - 125k:| Ventura: | 10.3% (25,091) |
| California: | 10.0% (1,358,619) |
Number of households with income $125k - 150k:| Ventura: | 9.0% (21,951) |
| State: | 7.6% (1,027,455) |
Number of households with income $150k - 200k:| Ventura: | 12.6% (30,734) |
| California: | 10.6% (1,439,811) |
Number of households with income > $200k:| Ventura: | 19.4% (47,085) |
| State: | 18.0% (2,445,491) |
Aggregate household income in Ventura in 2022: $38,986,195,200
Median family income in Ventura in 2022:| Ventura: | $108,277 |
| State: | $104,823 |
Median non-family income in Ventura in 2022:| Ventura: | $53,468 |
| State: | $59,348 |
Change in median non-family income between 2000 and 2022:| Ventura, California: | +59.7% |
| State: | +85.3% |
Median per capita income in Ventura in 2022:| Ventura: | $48,559 |
| State: | $46,661 |
Change in median per capita income between 2000 and 2022:| Ventura, California: | +95.7% |
| State: | +105.5% |
Income statistics for White residents
Median household income in Ventura, CA in 2022:| Ventura: | $89,032 |
| California: | $100,917 |
Change in median household income between 2000 and 2022:| Ventura, California: | +67.8% |
| State: | +96.8% |
Number of households with income < $10k:| Ventura: | 5.3% (7,876) |
| California: | 4.4% (284,109) |
Number of households with income $10k - 20k:| Ventura: | 4.3% (6,430) |
| California: | 5.3% (340,330) |
Number of households with income $20k - 30k:| Ventura: | 3.6% (5,375) |
| State: | 5.3% (343,145) |
Number of households with income $30k - 40k:| Ventura: | 5.4% (8,035) |
| California: | 5.1% (330,146) |
Number of households with income $40k - 50k:| Ventura: | 5.5% (8,210) |
| State: | 5.2% (335,310) |
Number of households with income $50k - 60k:| Ventura: | 4.9% (7,266) |
| State: | 5.1% (326,299) |
Number of households with income $60k - 75k:| Ventura: | 6.8% (10,133) |
| State: | 7.6% (487,640) |
Number of households with income $75k - 100k:| Ventura: | 12.5% (18,708) |
| California: | 11.5% (736,578) |
Number of households with income $100k - 125k:| Ventura: | 10.9% (16,292) |
| California: | 10.1% (648,782) |
Number of households with income $125k - 150k:| Ventura: | 8.9% (13,297) |
| State: | 7.8% (499,671) |
Number of households with income $150k - 200k:| Ventura: | 12.3% (18,463) |
| California: | 11.4% (729,603) |
Number of households with income > $200k:| Ventura: | 19.8% (29,699) |
| State: | 21.2% (1,364,246) |
Aggregate household income in Ventura in 2022: $24,954,090,700
Median family income in Ventura in 2022:| Ventura: | $114,040 |
| State: | $125,379 |
Number of families with income < $10k:| Ventura: | 3.0% (460) |
| State: | 2.2% (87,079) |
Number of families with income $10k - 20k:| Ventura: | 4.0% (620) |
| State: | 2.5% (97,716) |
Number of families with income $20k - 30k:| Ventura: | 3.0% (464) |
| State: | 3.5% (137,295) |
Number of families with income $30k - 40k:| Ventura: | 3.7% (573) |
| California: | 3.9% (152,947) |
Number of families with income $40k - 50k:| Ventura: | 4.8% (750) |
| California: | 4.3% (169,197) |
Number of families with income $50k - 60k:| Ventura: | 6.2% (955) |
| California: | 4.5% (176,192) |
Number of families with income $60k - 75k:| Ventura: | 9.3% (1,438) |
| California: | 7.0% (274,752) |
Number of families with income $75k - 100k:| Ventura: | 13.3% (2,065) |
| California: | 11.3% (445,632) |
Number of families with income $100k - 125k:| Ventura: | 12.1% (1,880) |
| State: | 10.7% (423,630) |
Number of families with income $125k - 150k:| Ventura: | 8.7% (1,343) |
| California: | 9.1% (357,408) |
Number of families with income $150k - 200k:| Ventura: | 14.3% (2,211) |
| State: | 13.5% (532,693) |
Number of families with income > $200k:| Ventura: | 17.6% (2,727) |
| California: | 27.6% (1,086,948) |
Median non-family income in Ventura in 2022:| Ventura: | $52,370 |
| State: | $62,819 |
Change in median non-family income between 2000 and 2022:| Ventura, California: | +57.0% |
| State: | +84.4% |
Median per capita income in Ventura in 2022:| Ventura: | $55,752 |
| California: | $61,706 |
Change in median per capita income between 2000 and 2022:| Ventura, California: | +102.1% |
| State: | +122.7% |
Income statistics for Black or African American residents
Median household income in Ventura, CA in 2022:| Ventura: | $85,440 |
| California: | $63,268 |
Change in median household income between 2000 and 2022:| Ventura, California: | +113.0% |
| State: | +81.0% |
Number of households with income < $10k:| Ventura: | 9.0% (41,983) |
| California: | 9.0% (73,219) |
Number of households with income $10k - 20k:| Ventura: | 10.6% (49,690) |
| State: | 10.6% (86,666) |
Number of households with income $20k - 30k:| Ventura: | 7.1% (33,089) |
| California: | 7.1% (57,719) |
Number of households with income $30k - 40k:| Ventura: | 7.2% (33,690) |
| State: | 7.2% (58,714) |
Number of households with income $40k - 50k:| Ventura: | 7.1% (33,281) |
| State: | 7.1% (58,075) |
Number of households with income $50k - 60k:| Ventura: | 6.8% (31,697) |
| State: | 6.8% (55,229) |
Number of households with income $60k - 75k:| Ventura: | 8.8% (41,190) |
| State: | 8.8% (71,895) |
Number of households with income $75k - 100k:| Ventura: | 11.9% (55,548) |
| State: | 11.9% (96,893) |
Number of households with income $100k - 125k:| Ventura: | 8.7% (40,515) |
| State: | 8.7% (70,729) |
Number of households with income $125k - 150k:| Ventura: | 6.3% (29,376) |
| State: | 6.3% (51,211) |
Number of households with income $150k - 200k:| Ventura: | 7.2% (33,650) |
| California: | 7.2% (58,687) |
Number of households with income > $200k:| Ventura: | 9.3% (43,249) |
| State: | 9.3% (75,487) |
Aggregate household income in Ventura in 2022: $60,288,959
Median family income in Ventura in 2022:| Ventura: | $87,816 |
| California: | $77,263 |
Number of families with income < $10k:| Ventura: | 5.8% (21) |
| State: | 5.9% (27,037) |
Number of families with income $10k - 20k:| Ventura: | 2.3% (8) |
| State: | 6.4% (29,505) |
Number of families with income $20k - 30k:| Ventura: | 10.9% (39) |
| California: | 5.6% (25,755) |
Number of families with income $30k - 40k:| Ventura: | 5.4% (19) |
| State: | 6.8% (30,948) |
Number of families with income $40k - 50k:| Ventura: | 16.3% (57) |
| State: | 8.3% (38,171) |
Number of families with income $50k - 60k:| Ventura: | 9.4% (33) |
| State: | 7.0% (31,860) |
Number of families with income $60k - 75k:| Ventura: | 21.0% (74) |
| California: | 8.7% (40,021) |
Number of families with income $75k - 100k:| Ventura: | 3.2% (11) |
| State: | 12.4% (56,846) |
Number of families with income $100k - 125k:| Ventura: | 11.3% (40) |
| California: | 9.8% (44,911) |
Number of families with income $125k - 150k:| Ventura: | 14.5% (51) |
| State: | 7.5% (34,434) |
Median non-family income in Ventura in 2022:| Ventura: | $37,178 |
| State: | $41,942 |
Change in median non-family income between 2000 and 2022:| Ventura, California: | +89.8% |
| State: | +72.0% |
Median per capita income in Ventura in 2022:| Ventura: | $48,949 |
| California: | $36,708 |
Income statistics for Asian residents
Median household income in Ventura, CA in 2022:| Ventura: | $117,940 |
| State: | $119,861 |
Change in median household income between 2000 and 2022:| Ventura, California: | +107.6% |
| State: | +116.5% |
Number of households with income < $10k:| Ventura: | 4.3% (707) |
| State: | 5.1% (106,273) |
Number of households with income $10k - 20k:| Ventura: | 1.7% (284) |
| California: | 4.9% (101,815) |
Number of households with income $20k - 30k:| Ventura: | 2.6% (421) |
| California: | 4.6% (94,414) |
Number of households with income $30k - 40k:| Ventura: | 3.6% (591) |
| State: | 4.1% (84,491) |
Number of households with income $40k - 50k:| Ventura: | 2.7% (435) |
| California: | 4.0% (81,758) |
Number of households with income $50k - 60k:| Ventura: | 5.5% (897) |
| California: | 3.9% (80,971) |
Number of households with income $60k - 75k:| Ventura: | 5.4% (886) |
| State: | 6.0% (124,194) |
Number of households with income $75k - 100k:| Ventura: | 5.8% (947) |
| State: | 9.7% (200,337) |
Number of households with income $100k - 125k:| Ventura: | 9.2% (1,505) |
| State: | 9.4% (193,488) |
Number of households with income $125k - 150k:| Ventura: | 10.0% (1,633) |
| State: | 7.7% (158,253) |
Number of households with income $150k - 200k:| Ventura: | 17.1% (2,800) |
| California: | 12.2% (252,139) |
Number of households with income > $200k:| Ventura: | 32.3% (5,293) |
| California: | 28.4% (586,641) |
Aggregate household income in Ventura in 2022: $285,280,623
Median family income in Ventura in 2022:| Ventura: | $131,494 |
| State: | $136,040 |
Number of families with income < $10k:| Ventura: | 10.5% (114) |
| State: | 2.8% (42,046) |
Number of families with income $10k - 20k:| Ventura: | 0.6% (6) |
| State: | 3.1% (46,821) |
Number of families with income $20k - 30k:| Ventura: | 0.7% (7) |
| State: | 4.1% (61,519) |
Number of families with income $30k - 40k:| Ventura: | 3.8% (42) |
| State: | 3.7% (55,234) |
Number of families with income $40k - 50k:| Ventura: | 4.0% (43) |
| State: | 3.9% (58,471) |
Number of families with income $50k - 60k:| Ventura: | 9.4% (102) |
| State: | 3.9% (58,911) |
Number of families with income $60k - 75k:| Ventura: | 3.9% (42) |
| State: | 5.9% (88,675) |
Number of families with income $75k - 100k:| Ventura: | 6.8% (74) |
| State: | 9.5% (143,103) |
Number of families with income $100k - 125k:| Ventura: | 6.9% (75) |
| State: | 9.4% (142,085) |
Number of families with income $125k - 150k:| Ventura: | 13.7% (149) |
| State: | 8.0% (120,635) |
Number of families with income $150k - 200k:| Ventura: | 12.1% (131) |
| California: | 13.2% (198,099) |
Number of families with income > $200k:| Ventura: | 27.7% (301) |
| State: | 32.5% (489,303) |
Median non-family income in Ventura in 2022:| Ventura: | $59,774 |
| California: | $74,216 |
Change in median non-family income between 2000 and 2022:| Ventura, California: | +84.9% |
| State: | +136.3% |
Median per capita income in Ventura in 2022:| Ventura: | $62,630 |
| California: | $58,824 |
Income statistics for Hispanic or Latino residents
Median household income in Ventura, CA in 2022:| Ventura: | $77,756 |
| California: | $75,698 |
Change in median household income between 2000 and 2022:| Ventura, California: | +84.0% |
| State: | +107.2% |
Number of households with income < $10k:| Ventura: | 2.1% (1,671) |
| State: | 4.3% (183,294) |
Number of households with income $10k - 20k:| Ventura: | 5.3% (4,237) |
| State: | 6.0% (253,903) |
Number of households with income $20k - 30k:| Ventura: | 4.9% (3,925) |
| State: | 6.8% (286,386) |
Number of households with income $30k - 40k:| Ventura: | 7.7% (6,216) |
| State: | 7.4% (313,728) |
Number of households with income $40k - 50k:| Ventura: | 7.6% (6,117) |
| State: | 7.4% (313,199) |
Number of households with income $50k - 60k:| Ventura: | 6.8% (5,462) |
| California: | 7.2% (305,366) |
Number of households with income $60k - 75k:| Ventura: | 9.9% (7,983) |
| California: | 10.3% (434,937) |
Number of households with income $75k - 100k:| Ventura: | 13.7% (11,040) |
| State: | 14.4% (607,302) |
Number of households with income $100k - 125k:| Ventura: | 9.1% (7,304) |
| California: | 10.6% (447,424) |
Number of households with income $125k - 150k:| Ventura: | 9.2% (7,413) |
| California: | 7.5% (316,022) |
Number of households with income $150k - 200k:| Ventura: | 11.7% (9,414) |
| State: | 9.2% (386,269) |
Number of households with income > $200k:| Ventura: | 12.2% (9,834) |
| State: | 8.8% (372,651) |
Aggregate household income in Ventura in 2022: $1,560,185,955
Median family income in Ventura in 2022:| Ventura: | $79,473 |
| California: | $77,589 |
Number of families with income < $10k:| Ventura: | 3.1% (339) |
| California: | 3.9% (129,468) |
Number of families with income $10k - 20k:| Ventura: | 6.1% (669) |
| State: | 4.6% (151,997) |
Number of families with income $20k - 30k:| Ventura: | 5.9% (645) |
| State: | 6.6% (216,764) |
Number of families with income $30k - 40k:| Ventura: | 8.0% (878) |
| State: | 7.6% (249,849) |
Number of families with income $40k - 50k:| Ventura: | 8.4% (919) |
| State: | 7.7% (254,822) |
Number of families with income $50k - 60k:| Ventura: | 9.3% (1,020) |
| State: | 7.4% (244,815) |
Number of families with income $60k - 75k:| Ventura: | 13.9% (1,526) |
| State: | 10.5% (345,838) |
Number of families with income $75k - 100k:| Ventura: | 13.5% (1,482) |
| State: | 14.9% (491,589) |
Number of families with income $100k - 125k:| Ventura: | 8.1% (892) |
| State: | 10.7% (355,400) |
Number of families with income $125k - 150k:| Ventura: | 7.5% (825) |
| State: | 7.8% (259,317) |
Number of families with income $150k - 200k:| Ventura: | 9.6% (1,060) |
| California: | 9.3% (306,566) |
Number of families with income > $200k:| Ventura: | 6.8% (750) |
| State: | 9.1% (299,984) |
Median non-family income in Ventura in 2022:| Ventura: | $53,764 |
| California: | $49,746 |
Change in median non-family income between 2000 and 2022:| Ventura, California: | +60.7% |
| State: | +100.7% |
Median per capita income in Ventura in 2022:| Ventura: | $30,689 |
| California: | $27,240 |
Change in median per capita income between 2000 and 2022:| Ventura, California: | +133.5% |
| State: | +133.3% |
Income statistics for American Indian and Alaska Native residents
Median household income in Ventura, CA in 2022:| Ventura: | $72,693 |
| State: | $76,752 |
Change in median household income between 2000 and 2022:| Ventura, California: | +92.2% |
| State: | +110.0% |
Number of households with income < $10k:| Ventura: | 5.4% (4,363) |
| California: | 5.4% (8,471) |
Number of households with income $10k - 20k:| Ventura: | 6.0% (4,815) |
| State: | 6.0% (9,381) |
Number of households with income $20k - 30k:| Ventura: | 5.6% (4,522) |
| California: | 5.5% (8,668) |
Number of households with income $30k - 40k:| Ventura: | 8.2% (6,635) |
| State: | 8.3% (13,030) |
Number of households with income $40k - 50k:| Ventura: | 7.0% (5,614) |
| State: | 6.9% (10,908) |
Number of households with income $50k - 60k:| Ventura: | 7.1% (5,738) |
| State: | 7.1% (11,198) |
Number of households with income $60k - 75k:| Ventura: | 9.6% (7,751) |
| State: | 9.6% (15,190) |
Number of households with income $75k - 100k:| Ventura: | 14.0% (11,322) |
| State: | 14.1% (22,274) |
Number of households with income $100k - 125k:| Ventura: | 11.3% (9,096) |
| State: | 11.2% (17,643) |
Number of households with income $125k - 150k:| Ventura: | 8.3% (6,665) |
| State: | 8.3% (13,117) |
Number of households with income $150k - 200k:| Ventura: | 8.8% (7,083) |
| California: | 8.8% (13,853) |
Number of households with income > $200k:| Ventura: | 8.8% (7,112) |
| California: | 8.8% (13,925) |
Aggregate household income in Ventura in 2022: $48,807,262
Median family income in Ventura in 2022:| Ventura: | $56,988 |
| State: | $81,108 |
Number of families with income < $10k:| Ventura: | 11.9% (37) |
| California: | 5.0% (5,711) |
Number of families with income $10k - 20k:| Ventura: | 1.9% (6) |
| State: | 3.7% (4,148) |
Number of families with income $20k - 30k:| Ventura: | 3.2% (10) |
| State: | 4.3% (4,876) |
Number of families with income $30k - 40k:| Ventura: | 12.2% (38) |
| California: | 8.8% (9,994) |
Number of families with income $40k - 50k:| Ventura: | 3.5% (11) |
| State: | 7.8% (8,776) |
Number of families with income $50k - 60k:| Ventura: | 5.4% (17) |
| California: | 6.9% (7,834) |
Number of families with income $60k - 75k:| Ventura: | 8.8% (28) |
| California: | 9.1% (10,247) |
Number of families with income $75k - 100k:| Ventura: | 5.0% (16) |
| California: | 14.8% (16,731) |
Number of families with income $100k - 125k:| Ventura: | 29.8% (93) |
| State: | 12.0% (13,609) |
Number of families with income $150k - 200k:| Ventura: | 18.2% (57) |
| California: | 9.5% (10,721) |
Median non-family income in Ventura in 2022:| Ventura: | $56,047 |
| State: | $51,296 |
Change in median non-family income between 2000 and 2022:| Ventura, California: | +22.4% |
| State: | +114.0% |
Median per capita income in Ventura in 2022:| Ventura: | $27,519 |
| California: | $30,289 |
Change in median per capita income between 2000 and 2022:| Ventura, California: | +47.3% |
| California: | +98.9% |
Income statistics for Multirace residents
Median household income in Ventura, CA in 2022:| Ventura: | $87,048 |
| State: | $83,153 |
Change in median household income between 2000 and 2022:| Ventura, California: | +81.9% |
| State: | +106.0% |
Number of households with income < $10k:| Ventura: | 2.4% (1,097) |
| California: | 4.2% (85,299) |
Number of households with income $10k - 20k:| Ventura: | 4.1% (1,867) |
| State: | 6.1% (122,966) |
Number of households with income $20k - 30k:| Ventura: | 5.2% (2,360) |
| State: | 6.4% (129,328) |
Number of households with income $30k - 40k:| Ventura: | 7.4% (3,345) |
| State: | 6.4% (130,070) |
Number of households with income $40k - 50k:| Ventura: | 6.2% (2,836) |
| State: | 6.5% (131,254) |
Number of households with income $50k - 60k:| Ventura: | 5.9% (2,692) |
| State: | 6.5% (132,382) |
Number of households with income $60k - 75k:| Ventura: | 8.3% (3,781) |
| California: | 9.4% (191,472) |
Number of households with income $75k - 100k:| Ventura: | 13.9% (6,309) |
| California: | 13.3% (269,691) |
Number of households with income $100k - 125k:| Ventura: | 8.8% (4,000) |
| California: | 10.2% (207,286) |
Number of households with income $125k - 150k:| Ventura: | 9.3% (4,239) |
| State: | 7.8% (158,259) |
Number of households with income $150k - 200k:| Ventura: | 12.7% (5,779) |
| California: | 10.3% (209,227) |
Number of households with income > $200k:| Ventura: | 15.8% (7,193) |
| State: | 13.0% (263,210) |
Aggregate household income in Ventura in 2022: $995,088,955
Median family income in Ventura in 2022:| Ventura: | $88,593 |
| State: | $87,642 |
Number of families with income < $10k:| Ventura: | 4.2% (218) |
| California: | 3.2% (48,017) |
Number of families with income $10k - 20k:| Ventura: | 3.5% (184) |
| State: | 4.1% (60,419) |
Number of families with income $20k - 30k:| Ventura: | 6.6% (347) |
| State: | 6.1% (89,742) |
Number of families with income $30k - 40k:| Ventura: | 5.1% (269) |
| California: | 6.2% (91,415) |
Number of families with income $40k - 50k:| Ventura: | 6.6% (346) |
| California: | 6.8% (100,085) |
Number of families with income $50k - 60k:| Ventura: | 8.2% (428) |
| State: | 6.7% (98,298) |
Number of families with income $60k - 75k:| Ventura: | 7.6% (397) |
| California: | 9.5% (140,131) |
Number of families with income $75k - 100k:| Ventura: | 15.4% (808) |
| California: | 13.8% (203,439) |
Number of families with income $100k - 125k:| Ventura: | 6.9% (363) |
| State: | 10.4% (153,515) |
Number of families with income $125k - 150k:| Ventura: | 11.3% (591) |
| State: | 8.4% (124,115) |
Number of families with income $150k - 200k:| Ventura: | 8.3% (435) |
| State: | 10.9% (161,643) |
Number of families with income > $200k:| Ventura: | 16.4% (863) |
| State: | 14.0% (207,317) |
Median non-family income in Ventura in 2022:| Ventura: | $52,195 |
| California: | $56,558 |
Change in median non-family income between 2000 and 2022:| Ventura, California: | +47.2% |
| California: | +100.2% |
Median per capita income in Ventura in 2022:| Ventura: | $29,585 |
| State: | $32,124 |
Change in median per capita income between 2000 and 2022:| Ventura, California: | +106.9% |
| State: | +120.4% |
Income statistics for other residents
Number of households with income < $10k:| Ventura: | 2.3% (60) |
| California: | 4.6% (93,035) |
Number of households with income $10k - 20k:| Ventura: | 3.8% (101) |
| State: | 6.3% (126,222) |
Number of households with income $20k - 30k:| Ventura: | 4.0% (106) |
| State: | 7.1% (142,656) |
Number of households with income $30k - 40k:| Ventura: | 8.9% (235) |
| State: | 8.2% (165,018) |
Number of households with income $40k - 50k:| Ventura: | 5.8% (154) |
| California: | 8.0% (161,732) |
Number of households with income $50k - 60k:| Ventura: | 6.4% (168) |
| California: | 7.6% (152,152) |
Number of households with income $60k - 75k:| Ventura: | 10.4% (275) |
| California: | 10.4% (209,951) |
Number of households with income $75k - 100k:| Ventura: | 16.4% (433) |
| California: | 14.7% (296,102) |
Number of households with income $100k - 125k:| Ventura: | 10.1% (267) |
| State: | 10.7% (214,281) |
Number of households with income $125k - 150k:| Ventura: | 7.7% (202) |
| California: | 7.1% (143,092) |
Number of households with income $150k - 200k:| Ventura: | 13.0% (342) |
| State: | 8.6% (172,215) |
Number of households with income > $200k:| Ventura: | 11.1% (293) |
| California: | 6.7% (134,102) |
Aggregate household income in Ventura in 2022: $293,199,987
Median family income in Ventura in 2022:| Ventura: | $81,683 |
| California: | $72,756 |
Number of families with income < $10k:| Ventura: | 3.8% (82) |
| California: | 4.3% (69,090) |
Number of families with income $10k - 20k:| Ventura: | 2.8% (60) |
| State: | 5.1% (82,116) |
Number of families with income $20k - 30k:| Ventura: | 3.0% (64) |
| California: | 7.0% (112,854) |
Number of families with income $30k - 40k:| Ventura: | 13.1% (283) |
| State: | 8.4% (135,938) |
Number of families with income $40k - 50k:| Ventura: | 4.8% (102) |
| State: | 8.4% (135,353) |
Number of families with income $50k - 60k:| Ventura: | 6.8% (145) |
| State: | 7.7% (124,826) |
Number of families with income $60k - 75k:| Ventura: | 13.5% (291) |
| State: | 10.7% (173,628) |
Number of families with income $75k - 100k:| Ventura: | 16.9% (365) |
| State: | 15.2% (245,724) |
Number of families with income $100k - 125k:| Ventura: | 8.0% (173) |
| State: | 10.9% (176,716) |
Number of families with income $125k - 150k:| Ventura: | 12.1% (260) |
| California: | 7.4% (119,985) |
Number of families with income $150k - 200k:| Ventura: | 9.6% (207) |
| State: | 8.5% (137,332) |
Number of families with income > $200k:| Ventura: | 5.6% (120) |
| California: | 6.6% (106,346) |
Median non-family income in Ventura in 2022:| Ventura: | $78,109 |
| California: | $43,881 |
Change in median non-family income between 2000 and 2022:| Ventura, California: | +118.4% |
| California: | +84.6% |
Median per capita income in Ventura in 2022:| Ventura: | $33,443 |
| California: | $25,164 |