Tolland, Connecticut (CT) income map, earnings map, and wages data
The median household income in Tolland, CT in 2022 was $130,968, which was 32.5% greater than the median annual income of $88,429 across the entire state of Connecticut. Compared to the median income of $77,398 in 2000 this represents an increase of 40.9%. The per capita income in 2022 was $54,681, which means an increase of 45.3% compared to 2000 when it was $29,892.
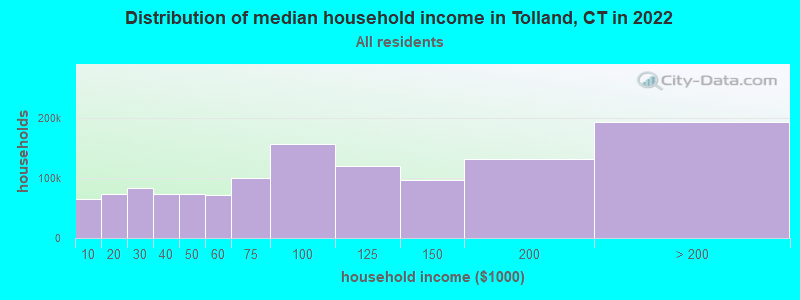
Income statistics for all residents
Median household income in Tolland, CT in 2022:| Tolland: | $130,968 |
| State: | $88,429 |
Change in median household income between 2000 and 2022:| Tolland, Connecticut: | +69.2% |
| State: | +64.0% |
Number of households with income < $10k:| Tolland: | 5.2% (53,346) |
| Connecticut: | 5.1% (72,746) |
Number of households with income $10k - 20k:| Tolland: | 5.8% (60,155) |
| Connecticut: | 5.7% (81,643) |
Number of households with income $20k - 30k:| Tolland: | 6.6% (68,091) |
| State: | 6.5% (92,844) |
Number of households with income $30k - 40k:| Tolland: | 5.9% (61,107) |
| State: | 5.9% (83,934) |
Number of households with income $40k - 50k:| Tolland: | 5.9% (60,715) |
| Connecticut: | 5.8% (83,025) |
Number of households with income $50k - 60k:| Tolland: | 5.8% (59,534) |
| Connecticut: | 5.7% (81,788) |
Number of households with income $60k - 75k:| Tolland: | 8.1% (83,415) |
| State: | 8.1% (115,651) |
Number of households with income $75k - 100k:| Tolland: | 12.6% (130,276) |
| State: | 12.6% (180,173) |
Number of households with income $100k - 125k:| Tolland: | 9.8% (101,418) |
| State: | 9.9% (141,231) |
Number of households with income $125k - 150k:| Tolland: | 7.8% (80,992) |
| Connecticut: | 7.9% (112,826) |
Number of households with income $150k - 200k:| Tolland: | 10.7% (110,791) |
| State: | 10.8% (154,641) |
Number of households with income > $200k:| Tolland: | 16.0% (165,515) |
| Connecticut: | 16.3% (233,133) |
Aggregate household income in Tolland in 2022: $16,757,818,632
Median family income in Tolland in 2022:| Tolland: | $148,220 |
| State: | $115,183 |
Median non-family income in Tolland in 2022:| Tolland: | $73,829 |
| State: | $50,964 |
Change in median non-family income between 2000 and 2022:| Tolland, Connecticut: | +71.5% |
| State: | +65.1% |
Median per capita income in Tolland in 2022:| Tolland: | $54,681 |
| State: | $51,581 |
Change in median per capita income between 2000 and 2022:| Tolland, Connecticut: | +82.9% |
| State: | +79.3% |
Income statistics for White residents
Median household income in Tolland, CT in 2022:| Tolland: | $131,140 |
| State: | $96,890 |
Change in median household income between 2000 and 2022:| Tolland, Connecticut: | +69.4% |
| Connecticut: | +68.5% |
Number of households with income < $10k:| Tolland: | 4.2% (28,683) |
| Connecticut: | 4.2% (42,265) |
Number of households with income $10k - 20k:| Tolland: | 4.9% (32,977) |
| State: | 4.8% (48,323) |
Number of households with income $20k - 30k:| Tolland: | 5.8% (39,219) |
| State: | 5.7% (57,716) |
Number of households with income $30k - 40k:| Tolland: | 5.4% (36,303) |
| State: | 5.3% (53,827) |
Number of households with income $40k - 50k:| Tolland: | 5.3% (36,153) |
| State: | 5.3% (53,301) |
Number of households with income $50k - 60k:| Tolland: | 5.6% (37,623) |
| Connecticut: | 5.5% (55,690) |
Number of households with income $60k - 75k:| Tolland: | 7.9% (53,766) |
| Connecticut: | 8.0% (80,329) |
Number of households with income $75k - 100k:| Tolland: | 12.7% (86,154) |
| Connecticut: | 12.7% (128,070) |
Number of households with income $100k - 125k:| Tolland: | 10.0% (67,651) |
| Connecticut: | 10.0% (101,210) |
Number of households with income $125k - 150k:| Tolland: | 8.0% (54,312) |
| Connecticut: | 8.0% (81,250) |
Number of households with income $150k - 200k:| Tolland: | 11.8% (79,860) |
| State: | 11.8% (119,527) |
Number of households with income > $200k:| Tolland: | 18.4% (125,018) |
| State: | 18.6% (187,875) |
Aggregate household income in Tolland in 2022: $12,463,329,624
Median family income in Tolland in 2022:| Tolland: | $152,190 |
| Connecticut: | $128,955 |
Number of families with income < $10k:| Tolland: | 1.1% (38) |
| State: | 1.9% (11,537) |
Number of families with income $10k - 20k:| Tolland: | 0.5% (16) |
| State: | 1.8% (11,289) |
Number of families with income $20k - 30k:| Tolland: | 1.3% (45) |
| Connecticut: | 3.0% (18,506) |
Number of families with income $30k - 40k:| Tolland: | 1.7% (58) |
| Connecticut: | 2.9% (18,160) |
Number of families with income $40k - 50k:| Tolland: | 3.4% (113) |
| State: | 3.9% (24,550) |
Number of families with income $50k - 60k:| Tolland: | 3.6% (121) |
| Connecticut: | 4.3% (26,723) |
Number of families with income $60k - 75k:| Tolland: | 8.0% (266) |
| Connecticut: | 7.1% (44,075) |
Number of families with income $75k - 100k:| Tolland: | 14.7% (490) |
| Connecticut: | 12.5% (77,679) |
Number of families with income $100k - 125k:| Tolland: | 20.1% (673) |
| State: | 11.1% (69,086) |
Number of families with income $125k - 150k:| Tolland: | 13.0% (434) |
| Connecticut: | 9.6% (59,616) |
Number of families with income $150k - 200k:| Tolland: | 17.7% (593) |
| Connecticut: | 15.7% (97,890) |
Number of families with income > $200k:| Tolland: | 14.8% (494) |
| State: | 26.3% (163,417) |
Median non-family income in Tolland in 2022:| Tolland: | $76,344 |
| State: | $54,067 |
Change in median non-family income between 2000 and 2022:| Tolland, Connecticut: | +73.7% |
| State: | +68.7% |
Median per capita income in Tolland in 2022:| Tolland: | $57,436 |
| State: | $59,916 |
Change in median per capita income between 2000 and 2022:| Tolland, Connecticut: | +92.1% |
| State: | +90.2% |
Income statistics for Black or African American residents
Median household income in Tolland, CT in 2022:| Tolland: | $121,569 |
| State: | $61,803 |
Change in median household income between 2000 and 2022:| Tolland, Connecticut: | +60.9% |
| State: | +76.1% |
Number of households with income < $10k:| Tolland: | 6.8% (20,433) |
| State: | 6.8% (9,494) |
Number of households with income $10k - 20k:| Tolland: | 7.9% (23,681) |
| Connecticut: | 7.9% (11,003) |
Number of households with income $20k - 30k:| Tolland: | 10.8% (32,381) |
| State: | 10.8% (15,045) |
Number of households with income $30k - 40k:| Tolland: | 8.2% (24,753) |
| Connecticut: | 8.2% (11,501) |
Number of households with income $40k - 50k:| Tolland: | 7.4% (22,418) |
| State: | 7.4% (10,416) |
Number of households with income $50k - 60k:| Tolland: | 7.5% (22,672) |
| State: | 7.5% (10,534) |
Number of households with income $60k - 75k:| Tolland: | 8.0% (24,200) |
| State: | 8.0% (11,244) |
Number of households with income $75k - 100k:| Tolland: | 9.6% (28,775) |
| State: | 9.6% (13,370) |
Number of households with income $100k - 125k:| Tolland: | 10.2% (30,656) |
| State: | 10.2% (14,244) |
Number of households with income $125k - 150k:| Tolland: | 8.0% (24,204) |
| Connecticut: | 8.0% (11,246) |
Number of households with income $150k - 200k:| Tolland: | 7.7% (23,087) |
| State: | 7.7% (10,727) |
Number of households with income > $200k:| Tolland: | 7.9% (23,860) |
| State: | 7.9% (11,086) |
Aggregate household income in Tolland in 2022: $15,733,917
Median family income in Tolland in 2022:| Tolland: | $170,723 |
| State: | $87,228 |
Number of families with income $60k - 75k:| Tolland: | 17.6% (6) |
| Connecticut: | 8.2% (6,861) |
Number of families with income $75k - 100k:| Tolland: | 82.4% (28) |
| Connecticut: | 12.7% (10,598) |
Median non-family income in Tolland in 2022:| Tolland: | $59,730 |
| State: | $38,608 |
Change in median non-family income between 2000 and 2022:| Tolland, Connecticut: | +77.0% |
| State: | +77.0% |
Median per capita income in Tolland in 2022:| Tolland: | $65,503 |
| Connecticut: | $36,289 |
Change in median per capita income between 2000 and 2022:| Tolland, Connecticut: | +115.2% |
| Connecticut: | +117.5% |
Income statistics for Asian residents
Median household income in Tolland, CT in 2022:| Tolland: | $264,273 |
| State: | $110,568 |
Change in median household income between 2000 and 2022:| Tolland, Connecticut: | +110.1% |
| State: | +79.5% |
Number of households with income < $10k:| Tolland: | 7.1% (8,670) |
| State: | 7.1% (4,245) |
Number of households with income $10k - 20k:| Tolland: | 3.5% (4,263) |
| State: | 3.5% (2,087) |
Number of households with income $20k - 30k:| Tolland: | 4.1% (5,033) |
| State: | 4.1% (2,464) |
Number of households with income $30k - 40k:| Tolland: | 4.1% (5,061) |
| Connecticut: | 4.1% (2,478) |
Number of households with income $40k - 50k:| Tolland: | 3.3% (4,050) |
| State: | 3.3% (1,983) |
Number of households with income $50k - 60k:| Tolland: | 3.9% (4,755) |
| Connecticut: | 3.9% (2,328) |
Number of households with income $60k - 75k:| Tolland: | 7.0% (8,636) |
| State: | 7.0% (4,228) |
Number of households with income $75k - 100k:| Tolland: | 11.5% (14,116) |
| Connecticut: | 11.5% (6,911) |
Number of households with income $100k - 125k:| Tolland: | 10.2% (12,514) |
| Connecticut: | 10.2% (6,127) |
Number of households with income $125k - 150k:| Tolland: | 8.5% (10,374) |
| Connecticut: | 8.5% (5,079) |
Number of households with income $150k - 200k:| Tolland: | 12.4% (15,184) |
| Connecticut: | 12.4% (7,434) |
Number of households with income > $200k:| Tolland: | 24.4% (29,945) |
| State: | 24.4% (14,661) |
Aggregate household income in Tolland in 2022: $11,029,332
Median family income in Tolland in 2022:| Tolland: | $264,560 |
| State: | $134,548 |
Number of families with income $125k - 150k:| Tolland: | 100.0% (48) |
| Connecticut: | 8.2% (3,588) |
Median non-family income in Tolland in 2022:| Tolland: | $46,610 |
| Connecticut: | $63,785 |
Change in median non-family income between 2000 and 2022:| Tolland, Connecticut: | +148.6% |
| State: | +77.9% |
Median per capita income in Tolland in 2022:| Tolland: | $74,804 |
| Connecticut: | $55,295 |
Change in median per capita income between 2000 and 2022:| Tolland, Connecticut: | +103.6% |
| State: | +97.8% |
Income statistics for Hispanic or Latino residents
Median household income in Tolland, CT in 2022:| Tolland: | $136,697 |
| State: | $60,275 |
Change in median household income between 2000 and 2022:| Tolland, Connecticut: | +67.8% |
| State: | +87.9% |
Number of households with income < $10k:| Tolland: | 8.7% (47,201) |
| State: | 8.7% (18,584) |
Number of households with income $10k - 20k:| Tolland: | 9.1% (48,854) |
| State: | 9.1% (19,235) |
Number of households with income $20k - 30k:| Tolland: | 8.9% (48,230) |
| State: | 8.9% (18,989) |
Number of households with income $30k - 40k:| Tolland: | 7.5% (40,554) |
| State: | 7.5% (15,967) |
Number of households with income $40k - 50k:| Tolland: | 8.7% (46,902) |
| State: | 8.7% (18,466) |
Number of households with income $50k - 60k:| Tolland: | 6.9% (37,352) |
| State: | 6.9% (14,706) |
Number of households with income $60k - 75k:| Tolland: | 8.9% (47,973) |
| State: | 8.9% (18,888) |
Number of households with income $75k - 100k:| Tolland: | 13.5% (72,816) |
| State: | 13.5% (28,669) |
Number of households with income $100k - 125k:| Tolland: | 8.2% (44,280) |
| State: | 8.2% (17,434) |
Number of households with income $125k - 150k:| Tolland: | 6.5% (34,929) |
| Connecticut: | 6.5% (13,752) |
Number of households with income $150k - 200k:| Tolland: | 6.6% (35,848) |
| State: | 6.6% (14,114) |
Number of households with income > $200k:| Tolland: | 6.4% (34,619) |
| Connecticut: | 6.4% (13,630) |
Aggregate household income in Tolland in 2022: $19,231,139
Median family income in Tolland in 2022:| Tolland: | $139,374 |
| State: | $68,336 |
Number of families with income < $10k:| Tolland: | 2.8% (19) |
| State: | 5.2% (7,456) |
Number of families with income $10k - 20k:| Tolland: | 1.4% (10) |
| State: | 6.0% (8,616) |
Number of families with income $20k - 30k:| Tolland: | 5.0% (34) |
| Connecticut: | 8.9% (12,680) |
Number of families with income $30k - 40k:| Tolland: | 4.9% (33) |
| Connecticut: | 8.5% (12,090) |
Number of families with income $40k - 50k:| Tolland: | 8.3% (57) |
| State: | 8.8% (12,624) |
Number of families with income $50k - 60k:| Tolland: | 8.3% (57) |
| State: | 8.4% (11,924) |
Number of families with income $60k - 75k:| Tolland: | 10.6% (72) |
| Connecticut: | 8.9% (12,677) |
Number of families with income $75k - 100k:| Tolland: | 18.8% (128) |
| State: | 14.3% (20,457) |
Number of families with income $100k - 125k:| Tolland: | 15.8% (107) |
| State: | 8.2% (11,720) |
Number of families with income $125k - 150k:| Tolland: | 11.7% (79) |
| State: | 8.2% (11,729) |
Number of families with income $150k - 200k:| Tolland: | 8.2% (56) |
| Connecticut: | 7.1% (10,096) |
Number of families with income > $200k:| Tolland: | 4.1% (28) |
| Connecticut: | 7.4% (10,622) |
Median per capita income in Tolland in 2022:| Tolland: | $36,571 |
| State: | $28,507 |
Change in median per capita income between 2000 and 2022:| Tolland, Connecticut: | +80.3% |
| State: | +117.2% |
Income statistics for American Indian and Alaska Native residents
Number of households with income < $10k:| Tolland: | 8.4% (76,766) |
| State: | 10.2% (340) |
Number of households with income $10k - 20k:| Tolland: | 9.4% (85,668) |
| State: | 8.5% (283) |
Number of households with income $20k - 30k:| Tolland: | 8.5% (77,488) |
| State: | 9.4% (314) |
Number of households with income $30k - 40k:| Tolland: | 9.1% (83,019) |
| State: | 10.1% (337) |
Number of households with income $40k - 50k:| Tolland: | 8.3% (76,150) |
| Connecticut: | 13.4% (447) |
Number of households with income $50k - 60k:| Tolland: | 7.8% (71,804) |
| State: | 3.1% (104) |
Number of households with income $60k - 75k:| Tolland: | 9.8% (89,500) |
| State: | 5.6% (188) |
Number of households with income $75k - 100k:| Tolland: | 12.6% (115,530) |
| State: | 13.4% (447) |
Number of households with income $100k - 125k:| Tolland: | 9.4% (86,394) |
| State: | 9.5% (317) |
Number of households with income $125k - 150k:| Tolland: | 5.6% (51,723) |
| Connecticut: | 3.9% (131) |
Number of households with income $150k - 200k:| Tolland: | 6.0% (54,526) |
| Connecticut: | 6.3% (212) |
Number of households with income > $200k:| Tolland: | 5.2% (47,196) |
| Connecticut: | 6.8% (228) |
Median per capita income in Tolland in 2022:| Tolland: | $16,593 |
| State: | $25,355 |
Change in median per capita income between 2000 and 2022:| Tolland, Connecticut: | +45.9% |
| Connecticut: | +39.4% |
Income statistics for Multirace residents
Median household income in Tolland, CT in 2022:| Tolland: | $178,890 |
| Connecticut: | $77,277 |
Change in median household income between 2000 and 2022:| Tolland, Connecticut: | +119.4% |
| State: | +113.6% |
Number of households with income < $10k:| Tolland: | 6.0% (16,799) |
| State: | 6.0% (7,457) |
Number of households with income $10k - 20k:| Tolland: | 8.1% (22,842) |
| State: | 8.1% (10,139) |
Number of households with income $20k - 30k:| Tolland: | 7.0% (19,604) |
| State: | 7.0% (8,702) |
Number of households with income $30k - 40k:| Tolland: | 6.9% (19,252) |
| Connecticut: | 6.9% (8,546) |
Number of households with income $40k - 50k:| Tolland: | 7.0% (19,626) |
| State: | 7.0% (8,712) |
Number of households with income $50k - 60k:| Tolland: | 5.9% (16,515) |
| Connecticut: | 5.9% (7,331) |
Number of households with income $60k - 75k:| Tolland: | 8.5% (23,956) |
| State: | 8.5% (10,634) |
Number of households with income $75k - 100k:| Tolland: | 14.1% (39,649) |
| Connecticut: | 14.1% (17,600) |
Number of households with income $100k - 125k:| Tolland: | 9.9% (27,896) |
| Connecticut: | 9.9% (12,383) |
Number of households with income $125k - 150k:| Tolland: | 7.2% (20,097) |
| Connecticut: | 7.2% (8,921) |
Number of households with income $150k - 200k:| Tolland: | 8.8% (24,605) |
| State: | 8.8% (10,922) |
Number of households with income > $200k:| Tolland: | 10.6% (29,843) |
| State: | 10.6% (13,247) |
Aggregate household income in Tolland in 2022: $50,962,741
Median family income in Tolland in 2022:| Tolland: | $177,252 |
| State: | $84,255 |
Number of families with income $10k - 20k:| Tolland: | 8.0% (22) |
| State: | 4.8% (4,079) |
Number of families with income $20k - 30k:| Tolland: | 7.1% (20) |
| State: | 6.9% (5,812) |
Number of families with income $75k - 100k:| Tolland: | 51.3% (144) |
| State: | 14.5% (12,236) |
Number of families with income $100k - 125k:| Tolland: | 33.6% (94) |
| State: | 9.2% (7,787) |
Median non-family income in Tolland in 2022:| Tolland: | $57,927 |
| State: | $44,462 |
Change in median non-family income between 2000 and 2022:| Tolland, Connecticut: | +81.0% |
| State: | +97.6% |
Median per capita income in Tolland in 2022:| Tolland: | $50,540 |
| Connecticut: | $32,794 |
Change in median per capita income between 2000 and 2022:| Tolland, Connecticut: | +95.5% |
| Connecticut: | +117.2% |
Income statistics for other residents
Number of households with income < $10k:| Tolland: | 9.1% (2) |
| State: | 9.0% (8,596) |
Number of households with income $10k - 20k:| Tolland: | 13.6% (3) |
| Connecticut: | 10.2% (9,773) |
Number of households with income $20k - 30k:| Tolland: | 9.1% (2) |
| State: | 9.1% (8,691) |
Number of households with income $30k - 40k:| Tolland: | 9.1% (2) |
| Connecticut: | 7.8% (7,447) |
Number of households with income $40k - 50k:| Tolland: | 9.1% (2) |
| Connecticut: | 8.2% (7,860) |
Number of households with income $50k - 60k:| Tolland: | 4.5% (1) |
| State: | 6.0% (5,757) |
Number of households with income $60k - 75k:| Tolland: | 9.1% (2) |
| State: | 9.3% (8,942) |
Number of households with income $75k - 100k:| Tolland: | 13.6% (3) |
| State: | 14.3% (13,700) |
Number of households with income $100k - 125k:| Tolland: | 9.1% (2) |
| Connecticut: | 7.2% (6,906) |
Number of households with income $125k - 150k:| Tolland: | 4.5% (1) |
| Connecticut: | 6.5% (6,215) |
Number of households with income $150k - 200k:| Tolland: | 4.5% (1) |
| State: | 6.1% (5,865) |
Number of households with income > $200k:| Tolland: | 4.5% (1) |
| State: | 6.3% (6,065) |
Aggregate household income in Tolland in 2022: $3,099,216
Median family income in Tolland in 2022:| Tolland: | $177,381 |
| Connecticut: | $67,610 |
Number of families with income $75k - 100k:| Tolland: | 100.0% (21) |
| State: | 15.7% (10,362) |
Median non-family income in Tolland in 2022:| Tolland: | $29,841 |
| Connecticut: | $34,285 |
Change in median non-family income between 2000 and 2022:| Tolland, Connecticut: | +83.6% |
| Connecticut: | +83.6% |
Median per capita income in Tolland in 2022:| Tolland: | $51,678 |
| State: | $29,353 |