The median household income in Tigerville, SC in 2022 was $69,278, which was 7.5% greater than the median annual income of $64,115 across the entire state of South Carolina. Compared to the median income of $39,744 in 2000 this represents an increase of 42.6%. The per capita income in 2022 was $30,491, which means an increase of 43.8% compared to 2000 when it was $17,129.
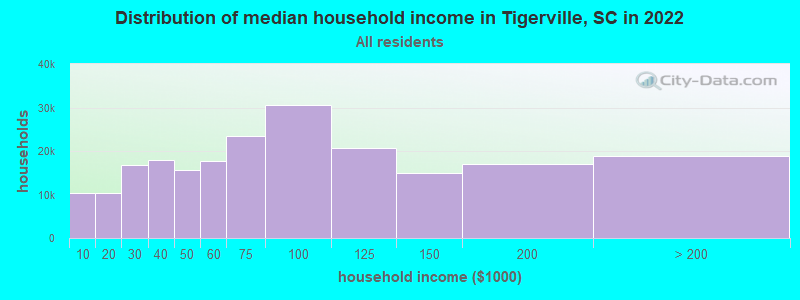
Income statistics for all residents
Median household income in Tigerville, SC in 2022:
Tigerville:
$69,279
State:
$64,115
Change in median household income between 2000 and 2022:
Tigerville, South Carolina:
+74.3%
State:
+72.9%
Number of households with income < $10k:
Tigerville:
4.8% (10,382)
State:
6.1% (130,922)
Number of households with income $10k - 20k:
Tigerville:
4.8% (10,390)
State:
7.9% (168,918)
Number of households with income $20k - 30k:
Tigerville:
7.9% (16,849)
State:
8.0% (171,564)
Number of households with income $30k - 40k:
Tigerville:
8.4% (18,032)
State:
9.2% (195,662)
Number of households with income $40k - 50k:
Tigerville:
7.3% (15,723)
State:
8.2% (176,179)
Number of households with income $50k - 60k:
Tigerville:
8.2% (17,689)
State:
7.5% (159,159)
Number of households with income $60k - 75k:
Tigerville:
10.9% (23,430)
State:
9.9% (211,862)
Number of households with income $75k - 100k:
Tigerville:
14.2% (30,515)
State:
13.5% (287,601)
Number of households with income $100k - 125k:
Tigerville:
9.7% (20,777)
State:
9.3% (199,068)
Number of households with income $125k - 150k:
Tigerville:
7.0% (14,937)
State:
6.2% (133,330)
Number of households with income $150k - 200k:
Tigerville:
7.9% (16,910)
South Carolina:
6.6% (141,363)
Number of households with income > $200k:
Tigerville:
8.8% (18,794)
State:
7.5% (160,452)
Aggregate household income in Tigerville in 2022: $1,117,127,085
Median family income in Tigerville in 2022:
Tigerville:
$77,834
South Carolina:
$79,886
Median non-family income in Tigerville in 2022:
Tigerville:
$35,122
State:
$38,426
Change in median non-family income between 2000 and 2022:
Tigerville, South Carolina:
+84.6%
State:
+78.7%
Median per capita income in Tigerville in 2022:
Tigerville:
$30,492
State:
$36,675
Change in median per capita income between 2000 and 2022:
Tigerville, South Carolina:
+78.0%
South Carolina:
+95.1%
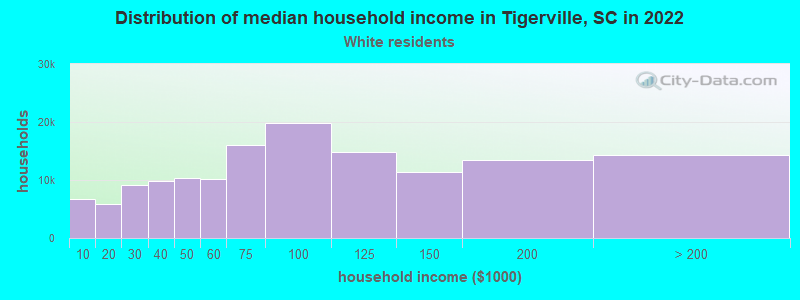
Income statistics for White residents
Median household income in Tigerville, SC in 2022:
Tigerville:
$71,158
South Carolina:
$73,516
Change in median household income between 2000 and 2022:
Tigerville, South Carolina:
+76.7%
State:
+74.8%
Number of households with income < $10k:
Tigerville:
4.7% (6,714)
State:
4.8% (68,379)
Number of households with income $10k - 20k:
Tigerville:
4.1% (5,882)
South Carolina:
5.9% (85,105)
Number of households with income $20k - 30k:
Tigerville:
6.4% (9,148)
State:
7.1% (101,178)
Number of households with income $30k - 40k:
Tigerville:
6.9% (9,789)
State:
8.0% (114,877)
Number of households with income $40k - 50k:
Tigerville:
7.3% (10,289)
State:
7.9% (112,749)
Number of households with income $50k - 60k:
Tigerville:
7.1% (10,136)
South Carolina:
7.1% (101,835)
Number of households with income $60k - 75k:
Tigerville:
11.3% (15,964)
South Carolina:
10.2% (145,879)
Number of households with income $75k - 100k:
Tigerville:
14.0% (19,868)
State:
14.0% (200,068)
Number of households with income $100k - 125k:
Tigerville:
10.4% (14,789)
State:
10.4% (148,542)
Number of households with income $125k - 150k:
Tigerville:
8.1% (11,429)
State:
7.3% (105,118)
Number of households with income $150k - 200k:
Tigerville:
9.5% (13,526)
State:
8.0% (114,506)
Number of households with income > $200k:
Tigerville:
10.1% (14,341)
State:
9.3% (133,550)
Aggregate household income in Tigerville in 2022: $803,157,515
Median family income in Tigerville in 2022:
Tigerville:
$82,825
State:
$90,709
Number of families with income < $10k:
Tigerville:
3.5% (55)
South Carolina:
2.4% (22,376)
Number of families with income $10k - 20k:
Tigerville:
4.4% (68)
State:
3.0% (28,325)
Number of families with income $20k - 30k:
Tigerville:
4.6% (72)
State:
4.4% (42,131)
Number of families with income $30k - 40k:
Tigerville:
7.5% (116)
State:
6.1% (57,510)
Number of families with income $40k - 50k:
Tigerville:
9.5% (147)
State:
7.0% (66,712)
Number of families with income $50k - 60k:
Tigerville:
12.3% (191)
South Carolina:
6.6% (62,489)
Number of families with income $60k - 75k:
Tigerville:
14.2% (221)
South Carolina:
10.0% (94,724)
Number of families with income $75k - 100k:
Tigerville:
8.5% (131)
South Carolina:
15.5% (147,207)
Number of families with income $100k - 125k:
Tigerville:
12.8% (199)
State:
12.5% (118,160)
Number of families with income $125k - 150k:
Tigerville:
7.7% (120)
South Carolina:
9.5% (90,395)
Number of families with income $150k - 200k:
Tigerville:
4.8% (75)
South Carolina:
10.6% (100,043)
Number of families with income > $200k:
Tigerville:
10.0% (156)
State:
12.4% (117,500)
Median non-family income in Tigerville in 2022:
Tigerville:
$37,300
State:
$42,596
Change in median non-family income between 2000 and 2022:
Tigerville, South Carolina:
+86.0%
State:
+74.9%
Median per capita income in Tigerville in 2022:
Tigerville:
$31,966
State:
$42,728
Change in median per capita income between 2000 and 2022:
Tigerville, South Carolina:
+82.9%
South Carolina:
+93.4%
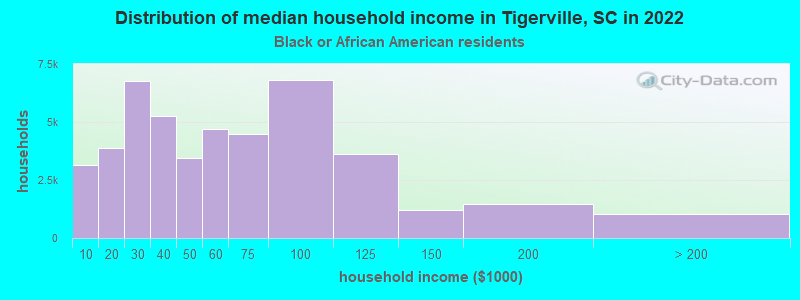
Income statistics for Black or African American residents
Median household income in Tigerville, SC in 2022:
Tigerville:
$61,867
State:
$44,187
Change in median household income between 2000 and 2022:
Tigerville, South Carolina:
+87.4%
South Carolina:
+76.5%
Number of households with income < $10k:
Tigerville:
6.9% (3,153)
State:
10.0% (52,303)
Number of households with income $10k - 20k:
Tigerville:
8.5% (3,885)
South Carolina:
13.4% (69,913)
Number of households with income $20k - 30k:
Tigerville:
14.8% (6,766)
South Carolina:
10.4% (54,216)
Number of households with income $30k - 40k:
Tigerville:
11.4% (5,240)
South Carolina:
12.0% (62,722)
Number of households with income $40k - 50k:
Tigerville:
7.6% (3,467)
State:
9.2% (47,773)
Number of households with income $50k - 60k:
Tigerville:
10.3% (4,719)
State:
8.3% (43,083)
Number of households with income $60k - 75k:
Tigerville:
9.8% (4,496)
State:
9.3% (48,640)
Number of households with income $75k - 100k:
Tigerville:
14.9% (6,817)
State:
12.2% (63,723)
Number of households with income $100k - 125k:
Tigerville:
7.9% (3,624)
State:
6.4% (33,117)
Number of households with income $125k - 150k:
Tigerville:
2.7% (1,223)
State:
3.2% (16,465)
Number of households with income $150k - 200k:
Tigerville:
3.2% (1,457)
State:
3.2% (16,672)
Number of households with income > $200k:
Tigerville:
2.2% (1,024)
State:
2.3% (12,213)
Aggregate household income in Tigerville in 2022: $18,833,206
Median family income in Tigerville in 2022:
Tigerville:
$64,155
State:
$54,267
Number of families with income < $10k:
Tigerville:
3.8% (9)
South Carolina:
7.3% (23,752)
Number of families with income $10k - 20k:
Tigerville:
5.9% (13)
South Carolina:
8.5% (27,789)
Number of families with income $20k - 30k:
Tigerville:
1.8% (4)
State:
9.4% (30,766)
Number of families with income $30k - 40k:
Tigerville:
7.7% (18)
South Carolina:
11.6% (37,651)
Number of families with income $40k - 50k:
Tigerville:
5.4% (12)
State:
9.5% (30,858)
Number of families with income $50k - 60k:
Tigerville:
7.2% (16)
South Carolina:
8.7% (28,419)
Number of families with income $100k - 125k:
Tigerville:
35.6% (81)
South Carolina:
8.6% (27,974)
Number of families with income $125k - 150k:
Tigerville:
11.0% (25)
State:
3.9% (12,743)
Number of families with income > $200k:
Tigerville:
21.6% (49)
State:
3.2% (10,269)
Median non-family income in Tigerville in 2022:
Tigerville:
$27,580
State:
$28,585
Change in median non-family income between 2000 and 2022:
Tigerville, South Carolina:
+69.7%
South Carolina:
+100.5%
Median per capita income in Tigerville in 2022:
Tigerville:
$30,175
South Carolina:
$24,863
Change in median per capita income between 2000 and 2022:
Tigerville, South Carolina:
+96.9%
State:
+111.1%
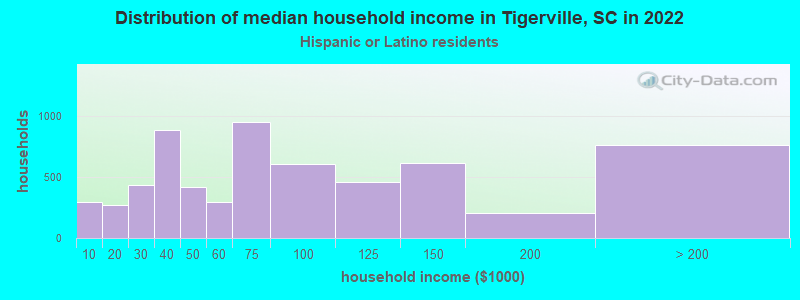
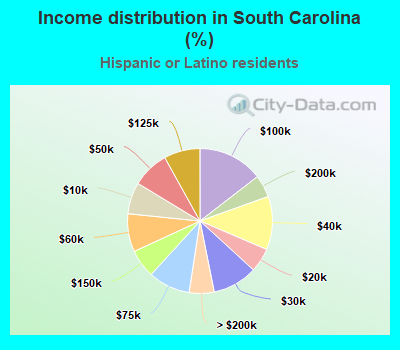
Income statistics for Hispanic or Latino residents
Median household income in Tigerville, SC in 2022:
Tigerville:
$25,039
State:
$58,486
Change in median household income between 2000 and 2022:
Tigerville, South Carolina:
+122.6%
South Carolina:
+84.8%
Number of households with income < $10k:
Tigerville:
4.8% (298)
State:
7.1% (7,036)
Number of households with income $10k - 20k:
Tigerville:
4.3% (270)
South Carolina:
5.4% (5,379)
Number of households with income $20k - 30k:
Tigerville:
7.0% (437)
South Carolina:
10.0% (9,993)
Number of households with income $30k - 40k:
Tigerville:
14.3% (890)
State:
11.9% (11,872)
Number of households with income $40k - 50k:
Tigerville:
6.7% (417)
State:
8.3% (8,239)
Number of households with income $50k - 60k:
Tigerville:
4.7% (294)
State:
8.5% (8,475)
Number of households with income $60k - 75k:
Tigerville:
15.3% (952)
State:
9.4% (9,330)
Number of households with income $75k - 100k:
Tigerville:
9.7% (605)
State:
14.5% (14,491)
Number of households with income $100k - 125k:
Tigerville:
7.5% (463)
State:
8.1% (8,026)
Number of households with income $125k - 150k:
Tigerville:
9.9% (613)
State:
6.3% (6,313)
Number of households with income $150k - 200k:
Tigerville:
3.3% (207)
State:
5.0% (4,963)
Number of households with income > $200k:
Tigerville:
12.3% (764)
State:
5.6% (5,548)
Aggregate household income in Tigerville in 2022: $880,490
Median non-family income in Tigerville in 2022:
Tigerville:
$14,425
South Carolina:
$37,846
Change in median non-family income between 2000 and 2022:
Tigerville, South Carolina:
+28.2%
South Carolina:
+47.6%
Median per capita income in Tigerville in 2022:
Tigerville:
$9,105
State:
$23,692
Change in median per capita income between 2000 and 2022:
Tigerville, South Carolina:
+109.4%
State:
+95.1%
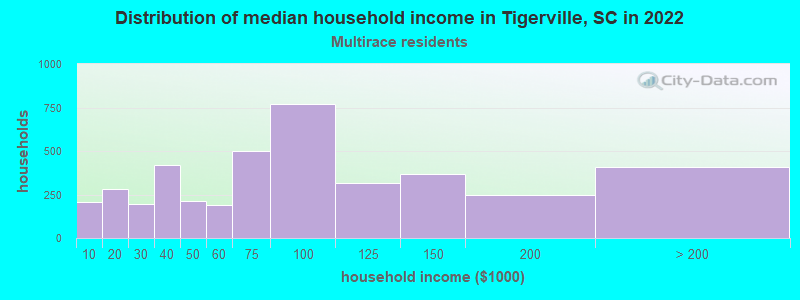
Income statistics for Multirace residents
Median household income in Tigerville, SC in 2022:
Tigerville:
$26,987
State:
$61,314
Change in median household income between 2000 and 2022:
Tigerville, South Carolina:
+115.9%
South Carolina:
+94.4%
Number of households with income < $10k:
Tigerville:
5.0% (208)
State:
6.9% (6,974)
Number of households with income $10k - 20k:
Tigerville:
6.9% (284)
State:
8.0% (8,052)
Number of households with income $20k - 30k:
Tigerville:
4.8% (196)
State:
9.9% (9,972)
Number of households with income $30k - 40k:
Tigerville:
10.1% (418)
State:
10.0% (10,121)
Number of households with income $40k - 50k:
Tigerville:
5.2% (214)
State:
8.1% (8,188)
Number of households with income $50k - 60k:
Tigerville:
4.7% (192)
State:
6.5% (6,530)
Number of households with income $60k - 75k:
Tigerville:
12.2% (502)
State:
8.9% (9,021)
Number of households with income $75k - 100k:
Tigerville:
18.7% (771)
State:
13.4% (13,544)
Number of households with income $100k - 125k:
Tigerville:
7.7% (317)
State:
9.8% (9,916)
Number of households with income $125k - 150k:
Tigerville:
8.9% (365)
State:
6.6% (6,657)
Number of households with income $150k - 200k:
Tigerville:
6.0% (248)
State:
5.9% (5,979)
Number of households with income > $200k:
Tigerville:
9.9% (407)
South Carolina:
6.2% (6,266)
Aggregate household income in Tigerville in 2022: $2,469,108
Median family income in Tigerville in 2022:
Tigerville:
$12,468
State:
$72,647
Number of families with income < $10k:
Tigerville:
100.0% (13)
State:
4.6% (3,104)
Median non-family income in Tigerville in 2022:
Tigerville:
$49,386
State:
$38,033
Median per capita income in Tigerville in 2022:
Tigerville:
$11,274
State:
$26,391
Change in median per capita income between 2000 and 2022:
Tigerville, South Carolina:
+130.7%
South Carolina:
+120.8%
Income statistics for other residents
Number of households with income < $10k:
Tigerville:
0.0% (0)
State:
4.5% (1,945)
Number of households with income $10k - 20k:
Tigerville:
0.0% (0)
State:
6.9% (2,977)
Number of households with income $20k - 30k:
Tigerville:
13.3% (2)
State:
9.2% (3,988)
Number of households with income $30k - 40k:
Tigerville:
20.0% (3)
State:
11.8% (5,124)
Number of households with income $40k - 50k:
Tigerville:
6.7% (1)
South Carolina:
12.3% (5,309)
Number of households with income $50k - 60k:
Tigerville:
13.3% (2)
State:
9.7% (4,196)
Number of households with income $60k - 75k:
Tigerville:
13.3% (2)
State:
10.5% (4,549)
Number of households with income $75k - 100k:
Tigerville:
13.3% (2)
State:
14.1% (6,099)
Number of households with income $100k - 125k:
Tigerville:
6.7% (1)
State:
6.3% (2,747)
Number of households with income $125k - 150k:
Tigerville:
6.7% (1)
South Carolina:
7.0% (3,024)
Number of households with income $150k - 200k:
Tigerville:
0.0% (0)
South Carolina:
4.6% (1,982)
Number of households with income > $200k:
Tigerville:
6.7% (1)
State:
3.2% (1,365)
Aggregate household income in Tigerville in 2022: $1,027,955
Median non-family income in Tigerville in 2022:
Tigerville:
$21,434
South Carolina:
$42,981
Change in median non-family income between 2000 and 2022:
Tigerville, South Carolina:
+90.5%
South Carolina:
+62.1%
Median per capita income in Tigerville in 2022:
Tigerville:
$8,235
State:
$22,305
Change in median per capita income between 2000 and 2022:
Tigerville, South Carolina:
+89.4%
South Carolina:
+113.0%
Discuss Tigerville, South Carolina (SC) on our hugely popular South Carolina forum.