Thornton, Idaho (ID) income map, earnings map, and wages data
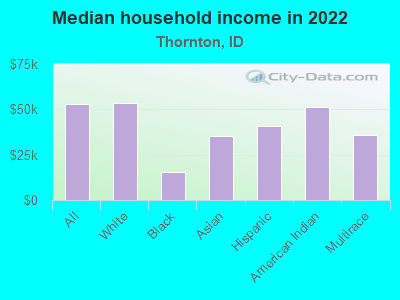
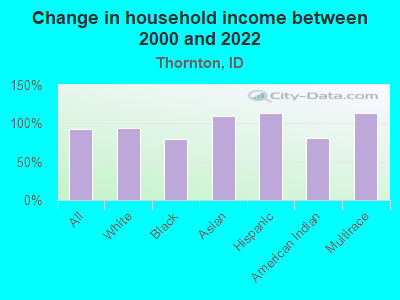
The median household income in Thornton, ID in 2022 was $52,865, which was 37.7% less than the median annual income of $72,785 across the entire state of Idaho. Compared to the median income of $27,336 in 2000 this represents an increase of 48.3%. The per capita income in 2022 was $19,140, which means an increase of 50.9% compared to 2000 when it was $9,398.
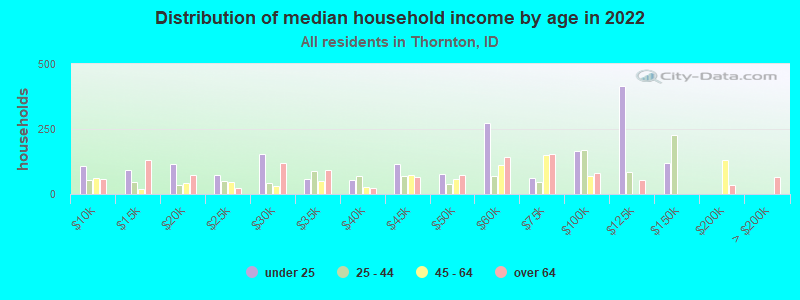
Income statistics for all residents
Median household income in Thornton, ID in 2022:| Thornton: | $52,866 |
| Idaho: | $72,785 |
Change in median household income between 2000 and 2022:| Thornton, Idaho: | +93.4% |
| State: | +93.7% |
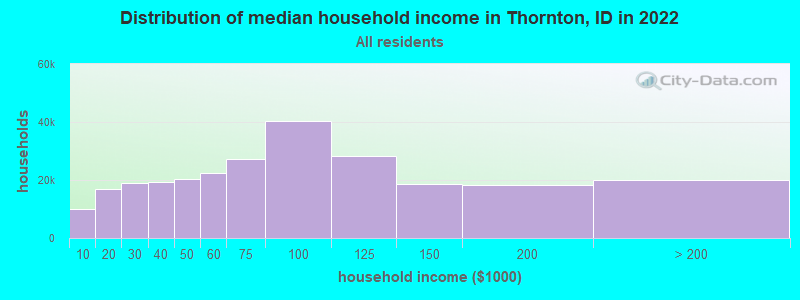
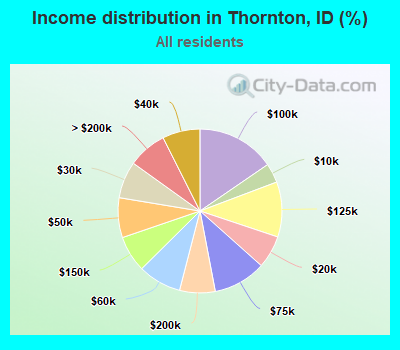
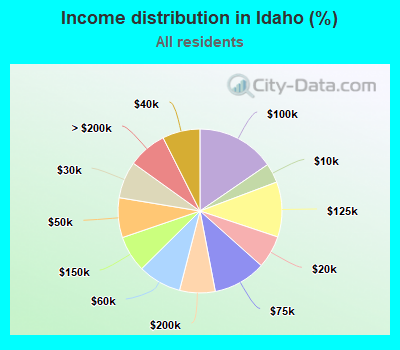
Number of households with income < $10k:| Thornton: | 3.8% (10,005) |
| State: | 3.8% (27,531) |
Number of households with income $10k - 20k:| Thornton: | 6.5% (16,855) |
| State: | 6.5% (46,382) |
Number of households with income $20k - 30k:| Thornton: | 7.3% (19,011) |
| State: | 7.3% (52,311) |
Number of households with income $30k - 40k:| Thornton: | 7.4% (19,344) |
| Idaho: | 7.4% (53,221) |
Number of households with income $40k - 50k:| Thornton: | 7.9% (20,490) |
| State: | 7.9% (56,391) |
Number of households with income $50k - 60k:| Thornton: | 8.6% (22,351) |
| Idaho: | 8.6% (61,493) |
Number of households with income $60k - 75k:| Thornton: | 10.4% (27,101) |
| State: | 10.4% (74,559) |
Number of households with income $75k - 100k:| Thornton: | 15.4% (40,221) |
| State: | 15.4% (110,673) |
Number of households with income $100k - 125k:| Thornton: | 10.9% (28,327) |
| Idaho: | 10.9% (77,947) |
Number of households with income $125k - 150k:| Thornton: | 7.2% (18,635) |
| State: | 7.2% (51,314) |
Number of households with income $150k - 200k:| Thornton: | 7.0% (18,282) |
| Idaho: | 7.0% (50,340) |
Number of households with income > $200k:| Thornton: | 7.7% (19,996) |
| State: | 7.7% (54,989) |
Aggregate household income in Thornton in 2022: $2,564,427,747
Median family income in Thornton in 2022:| Thornton: | $68,117 |
| Idaho: | $85,193 |
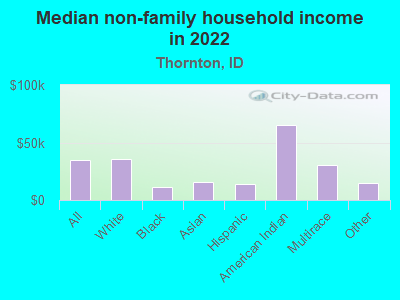
Median non-family income in Thornton in 2022:| Thornton: | $34,765 |
| State: | $42,145 |
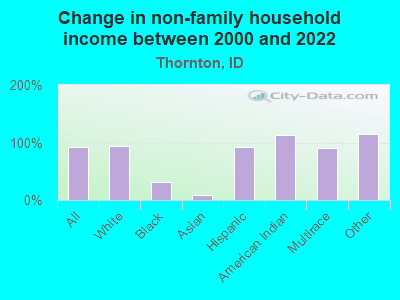
Change in median non-family income between 2000 and 2022:| Thornton, Idaho: | +92.1% |
| Idaho: | +92.8% |
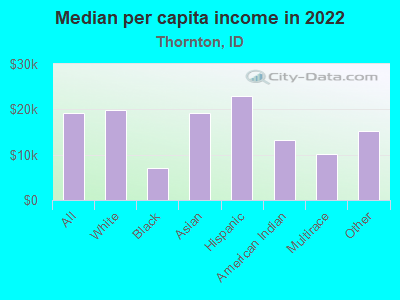
Median per capita income in Thornton in 2022:| Thornton: | $19,140 |
| State: | $35,980 |
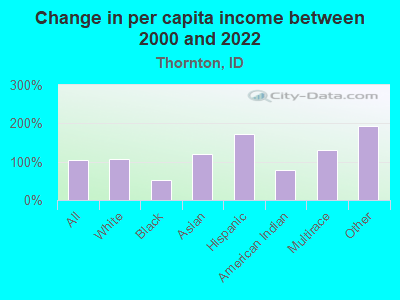
Change in median per capita income between 2000 and 2022:| Thornton, Idaho: | +103.7% |
| State: | +101.7% |
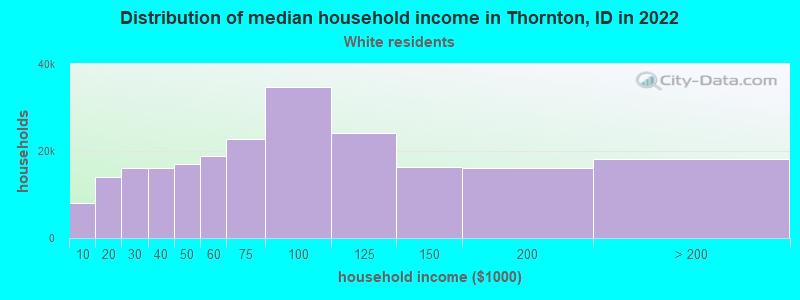
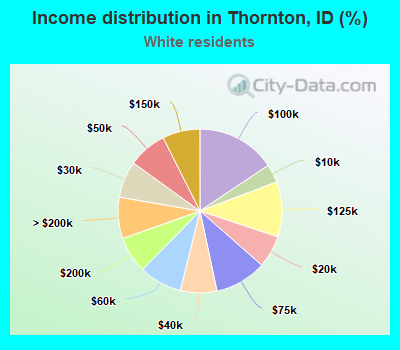
Income statistics for White residents
Median household income in Thornton, ID in 2022:| Thornton: | $53,347 |
| State: | $74,133 |
Change in median household income between 2000 and 2022:| Thornton, Idaho: | +93.6% |
| State: | +93.7% |
Number of households with income < $10k:| Thornton: | 3.6% (8,066) |
| Idaho: | 3.6% (22,407) |
Number of households with income $10k - 20k:| Thornton: | 6.4% (14,106) |
| State: | 6.4% (39,191) |
Number of households with income $20k - 30k:| Thornton: | 7.2% (16,037) |
| Idaho: | 7.2% (44,546) |
Number of households with income $30k - 40k:| Thornton: | 7.2% (15,985) |
| State: | 7.2% (44,401) |
Number of households with income $40k - 50k:| Thornton: | 7.6% (16,964) |
| Idaho: | 7.6% (47,134) |
Number of households with income $50k - 60k:| Thornton: | 8.5% (18,824) |
| State: | 8.5% (52,282) |
Number of households with income $60k - 75k:| Thornton: | 10.2% (22,651) |
| State: | 10.2% (62,907) |
Number of households with income $75k - 100k:| Thornton: | 15.6% (34,683) |
| State: | 15.6% (96,336) |
Number of households with income $100k - 125k:| Thornton: | 10.9% (24,084) |
| State: | 10.9% (66,903) |
Number of households with income $125k - 150k:| Thornton: | 7.4% (16,433) |
| State: | 7.4% (45,677) |
Number of households with income $150k - 200k:| Thornton: | 7.2% (16,025) |
| State: | 7.2% (44,544) |
Number of households with income > $200k:| Thornton: | 8.2% (18,092) |
| State: | 8.1% (50,234) |
Aggregate household income in Thornton in 2022: $2,174,919,765
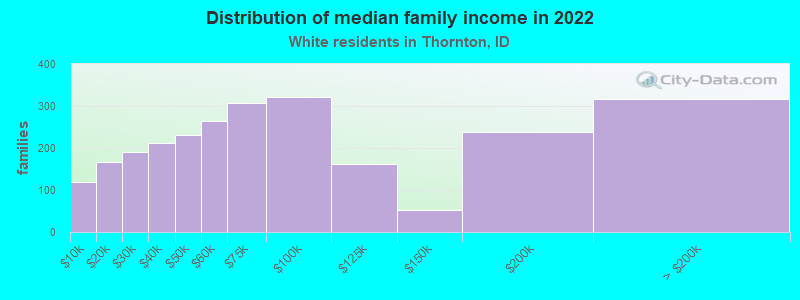
Median family income in Thornton in 2022:| Thornton: | $69,941 |
| Idaho: | $87,867 |
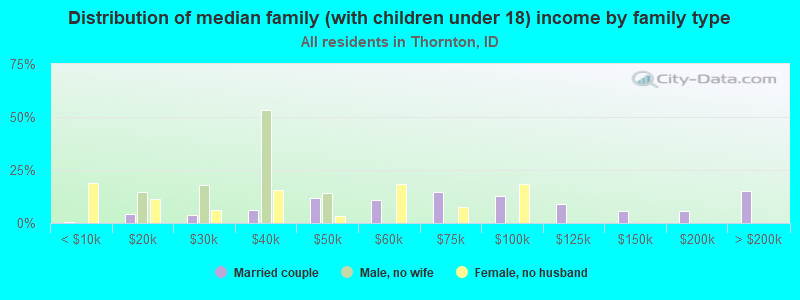
Number of families with income < $10k:| Thornton: | 4.6% (118) |
| State: | 2.1% (8,718) |
Number of families with income $10k - 20k:| Thornton: | 6.5% (167) |
| State: | 3.0% (12,422) |
Number of families with income $20k - 30k:| Thornton: | 7.4% (191) |
| State: | 4.8% (20,052) |
Number of families with income $30k - 40k:| Thornton: | 8.3% (213) |
| State: | 5.7% (23,893) |
Number of families with income $40k - 50k:| Thornton: | 8.9% (230) |
| State: | 6.7% (28,307) |
Number of families with income $50k - 60k:| Thornton: | 10.2% (264) |
| Idaho: | 7.6% (31,799) |
Number of families with income $60k - 75k:| Thornton: | 11.9% (308) |
| State: | 10.3% (43,227) |
Number of families with income $75k - 100k:| Thornton: | 12.5% (321) |
| State: | 18.3% (76,851) |
Number of families with income $100k - 125k:| Thornton: | 6.3% (162) |
| State: | 12.9% (54,226) |
Number of families with income $125k - 150k:| Thornton: | 2.0% (52) |
| Idaho: | 9.4% (39,298) |
Number of families with income $150k - 200k:| Thornton: | 9.2% (237) |
| Idaho: | 8.9% (37,389) |
Number of families with income > $200k:| Thornton: | 12.3% (317) |
| State: | 10.5% (44,073) |
Median non-family income in Thornton in 2022:| Thornton: | $35,542 |
| State: | $42,911 |
Change in median non-family income between 2000 and 2022:| Thornton, Idaho: | +93.9% |
| Idaho: | +95.3% |
Median per capita income in Thornton in 2022:| Thornton: | $19,832 |
| Idaho: | $38,188 |
Change in median per capita income between 2000 and 2022:| Thornton, Idaho: | +107.7% |
| Idaho: | +106.3% |
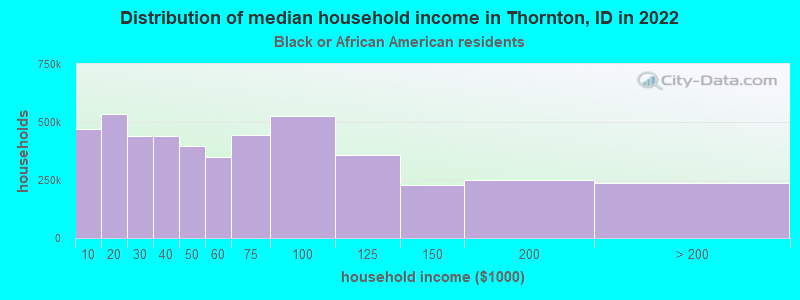
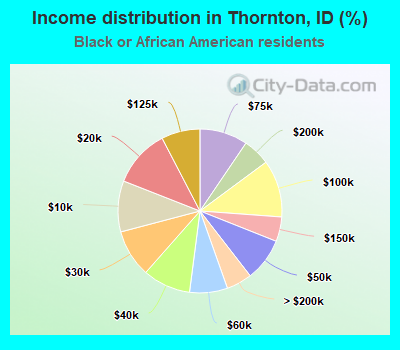
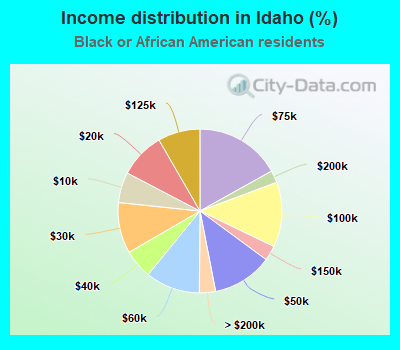
Income statistics for Black or African American residents
Median household income in Thornton, ID in 2022:| Thornton: | $15,656 |
| State: | $55,313 |
Change in median household income between 2000 and 2022:| Thornton, Idaho: | +78.9% |
| Idaho: | +74.7% |
Number of households with income < $10k:| Thornton: | 10.1% (469,607) |
| State: | 6.0% (202) |
Number of households with income $10k - 20k:| Thornton: | 11.4% (532,555) |
| State: | 9.0% (302) |
Number of households with income $20k - 30k:| Thornton: | 9.4% (438,164) |
| State: | 10.0% (337) |
Number of households with income $30k - 40k:| Thornton: | 9.5% (441,422) |
| State: | 5.7% (192) |
Number of households with income $40k - 50k:| Thornton: | 8.5% (395,674) |
| Idaho: | 11.8% (398) |
Number of households with income $50k - 60k:| Thornton: | 7.5% (349,558) |
| State: | 10.8% (362) |
Number of households with income $60k - 75k:| Thornton: | 9.5% (442,484) |
| State: | 16.9% (568) |
Number of households with income $75k - 100k:| Thornton: | 11.3% (527,452) |
| Idaho: | 12.8% (431) |
Number of households with income $100k - 125k:| Thornton: | 7.6% (356,360) |
| State: | 8.3% (280) |
Number of households with income $125k - 150k:| Thornton: | 4.9% (226,936) |
| Idaho: | 2.9% (99) |
Number of households with income $150k - 200k:| Thornton: | 5.4% (252,099) |
| State: | 2.4% (81) |
Number of households with income > $200k:| Thornton: | 5.1% (236,242) |
| Idaho: | 3.2% (107) |
Aggregate household income in Thornton in 2022: $175,775
Median non-family income in Thornton in 2022:| Thornton: | $11,535 |
| Idaho: | $29,928 |
Change in median non-family income between 2000 and 2022:| Thornton, Idaho: | +31.8% |
| State: | +31.8% |
Median per capita income in Thornton in 2022:| Thornton: | $7,050 |
| Idaho: | $22,845 |
Change in median per capita income between 2000 and 2022:| Thornton, Idaho: | +52.1% |
| State: | +62.1% |
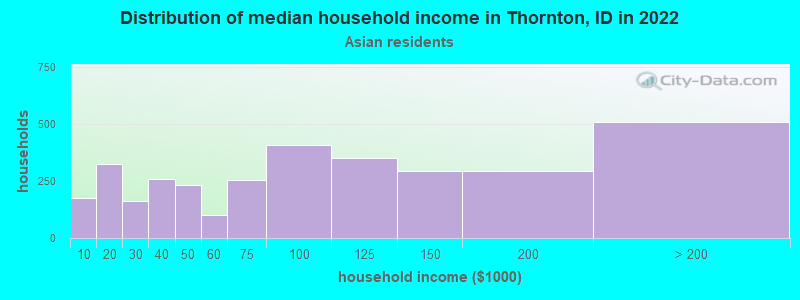
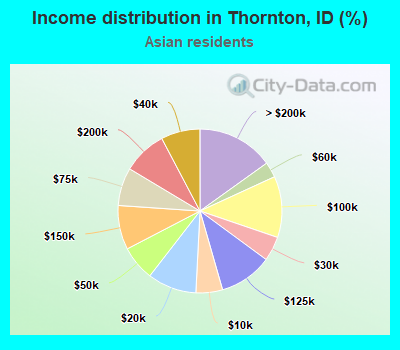
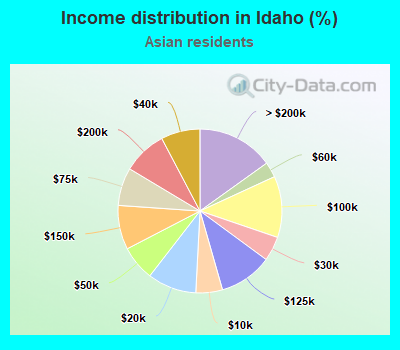
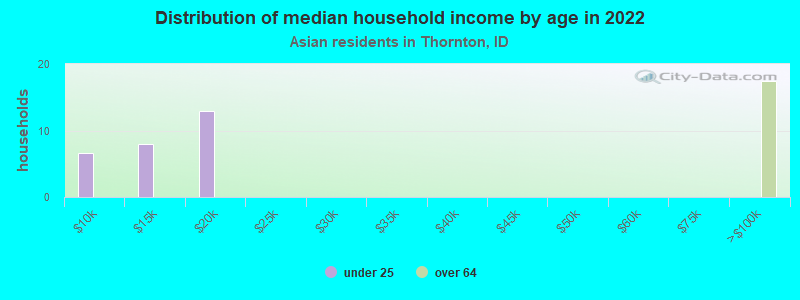
Income statistics for Asian residents
Median household income in Thornton, ID in 2022:| Thornton: | $35,330 |
| State: | $86,111 |
Change in median household income between 2000 and 2022:| Thornton, Idaho: | +108.5% |
| State: | +88.2% |
Number of households with income < $10k:| Thornton: | 5.3% (177) |
| Idaho: | 5.3% (478) |
Number of households with income $10k - 20k:| Thornton: | 9.7% (326) |
| State: | 9.7% (880) |
Number of households with income $20k - 30k:| Thornton: | 4.9% (164) |
| State: | 4.9% (442) |
Number of households with income $30k - 40k:| Thornton: | 7.7% (260) |
| Idaho: | 7.7% (702) |
Number of households with income $40k - 50k:| Thornton: | 6.9% (232) |
| State: | 6.9% (627) |
Number of households with income $50k - 60k:| Thornton: | 3.1% (103) |
| Idaho: | 3.0% (277) |
Number of households with income $60k - 75k:| Thornton: | 7.5% (253) |
| State: | 7.5% (682) |
Number of households with income $75k - 100k:| Thornton: | 12.1% (407) |
| State: | 12.1% (1,100) |
Number of households with income $100k - 125k:| Thornton: | 10.5% (353) |
| State: | 10.5% (954) |
Number of households with income $125k - 150k:| Thornton: | 8.7% (294) |
| State: | 8.7% (793) |
Number of households with income $150k - 200k:| Thornton: | 8.7% (293) |
| State: | 8.7% (791) |
Number of households with income > $200k:| Thornton: | 15.1% (509) |
| Idaho: | 15.1% (1,374) |
Aggregate household income in Thornton in 2022: $7,316,025
Median family income in Thornton in 2022:| Thornton: | $184,113 |
| Idaho: | $105,582 |
Number of families with income $75k - 100k:| Thornton: | 100.0% (21) |
| State: | 10.4% (643) |
Median non-family income in Thornton in 2022:| Thornton: | $15,415 |
| Idaho: | $33,717 |
Change in median non-family income between 2000 and 2022:| Thornton, Idaho: | +8.8% |
| Idaho: | +8.8% |
Median per capita income in Thornton in 2022:| Thornton: | $19,128 |
| State: | $43,712 |
Change in median per capita income between 2000 and 2022:| Thornton, Idaho: | +119.3% |
| State: | +117.0% |
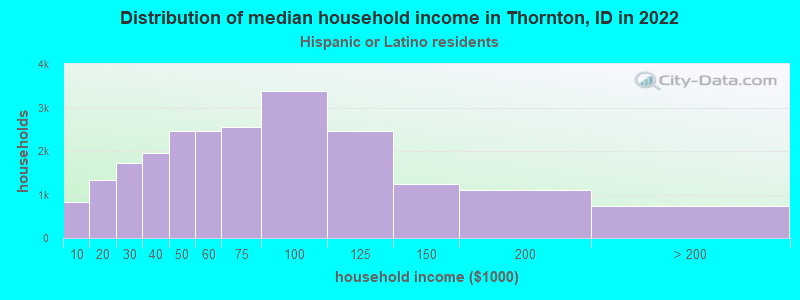
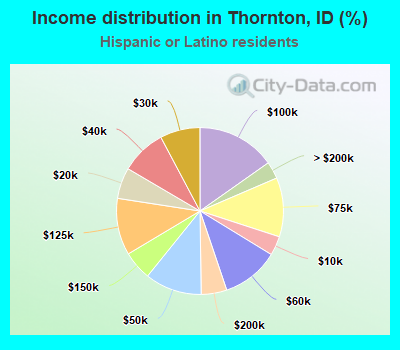
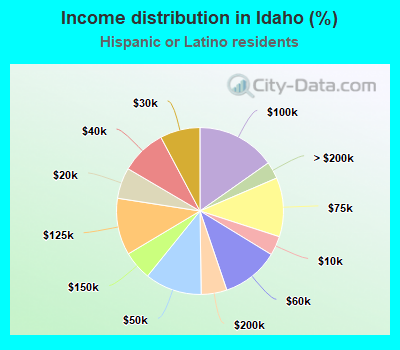
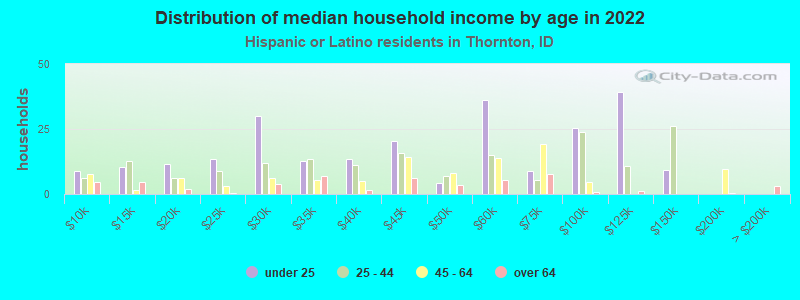
Income statistics for Hispanic or Latino residents
Median household income in Thornton, ID in 2022:| Thornton: | $40,689 |
| State: | $61,854 |
Change in median household income between 2000 and 2022:| Thornton, Idaho: | +113.4% |
| State: | +113.4% |
Number of households with income < $10k:| Thornton: | 3.7% (830) |
| Idaho: | 3.7% (2,527) |
Number of households with income $10k - 20k:| Thornton: | 6.0% (1,339) |
| Idaho: | 6.0% (4,073) |
Number of households with income $20k - 30k:| Thornton: | 7.8% (1,726) |
| State: | 7.8% (5,260) |
Number of households with income $30k - 40k:| Thornton: | 8.8% (1,956) |
| State: | 8.8% (5,948) |
Number of households with income $40k - 50k:| Thornton: | 11.0% (2,455) |
| Idaho: | 11.0% (7,481) |
Number of households with income $50k - 60k:| Thornton: | 11.1% (2,464) |
| Idaho: | 11.1% (7,506) |
Number of households with income $60k - 75k:| Thornton: | 11.5% (2,552) |
| State: | 11.5% (7,763) |
Number of households with income $75k - 100k:| Thornton: | 15.2% (3,390) |
| State: | 15.2% (10,333) |
Number of households with income $100k - 125k:| Thornton: | 11.0% (2,452) |
| State: | 11.0% (7,474) |
Number of households with income $125k - 150k:| Thornton: | 5.6% (1,248) |
| Idaho: | 5.6% (3,804) |
Number of households with income $150k - 200k:| Thornton: | 5.0% (1,107) |
| State: | 5.0% (3,368) |
Number of households with income > $200k:| Thornton: | 3.3% (738) |
| State: | 3.3% (2,238) |
Aggregate household income in Thornton in 2022: $28,871,010
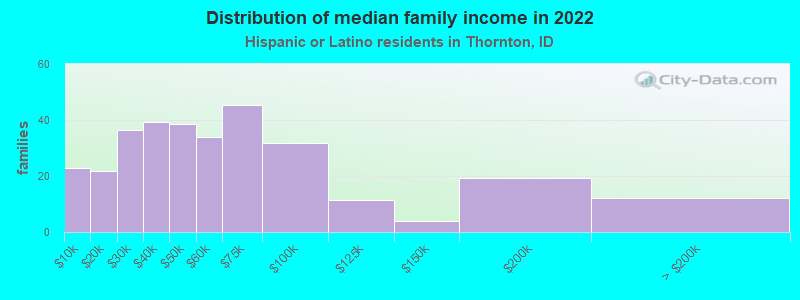
Median family income in Thornton in 2022:| Thornton: | $70,516 |
| State: | $65,889 |
Number of families with income < $10k:| Thornton: | 7.2% (23) |
| Idaho: | 3.2% (1,625) |
Number of families with income $10k - 20k:| Thornton: | 6.9% (22) |
| Idaho: | 3.5% (1,749) |
Number of families with income $20k - 30k:| Thornton: | 11.5% (36) |
| State: | 8.5% (4,245) |
Number of families with income $30k - 40k:| Thornton: | 12.4% (39) |
| Idaho: | 9.0% (4,522) |
Number of families with income $40k - 50k:| Thornton: | 12.1% (38) |
| State: | 10.0% (5,001) |
Number of families with income $50k - 60k:| Thornton: | 10.7% (34) |
| Idaho: | 9.0% (4,535) |
Number of families with income $60k - 75k:| Thornton: | 14.3% (45) |
| State: | 13.6% (6,824) |
Number of families with income $75k - 100k:| Thornton: | 10.0% (32) |
| State: | 16.3% (8,197) |
Number of families with income $100k - 125k:| Thornton: | 3.6% (11) |
| Idaho: | 10.8% (5,401) |
Number of families with income $125k - 150k:| Thornton: | 1.3% (4) |
| State: | 6.6% (3,309) |
Number of families with income $150k - 200k:| Thornton: | 6.1% (19) |
| Idaho: | 5.4% (2,700) |
Number of families with income > $200k:| Thornton: | 3.9% (12) |
| State: | 4.2% (2,095) |
Median non-family income in Thornton in 2022:| Thornton: | $13,546 |
| State: | $42,095 |
Change in median non-family income between 2000 and 2022:| Thornton, Idaho: | +92.3% |
| Idaho: | +105.7% |
Median per capita income in Thornton in 2022:| Thornton: | $22,923 |
| Idaho: | $23,147 |
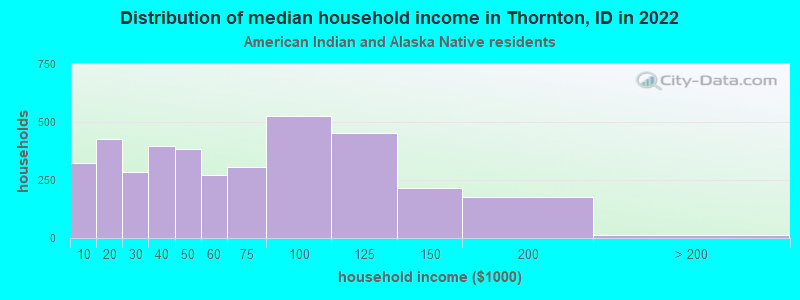
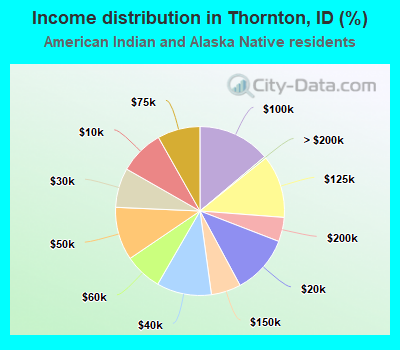
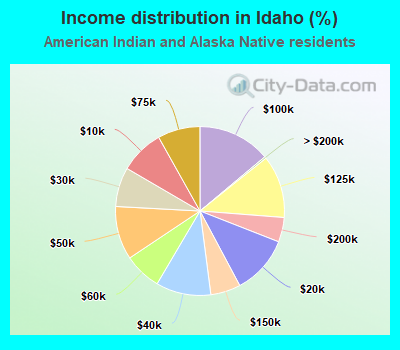
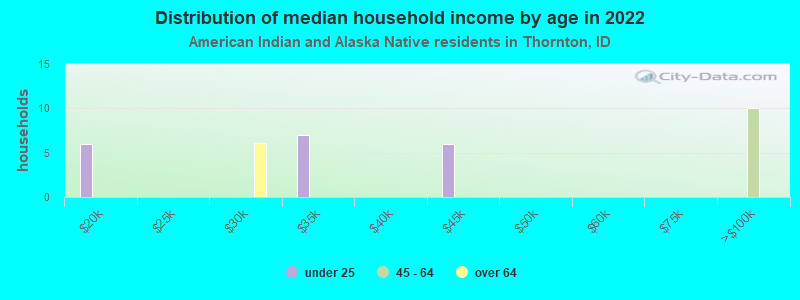
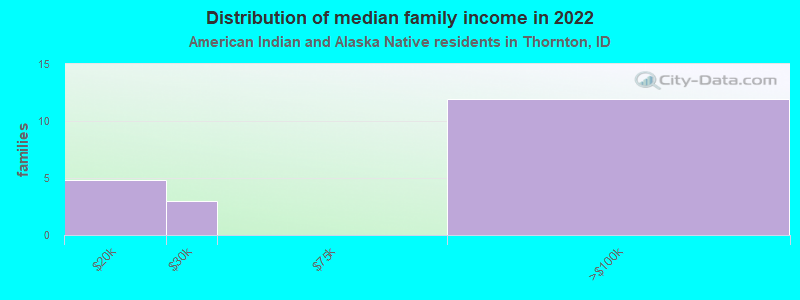
Income statistics for American Indian and Alaska Native residents
Median household income in Thornton, ID in 2022:| Thornton: | $51,156 |
| State: | $52,777 |
Change in median household income between 2000 and 2022:| Thornton, Idaho: | +80.6% |
| State: | +79.8% |
Number of households with income < $10k:| Thornton: | 8.6% (323) |
| Idaho: | 8.5% (663) |
Number of households with income $10k - 20k:| Thornton: | 11.3% (425) |
| Idaho: | 11.3% (881) |
Number of households with income $20k - 30k:| Thornton: | 7.6% (285) |
| State: | 7.5% (591) |
Number of households with income $30k - 40k:| Thornton: | 10.5% (396) |
| State: | 10.5% (825) |
Number of households with income $40k - 50k:| Thornton: | 10.2% (384) |
| State: | 10.2% (801) |
Number of households with income $50k - 60k:| Thornton: | 7.2% (271) |
| State: | 7.1% (559) |
Number of households with income $60k - 75k:| Thornton: | 8.2% (308) |
| State: | 8.1% (636) |
Number of households with income $75k - 100k:| Thornton: | 13.9% (524) |
| State: | 13.9% (1,090) |
Number of households with income $100k - 125k:| Thornton: | 12.0% (452) |
| State: | 12.0% (938) |
Number of households with income $125k - 150k:| Thornton: | 5.7% (215) |
| State: | 5.7% (450) |
Number of households with income $150k - 200k:| Thornton: | 4.6% (175) |
| Idaho: | 4.7% (369) |
Number of households with income > $200k:| Thornton: | 0.3% (13) |
| State: | 0.3% (27) |
Aggregate household income in Thornton in 2022: $2,866,719
Median family income in Thornton in 2022:| Thornton: | $41,462 |
| State: | $54,994 |
Number of families with income $10k - 20k:| Thornton: | 24.3% (5) |
| State: | 6.0% (323) |
Number of families with income $20k - 30k:| Thornton: | 15.1% (3) |
| State: | 7.0% (377) |
Number of families with income $75k - 100k:| Thornton: | 60.6% (12) |
| State: | 17.0% (911) |
Median non-family income in Thornton in 2022:| Thornton: | $65,248 |
| State: | $31,143 |
Change in median non-family income between 2000 and 2022:| Thornton, Idaho: | +113.1% |
| Idaho: | +108.4% |
Median per capita income in Thornton in 2022:| Thornton: | $13,199 |
| Idaho: | $20,659 |
Change in median per capita income between 2000 and 2022:| Thornton, Idaho: | +79.4% |
| State: | +82.6% |
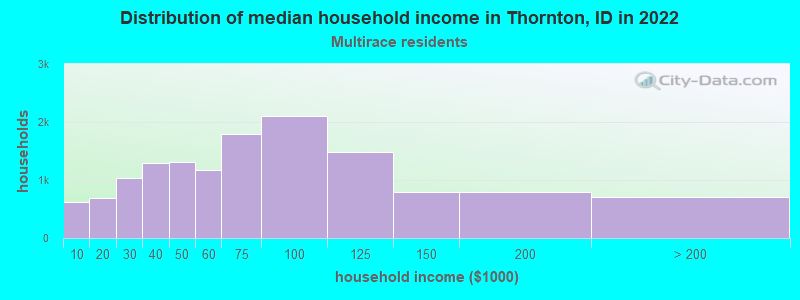
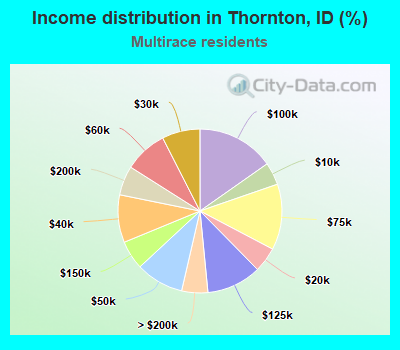
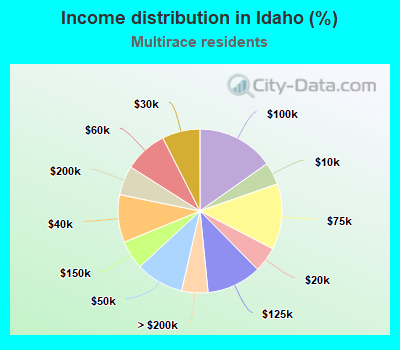
Income statistics for Multirace residents
Median household income in Thornton, ID in 2022:| Thornton: | $35,701 |
| State: | $66,900 |
Change in median household income between 2000 and 2022:| Thornton, Idaho: | +114.2% |
| State: | +115.5% |
Number of households with income < $10k:| Thornton: | 4.5% (614) |
| Idaho: | 4.4% (2,261) |
Number of households with income $10k - 20k:| Thornton: | 4.9% (682) |
| State: | 5.0% (2,552) |
Number of households with income $20k - 30k:| Thornton: | 7.5% (1,034) |
| Idaho: | 7.5% (3,825) |
Number of households with income $30k - 40k:| Thornton: | 9.4% (1,296) |
| Idaho: | 9.4% (4,811) |
Number of households with income $40k - 50k:| Thornton: | 9.5% (1,306) |
| State: | 9.5% (4,842) |
Number of households with income $50k - 60k:| Thornton: | 8.5% (1,174) |
| State: | 8.5% (4,344) |
Number of households with income $60k - 75k:| Thornton: | 13.0% (1,790) |
| State: | 13.0% (6,630) |
Number of households with income $75k - 100k:| Thornton: | 15.3% (2,104) |
| State: | 15.2% (7,783) |
Number of households with income $100k - 125k:| Thornton: | 10.8% (1,490) |
| Idaho: | 10.8% (5,521) |
Number of households with income $125k - 150k:| Thornton: | 5.7% (785) |
| Idaho: | 5.7% (2,905) |
Number of households with income $150k - 200k:| Thornton: | 5.8% (799) |
| Idaho: | 5.8% (2,961) |
Number of households with income > $200k:| Thornton: | 5.2% (712) |
| State: | 5.2% (2,658) |
Aggregate household income in Thornton in 2022: $2,942,259
Median family income in Thornton in 2022:| Thornton: | $39,754 |
| State: | $71,427 |
Median non-family income in Thornton in 2022:| Thornton: | $30,809 |
| State: | $37,253 |
Change in median non-family income between 2000 and 2022:| Thornton, Idaho: | +89.6% |
| State: | +103.1% |
Median per capita income in Thornton in 2022:| Thornton: | $10,069 |
| State: | $24,713 |
Change in median per capita income between 2000 and 2022:| Thornton, Idaho: | +130.4% |
| Idaho: | +132.4% |
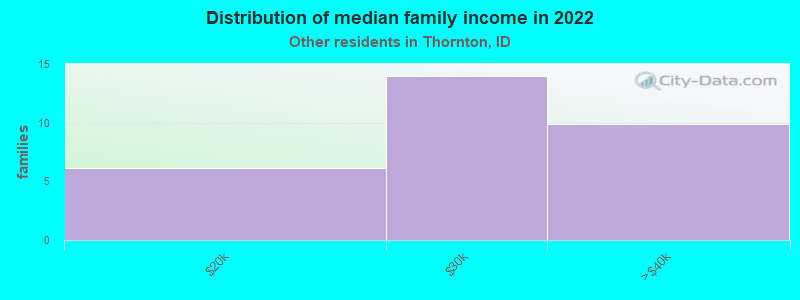
Income statistics for other residents
Number of households with income < $10k:| Thornton: | 4.7% (5) |
| State: | 4.9% (1,382) |
Number of households with income $10k - 20k:| Thornton: | 8.4% (9) |
| Idaho: | 8.5% (2,396) |
Number of households with income $20k - 30k:| Thornton: | 8.4% (9) |
| Idaho: | 8.4% (2,371) |
Number of households with income $30k - 40k:| Thornton: | 7.5% (8) |
| Idaho: | 7.6% (2,161) |
Number of households with income $40k - 50k:| Thornton: | 10.3% (11) |
| Idaho: | 10.0% (2,831) |
Number of households with income $50k - 60k:| Thornton: | 13.1% (14) |
| State: | 12.5% (3,553) |
Number of households with income $60k - 75k:| Thornton: | 10.3% (11) |
| State: | 10.6% (2,999) |
Number of households with income $75k - 100k:| Thornton: | 14.0% (15) |
| Idaho: | 14.6% (4,148) |
Number of households with income $100k - 125k:| Thornton: | 10.3% (11) |
| Idaho: | 11.1% (3,141) |
Number of households with income $125k - 150k:| Thornton: | 4.7% (5) |
| State: | 4.7% (1,327) |
Number of households with income $150k - 200k:| Thornton: | 5.6% (6) |
| State: | 4.9% (1,396) |
Number of households with income > $200k:| Thornton: | 2.8% (3) |
| State: | 2.3% (642) |
Aggregate household income in Thornton in 2022: $7,825,339
Median family income in Thornton in 2022:| Thornton: | $64,850 |
| State: | $65,091 |
Number of families with income $10k - 20k:| Thornton: | 20.5% (6) |
| State: | 3.4% (677) |
Number of families with income $20k - 30k:| Thornton: | 46.5% (14) |
| State: | 9.7% (1,953) |
Number of families with income $30k - 40k:| Thornton: | 32.9% (10) |
| Idaho: | 9.4% (1,902) |
Median non-family income in Thornton in 2022:| Thornton: | $14,779 |
| State: | $37,318 |
Change in median non-family income between 2000 and 2022:| Thornton, Idaho: | +115.0% |
| State: | +105.4% |
Median per capita income in Thornton in 2022:| Thornton: | $15,215 |
| State: | $25,492 |