The median household income in St. Simons, GA in 2022 was $95,299, which was 23.6% greater than the median annual income of $72,837 across the entire state of Georgia. Compared to the median income of $58,475 in 2000 this represents an increase of 38.6%. The per capita income in 2022 was $68,718, which means an increase of 45.8% compared to 2000 when it was $37,256.
Whole page based on the data from 2000 / 2022 when the population of St. Simons, Georgia was 13,381 / 16,080
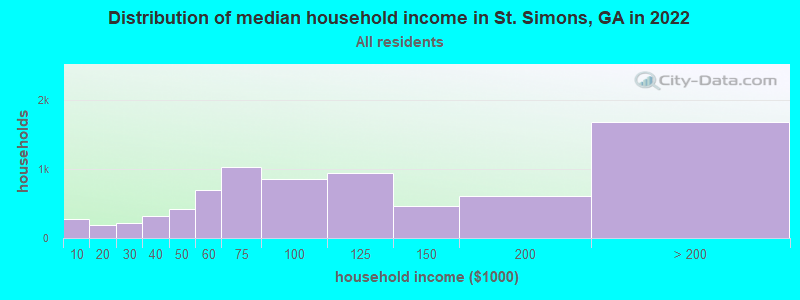
Income statistics for all residents
Median household income in St. Simons, GA in 2022:
St. Simons:
$95,299
State:
$72,837
Change in median household income between 2000 and 2022:
St. Simons, Georgia:
+63.0%
State:
+71.7%
Number of households with income < $10k:
St. Simons:
3.6% (275)
State:
5.6% (229,257)
Number of households with income $10k - 20k:
St. Simons:
2.4% (184)
State:
7.0% (285,929)
Number of households with income $20k - 30k:
St. Simons:
2.9% (221)
State:
7.1% (290,416)
Number of households with income $30k - 40k:
St. Simons:
4.2% (321)
State:
7.4% (304,514)
Number of households with income $40k - 50k:
St. Simons:
5.4% (418)
State:
7.5% (306,115)
Number of households with income $50k - 60k:
St. Simons:
9.0% (692)
State:
7.0% (287,636)
Number of households with income $60k - 75k:
St. Simons:
13.3% (1,030)
State:
9.8% (399,796)
Number of households with income $75k - 100k:
St. Simons:
11.2% (863)
State:
13.3% (545,843)
Number of households with income $100k - 125k:
St. Simons:
12.2% (942)
State:
9.9% (404,546)
Number of households with income $125k - 150k:
St. Simons:
6.1% (470)
Georgia:
7.0% (286,306)
Number of households with income $150k - 200k:
St. Simons:
8.0% (614)
State:
8.2% (335,507)
Number of households with income > $200k:
St. Simons:
21.9% (1,686)
Georgia:
10.2% (416,602)
Aggregate household income in St. Simons in 2022: $1,120,201,495
Median family income in St. Simons in 2022:
St. Simons:
$104,598
State:
$86,642
Number of families with income < $10k:
St. Simons:
2.0% (107)
State:
3.8% (103,600)
Number of families with income $10k - 20k:
St. Simons:
1.2% (66)
Georgia:
3.8% (103,872)
Number of families with income $20k - 30k:
St. Simons:
1.2% (65)
State:
5.4% (148,363)
Number of families with income $30k - 40k:
St. Simons:
3.9% (214)
State:
6.4% (174,443)
Number of families with income $40k - 50k:
St. Simons:
5.8% (317)
Georgia:
6.8% (186,605)
Number of families with income $50k - 60k:
St. Simons:
6.1% (332)
State:
6.7% (184,297)
Number of families with income $60k - 75k:
St. Simons:
10.1% (550)
State:
9.8% (268,515)
Number of families with income $75k - 100k:
St. Simons:
10.3% (561)
Georgia:
14.3% (392,121)
Number of families with income $100k - 125k:
St. Simons:
14.9% (811)
Georgia:
11.3% (307,809)
Number of families with income $125k - 150k:
St. Simons:
5.6% (304)
State:
8.1% (222,593)
Number of families with income $150k - 200k:
St. Simons:
10.4% (562)
Georgia:
10.1% (276,126)
Number of families with income > $200k:
St. Simons:
28.3% (1,537)
State:
13.4% (364,890)
Median non-family income in St. Simons in 2022:
St. Simons:
$54,040
State:
$44,656
Change in median non-family income between 2000 and 2022:
St. Simons, Georgia:
+46.7%
State:
+68.5%
Median per capita income in St. Simons in 2022:
St. Simons:
$68,719
State:
$38,378
Change in median per capita income between 2000 and 2022:
St. Simons, Georgia:
+84.5%
Georgia:
+81.4%
Income statistics for White residents
Median household income in St. Simons, GA in 2022:
St. Simons:
$95,409
Georgia:
$82,397
Change in median household income between 2000 and 2022:
St. Simons, Georgia:
+61.1%
State:
+72.3%
Number of households with income < $10k:
St. Simons:
2.7% (188)
State:
4.1% (92,223)
Number of households with income $10k - 20k:
St. Simons:
2.7% (190)
Georgia:
5.7% (129,017)
Number of households with income $20k - 30k:
St. Simons:
4.5% (311)
Georgia:
6.2% (140,832)
Number of households with income $30k - 40k:
St. Simons:
5.2% (363)
State:
6.4% (144,887)
Number of households with income $40k - 50k:
St. Simons:
4.8% (335)
Georgia:
7.0% (157,922)
Number of households with income $50k - 60k:
St. Simons:
8.7% (601)
State:
6.8% (153,079)
Number of households with income $60k - 75k:
St. Simons:
10.6% (738)
State:
9.4% (211,282)
Number of households with income $75k - 100k:
St. Simons:
13.5% (937)
State:
13.6% (306,007)
Number of households with income $100k - 125k:
St. Simons:
14.0% (975)
State:
10.5% (236,501)
Number of households with income $125k - 150k:
St. Simons:
6.1% (423)
State:
7.9% (178,986)
Number of households with income $150k - 200k:
St. Simons:
7.5% (523)
Georgia:
9.6% (216,095)
Number of households with income > $200k:
St. Simons:
19.6% (1,362)
State:
12.7% (286,989)
Aggregate household income in St. Simons in 2022: $1,020,050,341
Median family income in St. Simons in 2022:
St. Simons:
$114,333
Georgia:
$99,049
Number of families with income < $10k:
St. Simons:
1.6% (75)
State:
2.2% (33,594)
Number of families with income $10k - 20k:
St. Simons:
2.2% (109)
Georgia:
2.8% (42,787)
Number of families with income $20k - 30k:
St. Simons:
1.9% (91)
State:
4.0% (60,599)
Number of families with income $30k - 40k:
St. Simons:
4.0% (192)
Georgia:
5.1% (78,242)
Number of families with income $40k - 50k:
St. Simons:
5.6% (273)
Georgia:
6.2% (94,652)
Number of families with income $50k - 60k:
St. Simons:
5.4% (260)
Georgia:
6.2% (95,179)
Number of families with income $60k - 75k:
St. Simons:
7.9% (380)
Georgia:
9.2% (141,002)
Number of families with income $75k - 100k:
St. Simons:
13.5% (654)
State:
14.7% (224,392)
Number of families with income $100k - 125k:
St. Simons:
17.1% (827)
State:
11.9% (181,130)
Number of families with income $125k - 150k:
St. Simons:
5.7% (276)
State:
9.3% (141,570)
Number of families with income $150k - 200k:
St. Simons:
10.1% (489)
State:
11.8% (180,140)
Number of families with income > $200k:
St. Simons:
25.0% (1,209)
State:
16.5% (251,188)
Median non-family income in St. Simons in 2022:
St. Simons:
$49,889
Georgia:
$48,516
Change in median non-family income between 2000 and 2022:
St. Simons, Georgia:
+36.4%
State:
+68.6%
Median per capita income in St. Simons in 2022:
St. Simons:
$70,890
State:
$45,764
Change in median per capita income between 2000 and 2022:
St. Simons, Georgia:
+87.4%
State:
+85.1%
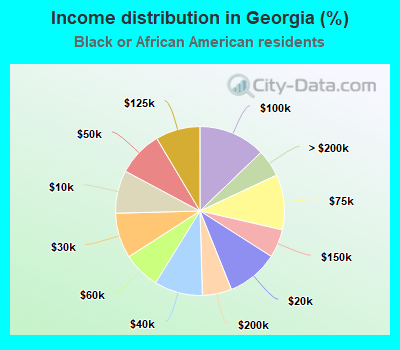
Income statistics for Black or African American residents
Number of households with income < $10k:
St. Simons:
0.0% (0)
Georgia:
8.2% (104,281)
Number of households with income $10k - 20k:
St. Simons:
1.0% (1)
State:
9.9% (125,572)
Number of households with income $20k - 30k:
St. Simons:
9.3% (9)
State:
8.7% (109,854)
Number of households with income $30k - 40k:
St. Simons:
0.0% (0)
State:
9.3% (117,673)
Number of households with income $40k - 50k:
St. Simons:
0.0% (0)
Georgia:
8.6% (109,631)
Number of households with income $50k - 60k:
St. Simons:
15.5% (15)
State:
7.1% (89,835)
Number of households with income $60k - 75k:
St. Simons:
0.0% (0)
State:
10.6% (133,810)
Number of households with income $75k - 100k:
St. Simons:
23.7% (23)
State:
12.8% (162,675)
Number of households with income $100k - 125k:
St. Simons:
0.0% (0)
Georgia:
8.5% (108,361)
Number of households with income $125k - 150k:
St. Simons:
13.4% (13)
State:
5.4% (69,094)
Number of households with income $150k - 200k:
St. Simons:
37.1% (36)
State:
5.6% (71,287)
Number of households with income > $200k:
St. Simons:
0.0% (0)
State:
5.2% (66,089)
Aggregate household income in St. Simons in 2022: $11,159,970
Median family income in St. Simons in 2022:
St. Simons:
$166,041
Georgia:
$68,633
Number of families with income $50k - 60k:
St. Simons:
17.6% (15)
Georgia:
7.3% (57,291)
Number of families with income $75k - 100k:
St. Simons:
26.2% (22)
State:
13.8% (108,499)
Number of families with income $125k - 150k:
St. Simons:
14.9% (13)
State:
6.6% (51,839)
Number of families with income $150k - 200k:
St. Simons:
41.3% (35)
State:
7.3% (57,526)
Median per capita income in St. Simons in 2022:
St. Simons:
$42,537
State:
$29,935
Change in median per capita income between 2000 and 2022:
St. Simons, Georgia:
+62.0%
State:
+108.3%
Income statistics for Asian residents
Aggregate household income in St. Simons in 2022: $10,774,945
Median per capita income in St. Simons in 2022:
St. Simons:
$51,447
State:
$47,657
Change in median per capita income between 2000 and 2022:: -20.1%
St. Simons, Georgia:
-20.1%
Georgia:
+136.5%
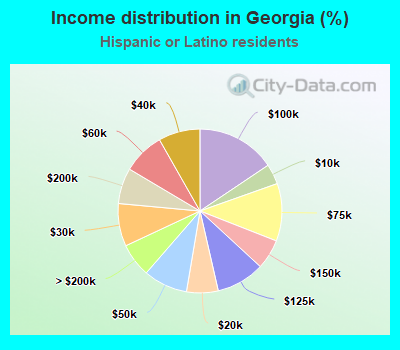
Income statistics for Hispanic or Latino residents
Number of households with income < $10k:
St. Simons:
15.2% (30)
Georgia:
4.0% (12,188)
Number of households with income $10k - 20k:
St. Simons:
0.0% (0)
State:
6.2% (19,063)
Number of households with income $20k - 30k:
St. Simons:
0.0% (0)
State:
8.4% (25,797)
Number of households with income $30k - 40k:
St. Simons:
0.0% (0)
State:
8.2% (25,127)
Number of households with income $40k - 50k:
St. Simons:
0.0% (0)
State:
8.7% (26,632)
Number of households with income $50k - 60k:
St. Simons:
16.2% (32)
State:
8.2% (25,168)
Number of households with income $60k - 75k:
St. Simons:
14.6% (29)
Georgia:
11.4% (34,734)
Number of households with income $75k - 100k:
St. Simons:
10.1% (20)
Georgia:
15.6% (47,647)
Number of households with income $100k - 125k:
St. Simons:
13.6% (27)
State:
9.6% (29,177)
Number of households with income $125k - 150k:
St. Simons:
0.0% (0)
Georgia:
5.9% (18,075)
Number of households with income $150k - 200k:
St. Simons:
30.3% (60)
State:
7.1% (21,562)
Number of households with income > $200k:
St. Simons:
0.0% (0)
Georgia:
6.7% (20,315)
Aggregate household income in St. Simons in 2022: $24,564,674
Median family income in St. Simons in 2022:
St. Simons:
$114,087
State:
$68,723
Number of families with income $50k - 60k:
St. Simons:
26.3% (33)
State:
8.2% (19,635)
Number of families with income $60k - 75k:
St. Simons:
24.1% (30)
State:
11.5% (27,479)
Number of families with income $75k - 100k:
St. Simons:
16.4% (20)
State:
16.1% (38,405)
Number of families with income $100k - 125k:
St. Simons:
22.6% (28)
State:
9.2% (21,972)
Number of families with income $150k - 200k:
St. Simons:
10.6% (13)
Georgia:
7.7% (18,324)
Median per capita income in St. Simons in 2022:
St. Simons:
$42,813
State:
$25,080
Change in median per capita income between 2000 and 2022:: -8.9%
St. Simons, Georgia:
-8.9%
Georgia:
+99.4%
Income statistics for American Indian and Alaska Native residents
Median per capita income in St. Simons in 2022:
St. Simons:
$25,023
State:
$21,409
Change in median per capita income between 2000 and 2022:: -37.4%
St. Simons, Georgia:
-37.4%
State:
+23.5%
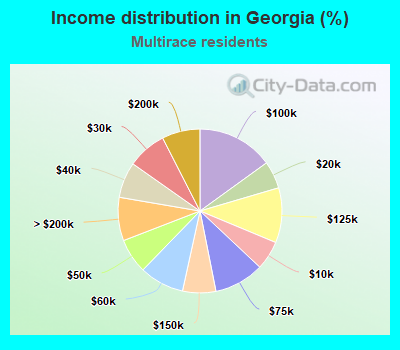
Income statistics for Multirace residents
Median household income in St. Simons, GA in 2022:
St. Simons:
$112,699
Georgia:
$72,520
Number of households with income < $10k:
St. Simons:
0.0% (0)
State:
5.7% (14,963)
Number of households with income $10k - 20k:
St. Simons:
0.0% (0)
Georgia:
5.4% (14,136)
Number of households with income $20k - 30k:
St. Simons:
0.0% (0)
State:
7.7% (20,123)
Number of households with income $30k - 40k:
St. Simons:
0.0% (0)
Georgia:
7.1% (18,449)
Number of households with income $40k - 50k:
St. Simons:
25.0% (74)
State:
6.9% (17,943)
Number of households with income $50k - 60k:
St. Simons:
10.8% (32)
State:
8.8% (22,996)
Number of households with income $60k - 75k:
St. Simons:
0.0% (0)
State:
9.9% (25,722)
Number of households with income $75k - 100k:
St. Simons:
28.7% (85)
Georgia:
15.0% (39,219)
Number of households with income $100k - 125k:
St. Simons:
2.0% (6)
State:
10.8% (28,252)
Number of households with income $125k - 150k:
St. Simons:
0.0% (0)
Georgia:
6.6% (17,124)
Number of households with income $150k - 200k:
St. Simons:
15.5% (46)
State:
7.5% (19,615)
Number of households with income > $200k:
St. Simons:
17.9% (53)
Georgia:
8.6% (22,328)
Aggregate household income in St. Simons in 2022: $72,447,087
Median per capita income in St. Simons in 2022:
St. Simons:
$85,127
Georgia:
$28,402
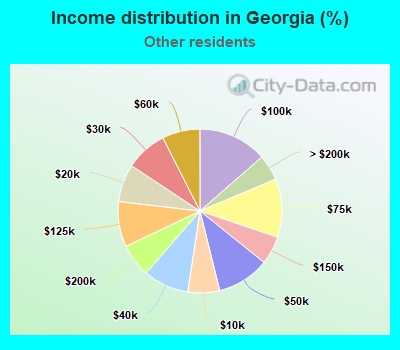
Income statistics for other residents
Number of households with income < $10k:
St. Simons:
0.0% (0)
State:
6.3% (7,985)
Number of households with income $10k - 20k:
St. Simons:
0.0% (0)
State:
7.4% (9,485)
Number of households with income $20k - 30k:
St. Simons:
0.0% (0)
State:
8.2% (10,477)
Number of households with income $30k - 40k:
St. Simons:
0.0% (0)
State:
9.0% (11,439)
Number of households with income $40k - 50k:
St. Simons:
0.0% (0)
Georgia:
10.3% (13,166)
Number of households with income $50k - 60k:
St. Simons:
39.3% (22)
State:
7.5% (9,494)
Number of households with income $60k - 75k:
St. Simons:
60.7% (34)
Georgia:
11.5% (14,661)
Number of households with income $75k - 100k:
St. Simons:
0.0% (0)
State:
13.6% (17,309)
Number of households with income $100k - 125k:
St. Simons:
0.0% (0)
State:
9.0% (11,418)
Number of households with income $125k - 150k:
St. Simons:
0.0% (0)
State:
5.6% (7,128)
Number of households with income $150k - 200k:
St. Simons:
0.0% (0)
State:
6.5% (8,311)
Number of households with income > $200k:
St. Simons:
0.0% (0)
Georgia:
5.1% (6,490)
Aggregate household income in St. Simons in 2022: $10,837,735
Median per capita income in St. Simons in 2022:
St. Simons:
$16,089
State:
$23,261
Change in median per capita income between 2000 and 2022:: -29.4%
St. Simons, Georgia:
-29.4%
Georgia:
+110.6%
Discuss St. Simons, Georgia (GA) on our hugely popular Georgia forum.