Southeast Hidalgo, Texas (TX) income map, earnings map, and wages data
The median household income in Southeast Hidalgo, TX in 2022 was $45,204, which was 59.9% less than the median annual income of $72,284 across the entire state of Texas. Compared to the median income of $22,871 in 2000 this represents an increase of 49.4%. The per capita income in 2022 was $18,004, which means an increase of 53.2% compared to 2000 when it was $8,432.
Income statistics for all residents
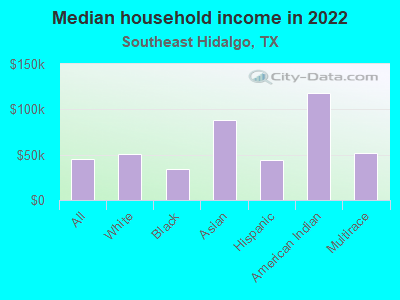
Median household income in Southeast Hidalgo, TX in 2022:| Southeast Hidalgo: | $45,205 |
| State: | $72,284 |
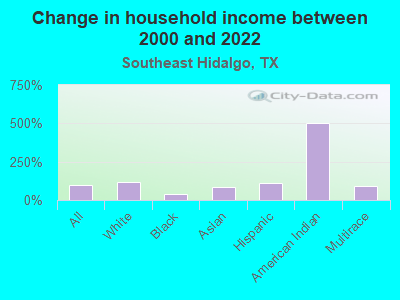
Change in median household income between 2000 and 2022:| Southeast Hidalgo, Texas: | +97.7% |
| State: | +81.0% |
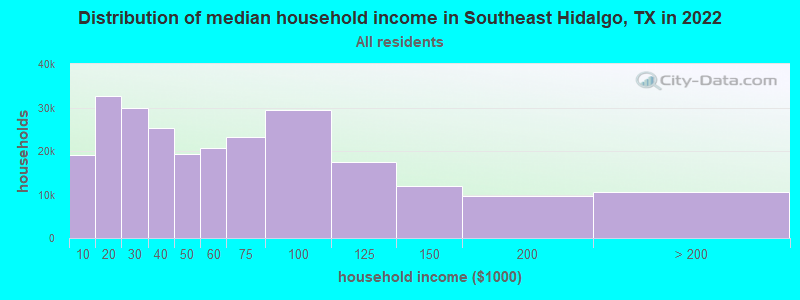
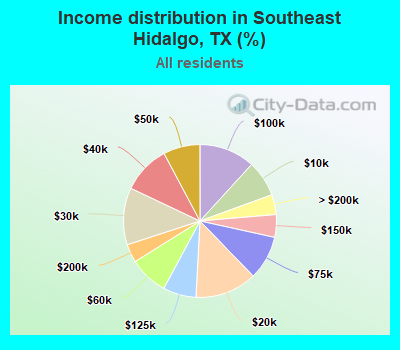
Number of households with income < $10k:| Southeast Hidalgo: | 7.7% (19,074) |
| State: | 5.5% (611,011) |
Number of households with income $10k - 20k:| Southeast Hidalgo: | 13.1% (32,563) |
| State: | 6.7% (743,157) |
Number of households with income $20k - 30k:| Southeast Hidalgo: | 12.0% (29,999) |
| Texas: | 7.2% (803,381) |
Number of households with income $30k - 40k:| Southeast Hidalgo: | 10.2% (25,387) |
| State: | 7.8% (866,080) |
Number of households with income $40k - 50k:| Southeast Hidalgo: | 7.8% (19,370) |
| State: | 7.3% (810,440) |
Number of households with income $50k - 60k:| Southeast Hidalgo: | 8.3% (20,606) |
| State: | 7.2% (799,783) |
Number of households with income $60k - 75k:| Southeast Hidalgo: | 9.3% (23,251) |
| State: | 9.9% (1,095,384) |
Number of households with income $75k - 100k:| Southeast Hidalgo: | 11.8% (29,394) |
| State: | 12.8% (1,419,057) |
Number of households with income $100k - 125k:| Southeast Hidalgo: | 7.0% (17,445) |
| State: | 9.5% (1,054,577) |
Number of households with income $125k - 150k:| Southeast Hidalgo: | 4.8% (11,919) |
| State: | 6.7% (741,518) |
Number of households with income $150k - 200k:| Southeast Hidalgo: | 3.9% (9,682) |
| State: | 8.7% (961,776) |
Number of households with income > $200k:| Southeast Hidalgo: | 4.2% (10,499) |
| Texas: | 10.7% (1,181,544) |
Aggregate household income in Southeast Hidalgo in 2022: $7,367,850,346
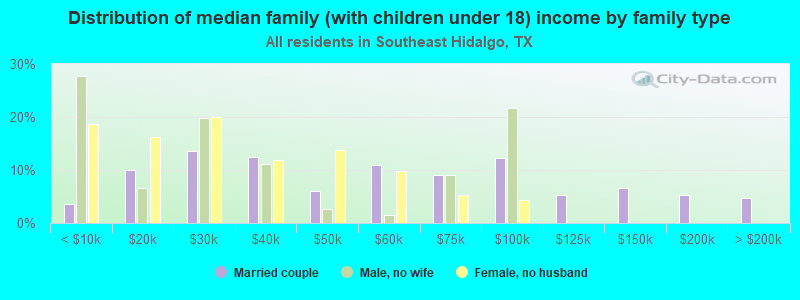
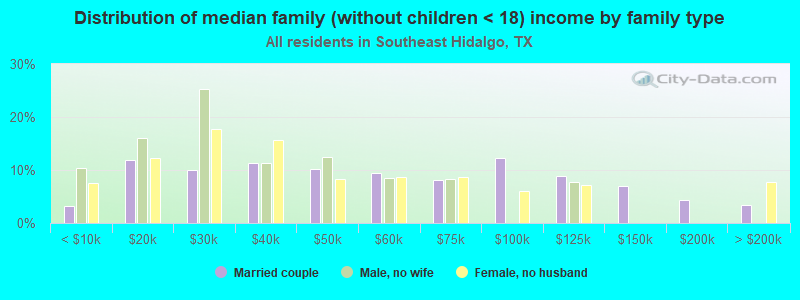
Median family income in Southeast Hidalgo in 2022:| Southeast Hidalgo: | $50,351 |
| Texas: | $86,267 |
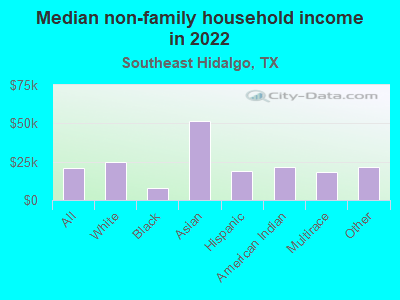
Median non-family income in Southeast Hidalgo in 2022:| Southeast Hidalgo: | $20,743 |
| State: | $45,999 |
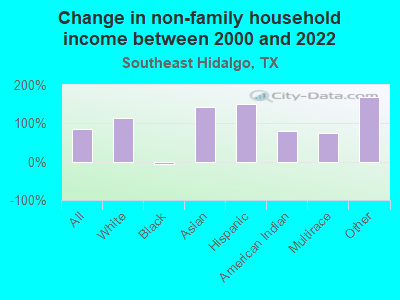
Change in median non-family income between 2000 and 2022:| Southeast Hidalgo, Texas: | +83.5% |
| Texas: | +79.5% |
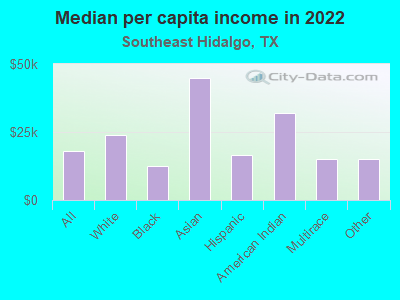
Median per capita income in Southeast Hidalgo in 2022:| Southeast Hidalgo: | $18,005 |
| State: | $38,123 |
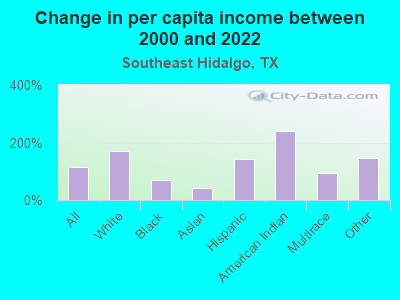
Change in median per capita income between 2000 and 2022:| Southeast Hidalgo, Texas: | +113.5% |
| State: | +94.3% |
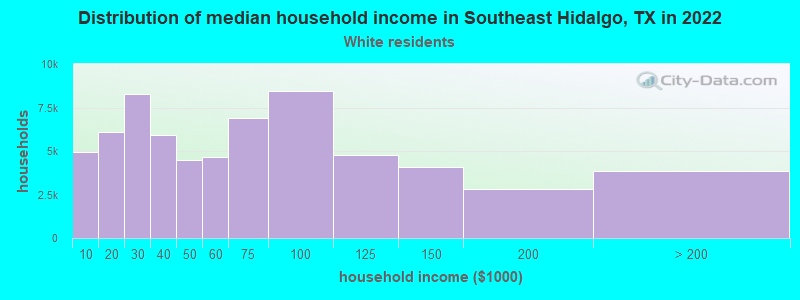
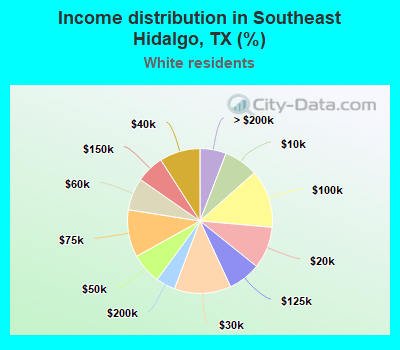
Income statistics for White residents
Median household income in Southeast Hidalgo, TX in 2022:| Southeast Hidalgo: | $51,007 |
| State: | $82,032 |
Change in median household income between 2000 and 2022:| Southeast Hidalgo, Texas: | +117.1% |
| Texas: | +91.0% |
Number of households with income < $10k:| Southeast Hidalgo: | 7.6% (4,947) |
| Texas: | 4.7% (273,716) |
Number of households with income $10k - 20k:| Southeast Hidalgo: | 9.4% (6,108) |
| State: | 5.5% (322,702) |
Number of households with income $20k - 30k:| Southeast Hidalgo: | 12.7% (8,254) |
| State: | 6.2% (363,947) |
Number of households with income $30k - 40k:| Southeast Hidalgo: | 9.1% (5,900) |
| State: | 6.8% (399,275) |
Number of households with income $40k - 50k:| Southeast Hidalgo: | 6.9% (4,473) |
| State: | 6.5% (383,417) |
Number of households with income $50k - 60k:| Southeast Hidalgo: | 7.2% (4,671) |
| Texas: | 6.6% (388,535) |
Number of households with income $60k - 75k:| Southeast Hidalgo: | 10.6% (6,899) |
| State: | 9.7% (566,295) |
Number of households with income $75k - 100k:| Southeast Hidalgo: | 12.9% (8,428) |
| Texas: | 13.0% (760,276) |
Number of households with income $100k - 125k:| Southeast Hidalgo: | 7.3% (4,756) |
| State: | 10.2% (597,596) |
Number of households with income $125k - 150k:| Southeast Hidalgo: | 6.3% (4,079) |
| State: | 7.4% (436,830) |
Number of households with income $150k - 200k:| Southeast Hidalgo: | 4.3% (2,805) |
| State: | 9.9% (583,067) |
Number of households with income > $200k:| Southeast Hidalgo: | 5.9% (3,827) |
| State: | 13.5% (792,647) |
Aggregate household income in Southeast Hidalgo in 2022: $1,784,405,981
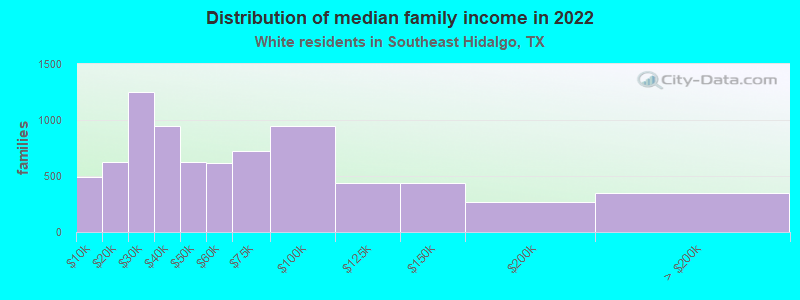
Median family income in Southeast Hidalgo in 2022:| Southeast Hidalgo: | $59,192 |
| Texas: | $101,788 |
Number of families with income < $10k:| Southeast Hidalgo: | 6.3% (487) |
| State: | 2.8% (108,142) |
Number of families with income $10k - 20k:| Southeast Hidalgo: | 8.1% (623) |
| State: | 2.9% (113,421) |
Number of families with income $20k - 30k:| Southeast Hidalgo: | 16.2% (1,246) |
| State: | 4.1% (157,688) |
Number of families with income $30k - 40k:| Southeast Hidalgo: | 12.3% (948) |
| State: | 5.2% (198,847) |
Number of families with income $40k - 50k:| Southeast Hidalgo: | 8.1% (622) |
| Texas: | 5.6% (216,490) |
Number of families with income $50k - 60k:| Southeast Hidalgo: | 8.0% (620) |
| Texas: | 5.7% (220,689) |
Number of families with income $60k - 75k:| Southeast Hidalgo: | 9.4% (724) |
| Texas: | 9.0% (346,106) |
Number of families with income $75k - 100k:| Southeast Hidalgo: | 12.3% (945) |
| State: | 13.7% (527,363) |
Number of families with income $100k - 125k:| Southeast Hidalgo: | 5.6% (434) |
| Texas: | 11.6% (448,411) |
Number of families with income $125k - 150k:| Southeast Hidalgo: | 5.6% (435) |
| State: | 9.2% (355,798) |
Number of families with income $150k - 200k:| Southeast Hidalgo: | 3.5% (270) |
| State: | 12.5% (480,185) |
Number of families with income > $200k:| Southeast Hidalgo: | 4.6% (351) |
| State: | 17.6% (677,490) |
Median non-family income in Southeast Hidalgo in 2022:| Southeast Hidalgo: | $25,010 |
| State: | $50,587 |
Change in median non-family income between 2000 and 2022:| Southeast Hidalgo, Texas: | +112.7% |
| State: | +87.7% |
Median per capita income in Southeast Hidalgo in 2022:| Southeast Hidalgo: | $24,015 |
| Texas: | $47,740 |
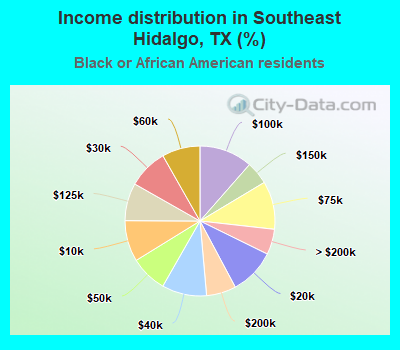
Income statistics for Black or African American residents
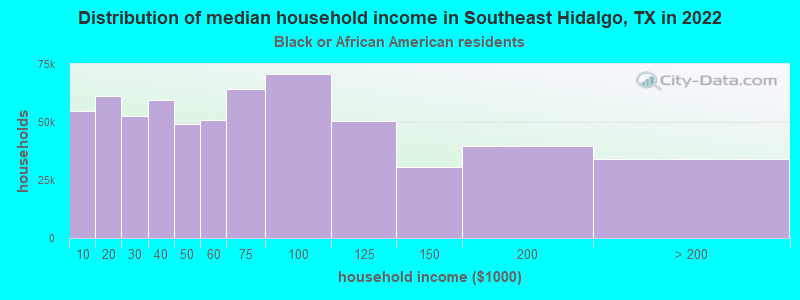
Median household income in Southeast Hidalgo, TX in 2022:| Southeast Hidalgo: | $34,638 |
| State: | $55,759 |
Change in median household income between 2000 and 2022:| Southeast Hidalgo, Texas: | +35.6% |
| State: | +90.3% |
Number of households with income < $10k:| Southeast Hidalgo: | 8.9% (54,860) |
| State: | 8.9% (126,378) |
Number of households with income $10k - 20k:| Southeast Hidalgo: | 9.9% (61,333) |
| State: | 9.9% (140,369) |
Number of households with income $20k - 30k:| Southeast Hidalgo: | 8.5% (52,768) |
| Texas: | 8.5% (120,639) |
Number of households with income $30k - 40k:| Southeast Hidalgo: | 9.7% (59,660) |
| State: | 9.7% (137,517) |
Number of households with income $40k - 50k:| Southeast Hidalgo: | 7.9% (49,012) |
| State: | 8.0% (112,973) |
Number of households with income $50k - 60k:| Southeast Hidalgo: | 8.2% (50,785) |
| Texas: | 8.3% (117,156) |
Number of households with income $60k - 75k:| Southeast Hidalgo: | 10.4% (64,109) |
| State: | 10.4% (147,462) |
Number of households with income $75k - 100k:| Southeast Hidalgo: | 11.5% (70,787) |
| State: | 11.5% (162,718) |
Number of households with income $100k - 125k:| Southeast Hidalgo: | 8.1% (50,260) |
| Texas: | 8.2% (115,829) |
Number of households with income $125k - 150k:| Southeast Hidalgo: | 4.9% (30,456) |
| Texas: | 4.9% (69,556) |
Number of households with income $150k - 200k:| Southeast Hidalgo: | 6.4% (39,446) |
| State: | 6.4% (90,701) |
Number of households with income > $200k:| Southeast Hidalgo: | 5.5% (33,889) |
| State: | 5.5% (77,988) |
Aggregate household income in Southeast Hidalgo in 2022: $4,873,540
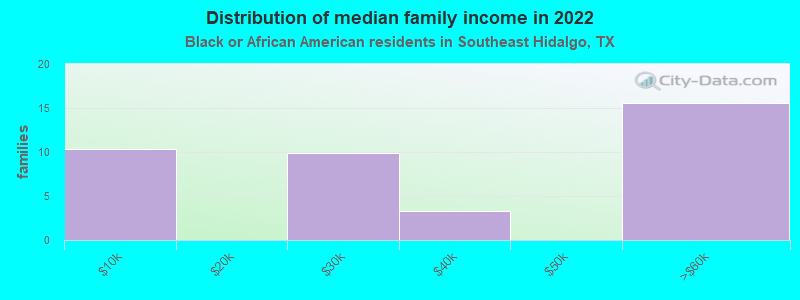
Median family income in Southeast Hidalgo in 2022:| Southeast Hidalgo: | $46,490 |
| Texas: | $69,134 |
Number of families with income < $10k:| Southeast Hidalgo: | 26.5% (10) |
| Texas: | 6.8% (55,625) |
Number of families with income $20k - 30k:| Southeast Hidalgo: | 25.4% (10) |
| State: | 7.1% (57,877) |
Number of families with income $30k - 40k:| Southeast Hidalgo: | 8.4% (3) |
| Texas: | 8.5% (68,776) |
Number of families with income $50k - 60k:| Southeast Hidalgo: | 39.7% (16) |
| State: | 7.3% (59,511) |
Median non-family income in Southeast Hidalgo in 2022:| Southeast Hidalgo: | $8,116 |
| Texas: | $40,133 |
Median per capita income in Southeast Hidalgo in 2022:| Southeast Hidalgo: | $12,431 |
| State: | $30,490 |
Change in median per capita income between 2000 and 2022:| Southeast Hidalgo, Texas: | +71.2% |
| Texas: | +113.9% |
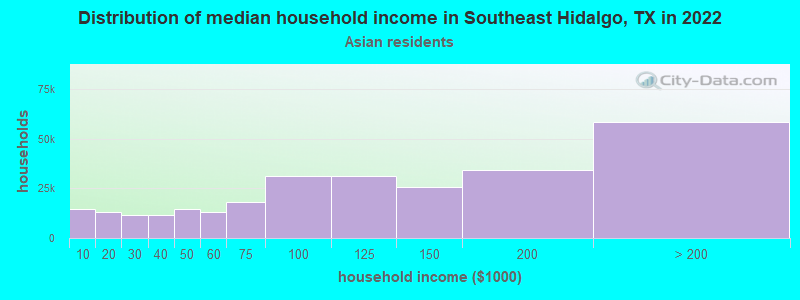
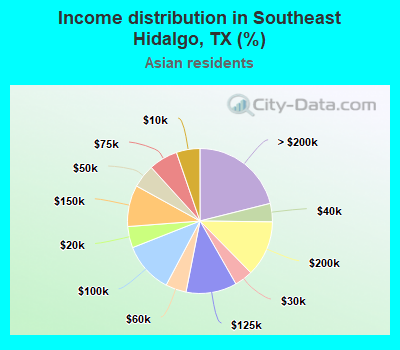
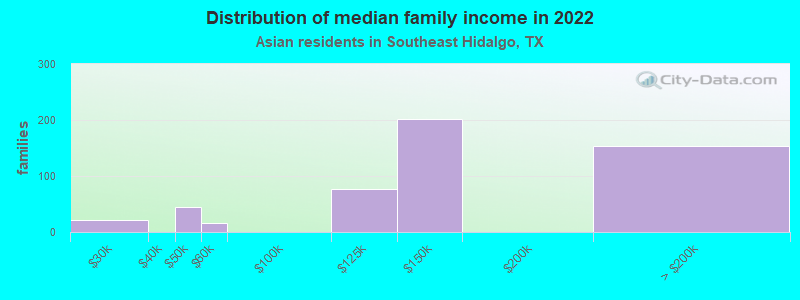
Income statistics for Asian residents
Median household income in Southeast Hidalgo, TX in 2022:| Southeast Hidalgo: | $88,455 |
| State: | $107,673 |
Change in median household income between 2000 and 2022:| Southeast Hidalgo, Texas: | +82.1% |
| Texas: | +115.1% |
Number of households with income < $10k:| Southeast Hidalgo: | 5.3% (14,520) |
| Texas: | 5.2% (29,885) |
Number of households with income $10k - 20k:| Southeast Hidalgo: | 4.8% (13,138) |
| State: | 4.7% (27,044) |
Number of households with income $20k - 30k:| Southeast Hidalgo: | 4.1% (11,323) |
| State: | 4.1% (23,363) |
Number of households with income $30k - 40k:| Southeast Hidalgo: | 4.1% (11,319) |
| State: | 4.1% (23,309) |
Number of households with income $40k - 50k:| Southeast Hidalgo: | 5.2% (14,471) |
| State: | 5.2% (29,826) |
Number of households with income $50k - 60k:| Southeast Hidalgo: | 4.6% (12,837) |
| State: | 4.7% (26,512) |
Number of households with income $60k - 75k:| Southeast Hidalgo: | 6.5% (17,928) |
| State: | 6.5% (36,905) |
Number of households with income $75k - 100k:| Southeast Hidalgo: | 11.3% (31,175) |
| State: | 11.3% (64,350) |
Number of households with income $100k - 125k:| Southeast Hidalgo: | 11.3% (31,374) |
| State: | 11.4% (64,714) |
Number of households with income $125k - 150k:| Southeast Hidalgo: | 9.3% (25,578) |
| State: | 9.3% (52,719) |
Number of households with income $150k - 200k:| Southeast Hidalgo: | 12.5% (34,430) |
| State: | 12.5% (70,953) |
Number of households with income > $200k:| Southeast Hidalgo: | 21.1% (58,353) |
| State: | 21.1% (120,260) |
Aggregate household income in Southeast Hidalgo in 2022: $40,697,393
Median family income in Southeast Hidalgo in 2022:| Southeast Hidalgo: | $214,103 |
| State: | $123,328 |
Number of families with income $20k - 30k:| Southeast Hidalgo: | 4.1% (21) |
| Texas: | 3.4% (14,738) |
Number of families with income $40k - 50k:| Southeast Hidalgo: | 8.7% (45) |
| State: | 4.9% (21,622) |
Number of families with income $50k - 60k:| Southeast Hidalgo: | 3.1% (16) |
| Texas: | 4.7% (20,568) |
Number of families with income $100k - 125k:| Southeast Hidalgo: | 14.9% (77) |
| State: | 11.3% (49,585) |
Number of families with income $125k - 150k:| Southeast Hidalgo: | 39.3% (202) |
| State: | 9.8% (43,043) |
Number of families with income > $200k:| Southeast Hidalgo: | 29.8% (153) |
| Texas: | 24.8% (108,511) |
Median non-family income in Southeast Hidalgo in 2022:| Southeast Hidalgo: | $51,586 |
| Texas: | $64,320 |
Change in median non-family income between 2000 and 2022:| Southeast Hidalgo, Texas: | +142.8% |
| State: | +131.1% |
Median per capita income in Southeast Hidalgo in 2022:| Southeast Hidalgo: | $44,829 |
| State: | $48,626 |
Change in median per capita income between 2000 and 2022:| Southeast Hidalgo, Texas: | +42.9% |
| Texas: | +132.0% |
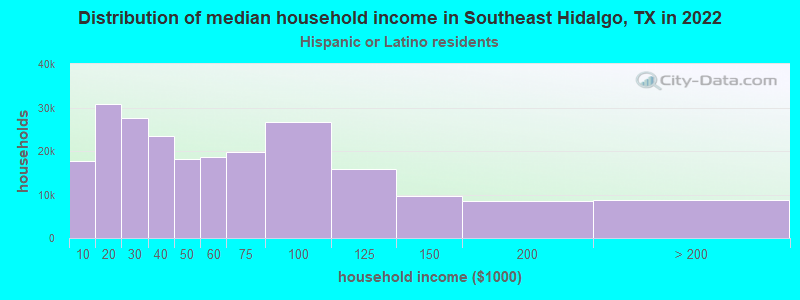
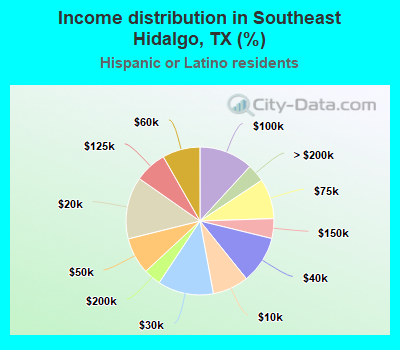
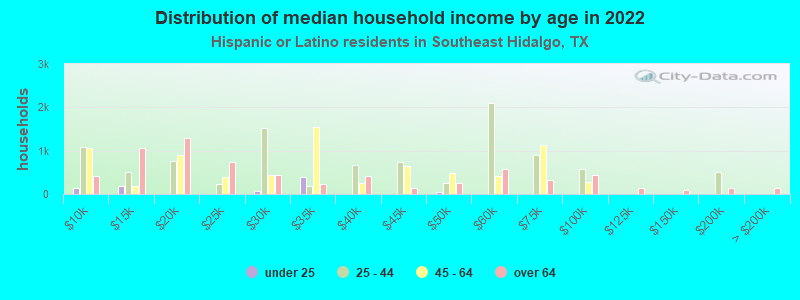
Income statistics for Hispanic or Latino residents
Median household income in Southeast Hidalgo, TX in 2022:| Southeast Hidalgo: | $44,499 |
| State: | $60,504 |
Change in median household income between 2000 and 2022:| Southeast Hidalgo, Texas: | +112.9% |
| State: | +102.5% |
Number of households with income < $10k:| Southeast Hidalgo: | 7.9% (17,815) |
| Texas: | 5.8% (213,953) |
Number of households with income $10k - 20k:| Southeast Hidalgo: | 13.6% (30,733) |
| Texas: | 8.0% (297,456) |
Number of households with income $20k - 30k:| Southeast Hidalgo: | 12.2% (27,606) |
| State: | 9.2% (340,166) |
Number of households with income $30k - 40k:| Southeast Hidalgo: | 10.4% (23,527) |
| Texas: | 9.5% (354,336) |
Number of households with income $40k - 50k:| Southeast Hidalgo: | 8.0% (18,122) |
| Texas: | 8.8% (327,013) |
Number of households with income $50k - 60k:| Southeast Hidalgo: | 8.3% (18,662) |
| Texas: | 8.3% (308,818) |
Number of households with income $60k - 75k:| Southeast Hidalgo: | 8.8% (19,826) |
| State: | 10.9% (405,109) |
Number of households with income $75k - 100k:| Southeast Hidalgo: | 11.8% (26,707) |
| State: | 13.8% (511,639) |
Number of households with income $100k - 125k:| Southeast Hidalgo: | 7.0% (15,890) |
| Texas: | 8.6% (319,728) |
Number of households with income $125k - 150k:| Southeast Hidalgo: | 4.3% (9,765) |
| State: | 5.7% (210,932) |
Number of households with income $150k - 200k:| Southeast Hidalgo: | 3.8% (8,576) |
| Texas: | 6.4% (236,055) |
Number of households with income > $200k:| Southeast Hidalgo: | 3.9% (8,848) |
| State: | 5.1% (189,259) |
Aggregate household income in Southeast Hidalgo in 2022: $4,578,679,323
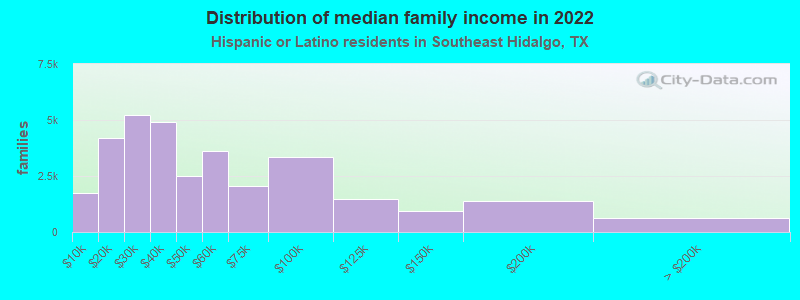
Median family income in Southeast Hidalgo in 2022:| Southeast Hidalgo: | $48,966 |
| State: | $65,080 |
Number of families with income < $10k:| Southeast Hidalgo: | 5.4% (1,732) |
| Texas: | 5.3% (147,493) |
Number of families with income $10k - 20k:| Southeast Hidalgo: | 13.1% (4,178) |
| Texas: | 6.3% (174,531) |
Number of families with income $20k - 30k:| Southeast Hidalgo: | 16.3% (5,219) |
| State: | 8.6% (238,528) |
Number of families with income $30k - 40k:| Southeast Hidalgo: | 15.4% (4,919) |
| State: | 9.1% (251,999) |
Number of families with income $40k - 50k:| Southeast Hidalgo: | 7.8% (2,510) |
| State: | 8.6% (240,188) |
Number of families with income $50k - 60k:| Southeast Hidalgo: | 11.3% (3,609) |
| State: | 8.0% (223,566) |
Number of families with income $60k - 75k:| Southeast Hidalgo: | 6.4% (2,042) |
| State: | 10.9% (302,688) |
Number of families with income $75k - 100k:| Southeast Hidalgo: | 10.5% (3,357) |
| State: | 14.3% (398,554) |
Number of families with income $100k - 125k:| Southeast Hidalgo: | 4.7% (1,495) |
| Texas: | 9.5% (264,007) |
Number of families with income $125k - 150k:| Southeast Hidalgo: | 2.9% (920) |
| State: | 6.2% (171,274) |
Number of families with income $150k - 200k:| Southeast Hidalgo: | 4.3% (1,367) |
| State: | 7.3% (202,259) |
Number of families with income > $200k:| Southeast Hidalgo: | 2.0% (627) |
| Texas: | 5.9% (165,129) |
Median non-family income in Southeast Hidalgo in 2022:| Southeast Hidalgo: | $19,033 |
| State: | $39,934 |
Median per capita income in Southeast Hidalgo in 2022:| Southeast Hidalgo: | $16,430 |
| Texas: | $24,862 |
Change in median per capita income between 2000 and 2022:| Southeast Hidalgo, Texas: | +143.5% |
| State: | +130.8% |
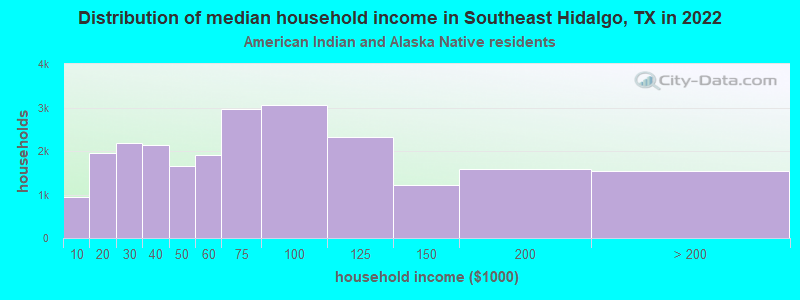
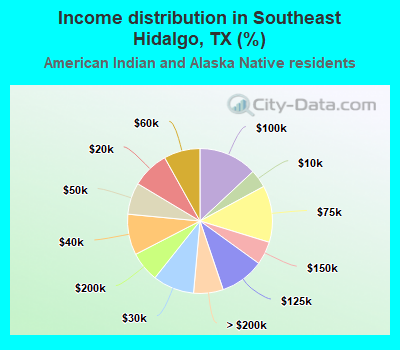
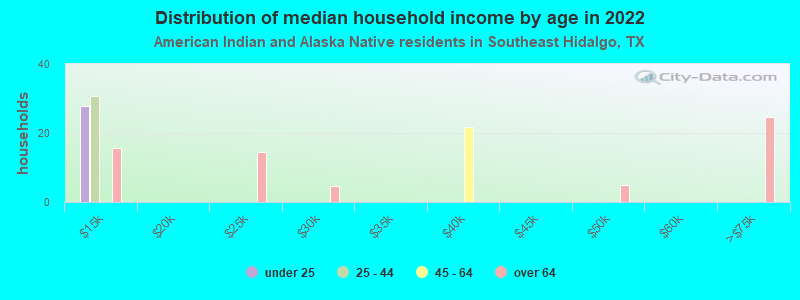
Income statistics for American Indian and Alaska Native residents
Median household income in Southeast Hidalgo, TX in 2022:| Southeast Hidalgo: | $118,522 |
| State: | $65,765 |
Number of households with income < $10k:| Southeast Hidalgo: | 4.1% (954) |
| State: | 4.1% (3,398) |
Number of households with income $10k - 20k:| Southeast Hidalgo: | 8.3% (1,952) |
| Texas: | 8.3% (6,949) |
Number of households with income $20k - 30k:| Southeast Hidalgo: | 9.3% (2,174) |
| Texas: | 9.3% (7,742) |
Number of households with income $30k - 40k:| Southeast Hidalgo: | 9.1% (2,140) |
| State: | 9.1% (7,627) |
Number of households with income $40k - 50k:| Southeast Hidalgo: | 7.1% (1,665) |
| Texas: | 7.1% (5,922) |
Number of households with income $50k - 60k:| Southeast Hidalgo: | 8.1% (1,899) |
| State: | 8.1% (6,761) |
Number of households with income $60k - 75k:| Southeast Hidalgo: | 12.7% (2,972) |
| Texas: | 12.7% (10,588) |
Number of households with income $75k - 100k:| Southeast Hidalgo: | 13.0% (3,063) |
| Texas: | 13.0% (10,903) |
Number of households with income $100k - 125k:| Southeast Hidalgo: | 9.9% (2,319) |
| Texas: | 9.9% (8,256) |
Number of households with income $125k - 150k:| Southeast Hidalgo: | 5.2% (1,222) |
| State: | 5.2% (4,355) |
Number of households with income $150k - 200k:| Southeast Hidalgo: | 6.7% (1,578) |
| Texas: | 6.7% (5,623) |
Number of households with income > $200k:| Southeast Hidalgo: | 6.6% (1,549) |
| Texas: | 6.6% (5,522) |
Aggregate household income in Southeast Hidalgo in 2022: $30,753,015
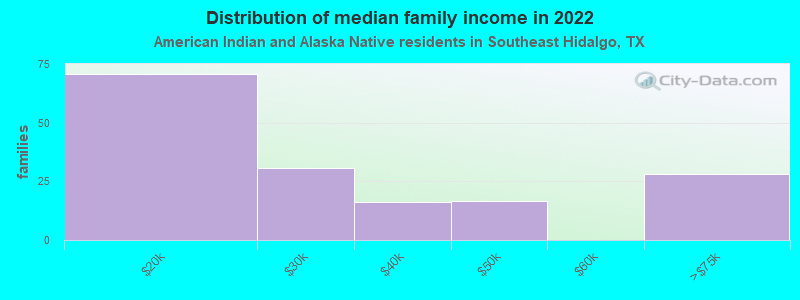
Median family income in Southeast Hidalgo in 2022:| Southeast Hidalgo: | $139,577 |
| State: | $72,369 |
Number of families with income $10k - 20k:| Southeast Hidalgo: | 43.4% (71) |
| Texas: | 8.0% (4,891) |
Number of families with income $20k - 30k:| Southeast Hidalgo: | 19.0% (31) |
| State: | 7.3% (4,502) |
Number of families with income $30k - 40k:| Southeast Hidalgo: | 10.0% (16) |
| State: | 7.5% (4,592) |
Number of families with income $40k - 50k:| Southeast Hidalgo: | 10.2% (17) |
| Texas: | 7.9% (4,855) |
Number of families with income $60k - 75k:| Southeast Hidalgo: | 17.4% (28) |
| Texas: | 12.1% (7,429) |
Median non-family income in Southeast Hidalgo in 2022:| Southeast Hidalgo: | $21,391 |
| Texas: | $40,351 |
Change in median non-family income between 2000 and 2022:| Southeast Hidalgo, Texas: | +80.1% |
| State: | +71.9% |
Median per capita income in Southeast Hidalgo in 2022:| Southeast Hidalgo: | $32,139 |
| State: | $28,166 |
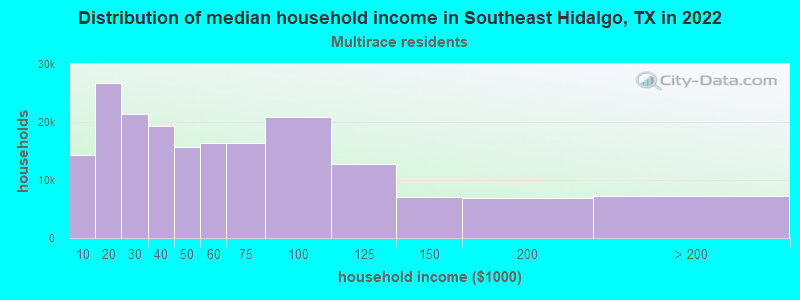
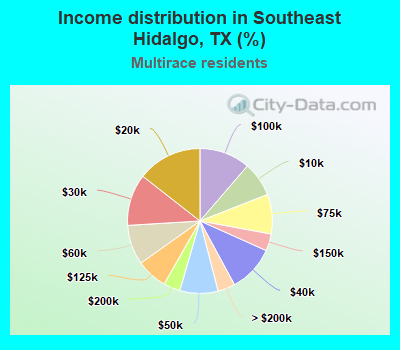
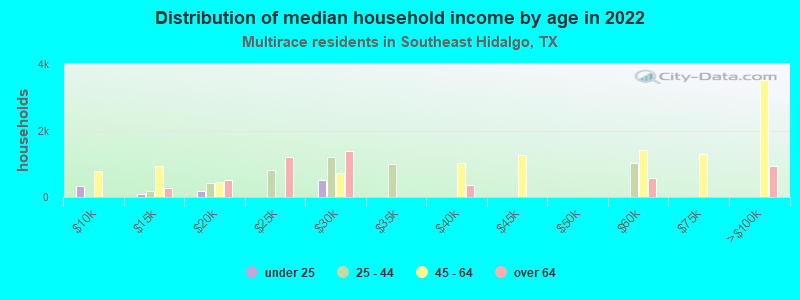
Income statistics for Multirace residents
Median household income in Southeast Hidalgo, TX in 2022:| Southeast Hidalgo: | $51,370 |
| State: | $62,748 |
Change in median household income between 2000 and 2022:| Southeast Hidalgo, Texas: | +92.6% |
| Texas: | +92.3% |
Number of households with income < $10k:| Southeast Hidalgo: | 7.7% (14,304) |
| Texas: | 5.5% (122,324) |
Number of households with income $10k - 20k:| Southeast Hidalgo: | 14.4% (26,660) |
| State: | 8.2% (182,232) |
Number of households with income $20k - 30k:| Southeast Hidalgo: | 11.5% (21,326) |
| Texas: | 8.5% (189,456) |
Number of households with income $30k - 40k:| Southeast Hidalgo: | 10.4% (19,235) |
| Texas: | 8.9% (197,499) |
Number of households with income $40k - 50k:| Southeast Hidalgo: | 8.5% (15,733) |
| State: | 8.7% (191,735) |
Number of households with income $50k - 60k:| Southeast Hidalgo: | 8.9% (16,428) |
| State: | 8.0% (177,535) |
Number of households with income $60k - 75k:| Southeast Hidalgo: | 8.8% (16,344) |
| Texas: | 10.5% (232,479) |
Number of households with income $75k - 100k:| Southeast Hidalgo: | 11.3% (20,941) |
| State: | 13.1% (290,448) |
Number of households with income $100k - 125k:| Southeast Hidalgo: | 6.9% (12,755) |
| Texas: | 8.6% (191,595) |
Number of households with income $125k - 150k:| Southeast Hidalgo: | 3.8% (7,026) |
| State: | 6.0% (133,361) |
Number of households with income $150k - 200k:| Southeast Hidalgo: | 3.7% (6,915) |
| State: | 7.2% (159,195) |
Number of households with income > $200k:| Southeast Hidalgo: | 3.9% (7,179) |
| Texas: | 6.7% (148,064) |
Aggregate household income in Southeast Hidalgo in 2022: $1,710,840,899
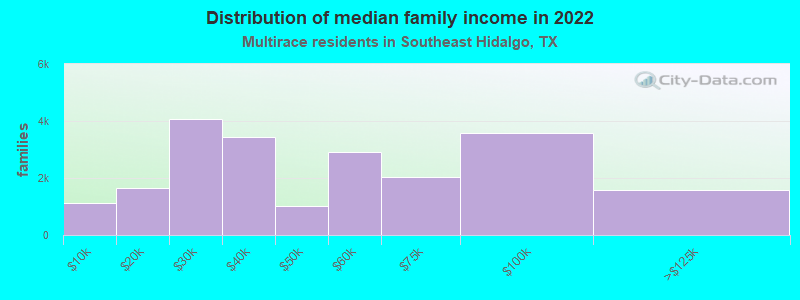
Median family income in Southeast Hidalgo in 2022:| Southeast Hidalgo: | $57,190 |
| State: | $69,780 |
Number of families with income < $10k:| Southeast Hidalgo: | 5.2% (1,107) |
| Texas: | 4.4% (70,825) |
Number of families with income $10k - 20k:| Southeast Hidalgo: | 7.7% (1,642) |
| State: | 5.9% (95,279) |
Number of families with income $20k - 30k:| Southeast Hidalgo: | 19.1% (4,083) |
| Texas: | 7.8% (126,627) |
Number of families with income $30k - 40k:| Southeast Hidalgo: | 16.1% (3,447) |
| Texas: | 8.5% (137,626) |
Number of families with income $40k - 50k:| Southeast Hidalgo: | 4.7% (1,009) |
| State: | 8.4% (135,809) |
Number of families with income $50k - 60k:| Southeast Hidalgo: | 13.6% (2,917) |
| Texas: | 7.9% (127,739) |
Number of families with income $60k - 75k:| Southeast Hidalgo: | 9.5% (2,030) |
| State: | 10.5% (169,549) |
Number of families with income $75k - 100k:| Southeast Hidalgo: | 16.8% (3,581) |
| Texas: | 14.0% (226,284) |
Number of families with income $100k - 125k:| Southeast Hidalgo: | 7.3% (1,563) |
| State: | 9.5% (153,597) |
Median non-family income in Southeast Hidalgo in 2022:| Southeast Hidalgo: | $18,039 |
| State: | $40,634 |
Change in median non-family income between 2000 and 2022:| Southeast Hidalgo, Texas: | +74.4% |
| State: | +77.2% |
Median per capita income in Southeast Hidalgo in 2022:| Southeast Hidalgo: | $15,101 |
| Texas: | $26,785 |
Change in median per capita income between 2000 and 2022:| Southeast Hidalgo, Texas: | +93.4% |
| State: | +110.9% |
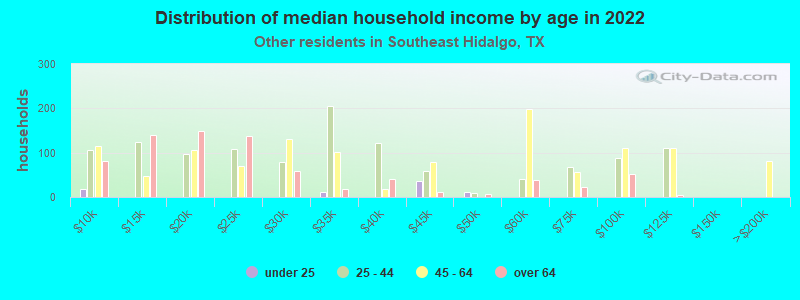
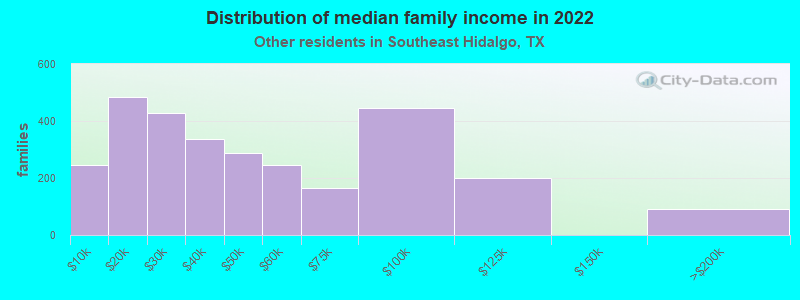
Income statistics for other residents
Number of households with income < $10k:| Southeast Hidalgo: | 8.1% (313) |
| State: | 5.9% (54,162) |
Number of households with income $10k - 20k:| Southeast Hidalgo: | 15.6% (598) |
| Texas: | 6.8% (62,891) |
Number of households with income $20k - 30k:| Southeast Hidalgo: | 13.2% (506) |
| State: | 10.6% (97,294) |
Number of households with income $30k - 40k:| Southeast Hidalgo: | 11.9% (456) |
| State: | 10.8% (99,670) |
Number of households with income $40k - 50k:| Southeast Hidalgo: | 6.6% (255) |
| State: | 9.3% (85,548) |
Number of households with income $50k - 60k:| Southeast Hidalgo: | 8.6% (330) |
| State: | 9.0% (82,757) |
Number of households with income $60k - 75k:| Southeast Hidalgo: | 8.8% (339) |
| State: | 10.9% (100,326) |
Number of households with income $75k - 100k:| Southeast Hidalgo: | 12.0% (462) |
| State: | 14.0% (128,767) |
Number of households with income $100k - 125k:| Southeast Hidalgo: | 7.2% (278) |
| State: | 8.2% (75,218) |
Number of households with income $125k - 150k:| Southeast Hidalgo: | 4.4% (168) |
| State: | 4.8% (44,223) |
Number of households with income $150k - 200k:| Southeast Hidalgo: | 2.4% (92) |
| Texas: | 5.6% (51,376) |
Number of households with income > $200k:| Southeast Hidalgo: | 1.2% (46) |
| Texas: | 4.0% (36,393) |
Aggregate household income in Southeast Hidalgo in 2022: $244,654,896
Median family income in Southeast Hidalgo in 2022:| Southeast Hidalgo: | $43,844 |
| Texas: | $60,064 |
Number of families with income < $10k:| Southeast Hidalgo: | 8.4% (247) |
| Texas: | 6.8% (47,502) |
Number of families with income $10k - 20k:| Southeast Hidalgo: | 16.5% (483) |
| Texas: | 6.0% (41,763) |
Number of families with income $20k - 30k:| Southeast Hidalgo: | 14.6% (428) |
| State: | 9.9% (68,761) |
Number of families with income $30k - 40k:| Southeast Hidalgo: | 11.5% (337) |
| State: | 9.7% (67,685) |
Number of families with income $40k - 50k:| Southeast Hidalgo: | 9.8% (286) |
| State: | 9.0% (62,441) |
Number of families with income $50k - 60k:| Southeast Hidalgo: | 8.4% (247) |
| State: | 8.5% (59,321) |
Number of families with income $60k - 75k:| Southeast Hidalgo: | 5.6% (164) |
| Texas: | 11.2% (77,588) |
Number of families with income $75k - 100k:| Southeast Hidalgo: | 15.3% (447) |
| State: | 14.5% (101,032) |
Number of families with income $100k - 125k:| Southeast Hidalgo: | 6.8% (199) |
| Texas: | 8.8% (61,439) |
Number of families with income $150k - 200k:| Southeast Hidalgo: | 3.1% (92) |
| Texas: | 5.9% (41,211) |
Median non-family income in Southeast Hidalgo in 2022:| Southeast Hidalgo: | $21,839 |
| Texas: | $38,690 |
Median per capita income in Southeast Hidalgo in 2022:| Southeast Hidalgo: | $14,938 |
| State: | $23,899 |
Change in median per capita income between 2000 and 2022:| Southeast Hidalgo, Texas: | +145.5% |
| State: | +135.2% |