South Antelope Valley, California (CA) income map, earnings map, and wages data
The median household income in South Antelope Valley, CA in 2022 was $99,598, which was 8.1% greater than the median annual income of $91,551 across the entire state of California. Compared to the median income of $50,923 in 2000 this represents an increase of 48.9%. The per capita income in 2022 was $39,374, which means an increase of 52.1% compared to 2000 when it was $18,864.
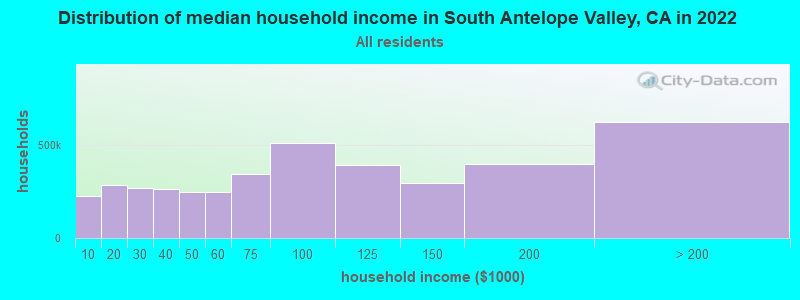
Income statistics for all residents
Median household income in South Antelope Valley, CA in 2022:| South Antelope Valley: | $99,599 |
| State: | $91,551 |
Change in median household income between 2000 and 2022:| South Antelope Valley, California: | +95.6% |
| California: | +92.8% |
Number of households with income < $10k:| South Antelope Valley: | 5.5% (226,962) |
| California: | 4.8% (654,370) |
Number of households with income $10k - 20k:| South Antelope Valley: | 6.9% (286,111) |
| State: | 5.8% (789,493) |
Number of households with income $20k - 30k:| South Antelope Valley: | 6.5% (268,438) |
| California: | 5.7% (778,318) |
Number of households with income $30k - 40k:| South Antelope Valley: | 6.4% (264,905) |
| State: | 5.8% (783,170) |
Number of households with income $40k - 50k:| South Antelope Valley: | 6.1% (250,462) |
| California: | 5.8% (781,352) |
Number of households with income $50k - 60k:| South Antelope Valley: | 6.1% (250,663) |
| California: | 5.6% (760,175) |
Number of households with income $60k - 75k:| South Antelope Valley: | 8.4% (345,285) |
| California: | 8.2% (1,104,699) |
Number of households with income $75k - 100k:| South Antelope Valley: | 12.4% (509,650) |
| State: | 12.0% (1,627,633) |
Number of households with income $100k - 125k:| South Antelope Valley: | 9.6% (395,945) |
| California: | 10.0% (1,358,619) |
Number of households with income $125k - 150k:| South Antelope Valley: | 7.2% (298,697) |
| California: | 7.6% (1,027,455) |
Number of households with income $150k - 200k:| South Antelope Valley: | 9.7% (400,132) |
| State: | 10.6% (1,439,811) |
Number of households with income > $200k:| South Antelope Valley: | 15.2% (625,601) |
| California: | 18.0% (2,445,491) |
Aggregate household income in South Antelope Valley in 2022: $410,815,007,900
Median family income in South Antelope Valley in 2022:| South Antelope Valley: | $108,521 |
| State: | $104,823 |
Median non-family income in South Antelope Valley in 2022:| South Antelope Valley: | $56,430 |
| State: | $59,348 |
Change in median non-family income between 2000 and 2022:| South Antelope Valley, California: | +81.8% |
| California: | +85.3% |
Median per capita income in South Antelope Valley in 2022:| South Antelope Valley: | $39,374 |
| California: | $46,661 |
Change in median per capita income between 2000 and 2022:| South Antelope Valley, California: | +108.7% |
| California: | +105.5% |
Income statistics for White residents
Median household income in South Antelope Valley, CA in 2022:| South Antelope Valley: | $115,879 |
| State: | $100,917 |
Change in median household income between 2000 and 2022:| South Antelope Valley, California: | +107.4% |
| State: | +96.8% |
Number of households with income < $10k:| South Antelope Valley: | 4.9% (69,974) |
| State: | 4.4% (284,109) |
Number of households with income $10k - 20k:| South Antelope Valley: | 5.7% (82,250) |
| California: | 5.3% (340,330) |
Number of households with income $20k - 30k:| South Antelope Valley: | 5.6% (80,725) |
| California: | 5.3% (343,145) |
Number of households with income $30k - 40k:| South Antelope Valley: | 5.2% (74,251) |
| State: | 5.1% (330,146) |
Number of households with income $40k - 50k:| South Antelope Valley: | 4.9% (70,240) |
| California: | 5.2% (335,310) |
Number of households with income $50k - 60k:| South Antelope Valley: | 5.1% (74,006) |
| California: | 5.1% (326,299) |
Number of households with income $60k - 75k:| South Antelope Valley: | 6.9% (99,715) |
| State: | 7.6% (487,640) |
Number of households with income $75k - 100k:| South Antelope Valley: | 11.3% (162,530) |
| State: | 11.5% (736,578) |
Number of households with income $100k - 125k:| South Antelope Valley: | 9.8% (140,463) |
| California: | 10.1% (648,782) |
Number of households with income $125k - 150k:| South Antelope Valley: | 7.4% (106,774) |
| State: | 7.8% (499,671) |
Number of households with income $150k - 200k:| South Antelope Valley: | 11.0% (158,418) |
| California: | 11.4% (729,603) |
Number of households with income > $200k:| South Antelope Valley: | 22.3% (320,630) |
| State: | 21.2% (1,364,246) |
Aggregate household income in South Antelope Valley in 2022: $188,475,940,600
Median family income in South Antelope Valley in 2022:| South Antelope Valley: | $138,975 |
| State: | $125,379 |
Number of families with income < $10k:| South Antelope Valley: | 2.3% (326) |
| California: | 2.2% (87,079) |
Number of families with income $10k - 20k:| South Antelope Valley: | 2.2% (311) |
| State: | 2.5% (97,716) |
Number of families with income $20k - 30k:| South Antelope Valley: | 3.9% (553) |
| California: | 3.5% (137,295) |
Number of families with income $30k - 40k:| South Antelope Valley: | 5.0% (709) |
| State: | 3.9% (152,947) |
Number of families with income $40k - 50k:| South Antelope Valley: | 5.1% (720) |
| California: | 4.3% (169,197) |
Number of families with income $50k - 60k:| South Antelope Valley: | 6.5% (921) |
| California: | 4.5% (176,192) |
Number of families with income $60k - 75k:| South Antelope Valley: | 10.0% (1,425) |
| State: | 7.0% (274,752) |
Number of families with income $75k - 100k:| South Antelope Valley: | 17.0% (2,425) |
| California: | 11.3% (445,632) |
Number of families with income $100k - 125k:| South Antelope Valley: | 13.2% (1,884) |
| State: | 10.7% (423,630) |
Number of families with income $125k - 150k:| South Antelope Valley: | 8.8% (1,251) |
| California: | 9.1% (357,408) |
Number of families with income $150k - 200k:| South Antelope Valley: | 11.8% (1,676) |
| State: | 13.5% (532,693) |
Number of families with income > $200k:| South Antelope Valley: | 14.3% (2,043) |
| State: | 27.6% (1,086,948) |
Median non-family income in South Antelope Valley in 2022:| South Antelope Valley: | $63,998 |
| State: | $62,819 |
Change in median non-family income between 2000 and 2022:| South Antelope Valley, California: | +96.2% |
| California: | +84.4% |
Median per capita income in South Antelope Valley in 2022:| South Antelope Valley: | $53,832 |
| State: | $61,706 |
Change in median per capita income between 2000 and 2022:| South Antelope Valley, California: | +142.5% |
| State: | +122.7% |
Income statistics for Black or African American residents
Median household income in South Antelope Valley, CA in 2022:| South Antelope Valley: | $67,688 |
| California: | $63,268 |
Change in median household income between 2000 and 2022:| South Antelope Valley, California: | +83.6% |
| State: | +81.0% |
Number of households with income < $10k:| South Antelope Valley: | 10.3% (37,045) |
| State: | 9.0% (73,219) |
Number of households with income $10k - 20k:| South Antelope Valley: | 11.6% (41,733) |
| State: | 10.6% (86,666) |
Number of households with income $20k - 30k:| South Antelope Valley: | 7.3% (26,157) |
| State: | 7.1% (57,719) |
Number of households with income $30k - 40k:| South Antelope Valley: | 7.8% (28,225) |
| State: | 7.2% (58,714) |
Number of households with income $40k - 50k:| South Antelope Valley: | 7.1% (25,603) |
| State: | 7.1% (58,075) |
Number of households with income $50k - 60k:| South Antelope Valley: | 6.4% (23,192) |
| State: | 6.8% (55,229) |
Number of households with income $60k - 75k:| South Antelope Valley: | 8.9% (31,920) |
| State: | 8.8% (71,895) |
Number of households with income $75k - 100k:| South Antelope Valley: | 11.2% (40,533) |
| California: | 11.9% (96,893) |
Number of households with income $100k - 125k:| South Antelope Valley: | 8.1% (29,330) |
| California: | 8.7% (70,729) |
Number of households with income $125k - 150k:| South Antelope Valley: | 6.4% (22,895) |
| California: | 6.3% (51,211) |
Number of households with income $150k - 200k:| South Antelope Valley: | 6.5% (23,573) |
| California: | 7.2% (58,687) |
Number of households with income > $200k:| South Antelope Valley: | 8.4% (30,189) |
| California: | 9.3% (75,487) |
Aggregate household income in South Antelope Valley in 2022: $3,191,374,832
Median family income in South Antelope Valley in 2022:| South Antelope Valley: | $75,323 |
| State: | $77,263 |
Number of families with income < $10k:| South Antelope Valley: | 8.2% (253) |
| State: | 5.9% (27,037) |
Number of families with income $10k - 20k:| South Antelope Valley: | 6.8% (209) |
| State: | 6.4% (29,505) |
Number of families with income $20k - 30k:| South Antelope Valley: | 5.9% (180) |
| State: | 5.6% (25,755) |
Number of families with income $30k - 40k:| South Antelope Valley: | 7.2% (221) |
| California: | 6.8% (30,948) |
Number of families with income $40k - 50k:| South Antelope Valley: | 7.6% (232) |
| State: | 8.3% (38,171) |
Number of families with income $50k - 60k:| South Antelope Valley: | 8.0% (245) |
| California: | 7.0% (31,860) |
Number of families with income $60k - 75k:| South Antelope Valley: | 14.4% (442) |
| California: | 8.7% (40,021) |
Number of families with income $75k - 100k:| South Antelope Valley: | 15.1% (463) |
| California: | 12.4% (56,846) |
Number of families with income $100k - 125k:| South Antelope Valley: | 9.5% (292) |
| State: | 9.8% (44,911) |
Number of families with income $125k - 150k:| South Antelope Valley: | 6.5% (198) |
| State: | 7.5% (34,434) |
Number of families with income $150k - 200k:| South Antelope Valley: | 7.6% (232) |
| State: | 9.3% (42,807) |
Number of families with income > $200k:| South Antelope Valley: | 3.3% (102) |
| State: | 12.2% (56,093) |
Median non-family income in South Antelope Valley in 2022:| South Antelope Valley: | $49,943 |
| State: | $41,942 |
Change in median non-family income between 2000 and 2022:| South Antelope Valley, California: | +73.5% |
| State: | +72.0% |
Median per capita income in South Antelope Valley in 2022:| South Antelope Valley: | $30,120 |
| California: | $36,708 |
Change in median per capita income between 2000 and 2022:| South Antelope Valley, California: | +117.9% |
| California: | +110.4% |
Income statistics for Asian residents
Median household income in South Antelope Valley, CA in 2022:| South Antelope Valley: | $138,625 |
| State: | $119,861 |
Change in median household income between 2000 and 2022:| South Antelope Valley, California: | +101.1% |
| California: | +116.5% |
Number of households with income < $10k:| South Antelope Valley: | 6.3% (49,093) |
| State: | 5.1% (106,273) |
Number of households with income $10k - 20k:| South Antelope Valley: | 6.6% (51,487) |
| State: | 4.9% (101,815) |
Number of households with income $20k - 30k:| South Antelope Valley: | 5.6% (43,555) |
| State: | 4.6% (94,414) |
Number of households with income $30k - 40k:| South Antelope Valley: | 5.2% (40,296) |
| State: | 4.1% (84,491) |
Number of households with income $40k - 50k:| South Antelope Valley: | 4.7% (36,388) |
| State: | 4.0% (81,758) |
Number of households with income $50k - 60k:| South Antelope Valley: | 4.7% (36,163) |
| State: | 3.9% (80,971) |
Number of households with income $60k - 75k:| South Antelope Valley: | 7.8% (60,533) |
| State: | 6.0% (124,194) |
Number of households with income $75k - 100k:| South Antelope Valley: | 10.8% (83,328) |
| State: | 9.7% (200,337) |
Number of households with income $100k - 125k:| South Antelope Valley: | 9.9% (76,856) |
| State: | 9.4% (193,488) |
Number of households with income $125k - 150k:| South Antelope Valley: | 7.6% (58,732) |
| State: | 7.7% (158,253) |
Number of households with income $150k - 200k:| South Antelope Valley: | 11.2% (86,821) |
| California: | 12.2% (252,139) |
Number of households with income > $200k:| South Antelope Valley: | 19.6% (151,689) |
| State: | 28.4% (586,641) |
Aggregate household income in South Antelope Valley in 2022: $4,569,669,294
Median family income in South Antelope Valley in 2022:| South Antelope Valley: | $147,105 |
| State: | $136,040 |
Number of families with income < $10k:| South Antelope Valley: | 0.9% (20) |
| State: | 2.8% (42,046) |
Number of families with income $10k - 20k:| South Antelope Valley: | 1.0% (22) |
| California: | 3.1% (46,821) |
Number of families with income $20k - 30k:| South Antelope Valley: | 4.1% (92) |
| State: | 4.1% (61,519) |
Number of families with income $30k - 40k:| South Antelope Valley: | 1.3% (29) |
| State: | 3.7% (55,234) |
Number of families with income $40k - 50k:| South Antelope Valley: | 2.2% (50) |
| California: | 3.9% (58,471) |
Number of families with income $50k - 60k:| South Antelope Valley: | 4.2% (94) |
| California: | 3.9% (58,911) |
Number of families with income $60k - 75k:| South Antelope Valley: | 7.8% (174) |
| California: | 5.9% (88,675) |
Number of families with income $75k - 100k:| South Antelope Valley: | 12.6% (282) |
| State: | 9.5% (143,103) |
Number of families with income $100k - 125k:| South Antelope Valley: | 7.8% (174) |
| California: | 9.4% (142,085) |
Number of families with income $125k - 150k:| South Antelope Valley: | 7.4% (167) |
| California: | 8.0% (120,635) |
Number of families with income $150k - 200k:| South Antelope Valley: | 8.6% (192) |
| State: | 13.2% (198,099) |
Number of families with income > $200k:| South Antelope Valley: | 42.1% (941) |
| State: | 32.5% (489,303) |
Median non-family income in South Antelope Valley in 2022:| South Antelope Valley: | $91,348 |
| California: | $74,216 |
Change in median non-family income between 2000 and 2022:| South Antelope Valley, California: | +131.1% |
| California: | +136.3% |
Median per capita income in South Antelope Valley in 2022:| South Antelope Valley: | $65,977 |
| State: | $58,824 |
Change in median per capita income between 2000 and 2022:| South Antelope Valley, California: | +148.4% |
| State: | +166.8% |
Income statistics for Hispanic or Latino residents
Median household income in South Antelope Valley, CA in 2022:| South Antelope Valley: | $84,219 |
| California: | $75,698 |
Change in median household income between 2000 and 2022:| South Antelope Valley, California: | +110.8% |
| State: | +107.2% |
Number of households with income < $10k:| South Antelope Valley: | 4.5% (71,063) |
| State: | 4.3% (183,294) |
Number of households with income $10k - 20k:| South Antelope Valley: | 7.1% (112,295) |
| California: | 6.0% (253,903) |
Number of households with income $20k - 30k:| South Antelope Valley: | 7.6% (120,187) |
| State: | 6.8% (286,386) |
Number of households with income $30k - 40k:| South Antelope Valley: | 7.9% (125,100) |
| State: | 7.4% (313,728) |
Number of households with income $40k - 50k:| South Antelope Valley: | 7.5% (118,526) |
| State: | 7.4% (313,199) |
Number of households with income $50k - 60k:| South Antelope Valley: | 7.6% (120,311) |
| California: | 7.2% (305,366) |
Number of households with income $60k - 75k:| South Antelope Valley: | 10.1% (159,988) |
| State: | 10.3% (434,937) |
Number of households with income $75k - 100k:| South Antelope Valley: | 14.6% (231,211) |
| State: | 14.4% (607,302) |
Number of households with income $100k - 125k:| South Antelope Valley: | 9.9% (156,195) |
| State: | 10.6% (447,424) |
Number of households with income $125k - 150k:| South Antelope Valley: | 7.2% (114,054) |
| State: | 7.5% (316,022) |
Number of households with income $150k - 200k:| South Antelope Valley: | 8.3% (130,556) |
| State: | 9.2% (386,269) |
Number of households with income > $200k:| South Antelope Valley: | 7.6% (120,704) |
| State: | 8.8% (372,651) |
Aggregate household income in South Antelope Valley in 2022: $34,286,349,769
Median family income in South Antelope Valley in 2022:| South Antelope Valley: | $85,107 |
| State: | $77,589 |
Number of families with income < $10k:| South Antelope Valley: | 3.9% (1,210) |
| California: | 3.9% (129,468) |
Number of families with income $10k - 20k:| South Antelope Valley: | 5.0% (1,537) |
| State: | 4.6% (151,997) |
Number of families with income $20k - 30k:| South Antelope Valley: | 7.9% (2,435) |
| State: | 6.6% (216,764) |
Number of families with income $30k - 40k:| South Antelope Valley: | 8.7% (2,669) |
| California: | 7.6% (249,849) |
Number of families with income $40k - 50k:| South Antelope Valley: | 8.8% (2,695) |
| California: | 7.7% (254,822) |
Number of families with income $50k - 60k:| South Antelope Valley: | 9.8% (3,008) |
| State: | 7.4% (244,815) |
Number of families with income $60k - 75k:| South Antelope Valley: | 13.5% (4,150) |
| State: | 10.5% (345,838) |
Number of families with income $75k - 100k:| South Antelope Valley: | 17.7% (5,430) |
| State: | 14.9% (491,589) |
Number of families with income $100k - 125k:| South Antelope Valley: | 10.8% (3,314) |
| State: | 10.7% (355,400) |
Number of families with income $125k - 150k:| South Antelope Valley: | 5.8% (1,770) |
| State: | 7.8% (259,317) |
Number of families with income $150k - 200k:| South Antelope Valley: | 5.5% (1,688) |
| State: | 9.3% (306,566) |
Number of families with income > $200k:| South Antelope Valley: | 2.6% (803) |
| State: | 9.1% (299,984) |
Median non-family income in South Antelope Valley in 2022:| South Antelope Valley: | $52,695 |
| State: | $49,746 |
Change in median non-family income between 2000 and 2022:| South Antelope Valley, California: | +107.5% |
| California: | +100.7% |
Median per capita income in South Antelope Valley in 2022:| South Antelope Valley: | $26,762 |
| California: | $27,240 |
Change in median per capita income between 2000 and 2022:| South Antelope Valley, California: | +138.1% |
| State: | +133.3% |
Income statistics for American Indian and Alaska Native residents
Median household income in South Antelope Valley, CA in 2022:| South Antelope Valley: | $69,720 |
| California: | $76,752 |
Change in median household income between 2000 and 2022:| South Antelope Valley, California: | +106.6% |
| California: | +110.0% |
Number of households with income < $10k:| South Antelope Valley: | 5.4% (2,164) |
| California: | 5.4% (8,471) |
Number of households with income $10k - 20k:| South Antelope Valley: | 6.4% (2,578) |
| California: | 6.0% (9,381) |
Number of households with income $20k - 30k:| South Antelope Valley: | 5.6% (2,272) |
| State: | 5.5% (8,668) |
Number of households with income $30k - 40k:| South Antelope Valley: | 8.3% (3,351) |
| California: | 8.3% (13,030) |
Number of households with income $40k - 50k:| South Antelope Valley: | 7.6% (3,059) |
| State: | 6.9% (10,908) |
Number of households with income $50k - 60k:| South Antelope Valley: | 6.4% (2,585) |
| California: | 7.1% (11,198) |
Number of households with income $60k - 75k:| South Antelope Valley: | 10.4% (4,196) |
| California: | 9.6% (15,190) |
Number of households with income $75k - 100k:| South Antelope Valley: | 14.9% (6,018) |
| State: | 14.1% (22,274) |
Number of households with income $100k - 125k:| South Antelope Valley: | 10.3% (4,138) |
| State: | 11.2% (17,643) |
Number of households with income $125k - 150k:| South Antelope Valley: | 8.5% (3,421) |
| State: | 8.3% (13,117) |
Number of households with income $150k - 200k:| South Antelope Valley: | 7.3% (2,938) |
| State: | 8.8% (13,853) |
Number of households with income > $200k:| South Antelope Valley: | 8.9% (3,604) |
| State: | 8.8% (13,925) |
Aggregate household income in South Antelope Valley in 2022: $98,278,777
Median family income in South Antelope Valley in 2022:| South Antelope Valley: | $97,756 |
| State: | $81,108 |
Number of families with income < $10k:| South Antelope Valley: | 1.9% (18) |
| State: | 5.0% (5,711) |
Number of families with income $10k - 20k:| South Antelope Valley: | 3.5% (33) |
| California: | 3.7% (4,148) |
Number of families with income $20k - 30k:| South Antelope Valley: | 1.4% (13) |
| California: | 4.3% (4,876) |
Number of families with income $30k - 40k:| South Antelope Valley: | 8.7% (82) |
| State: | 8.8% (9,994) |
Number of families with income $40k - 50k:| South Antelope Valley: | 1.5% (14) |
| California: | 7.8% (8,776) |
Number of families with income $60k - 75k:| South Antelope Valley: | 17.2% (161) |
| State: | 9.1% (10,247) |
Number of families with income $75k - 100k:| South Antelope Valley: | 15.7% (147) |
| California: | 14.8% (16,731) |
Number of families with income $100k - 125k:| South Antelope Valley: | 12.3% (115) |
| California: | 12.0% (13,609) |
Number of families with income $125k - 150k:| South Antelope Valley: | 10.3% (97) |
| California: | 8.0% (9,104) |
Number of families with income $150k - 200k:| South Antelope Valley: | 27.5% (257) |
| State: | 9.5% (10,721) |
Median non-family income in South Antelope Valley in 2022:| South Antelope Valley: | $56,141 |
| California: | $51,296 |
Change in median non-family income between 2000 and 2022:| South Antelope Valley, California: | +103.8% |
| State: | +114.0% |
Median per capita income in South Antelope Valley in 2022:| South Antelope Valley: | $38,031 |
| State: | $30,289 |
Change in median per capita income between 2000 and 2022:| South Antelope Valley, California: | +111.4% |
| California: | +98.9% |
Income statistics for Multirace residents
Median household income in South Antelope Valley, CA in 2022:| South Antelope Valley: | $100,473 |
| California: | $83,153 |
Change in median household income between 2000 and 2022:| South Antelope Valley, California: | +112.7% |
| State: | +106.0% |
Number of households with income < $10k:| South Antelope Valley: | 4.1% (30,410) |
| State: | 4.2% (85,299) |
Number of households with income $10k - 20k:| South Antelope Valley: | 6.9% (51,328) |
| California: | 6.1% (122,966) |
Number of households with income $20k - 30k:| South Antelope Valley: | 7.4% (55,474) |
| California: | 6.4% (129,328) |
Number of households with income $30k - 40k:| South Antelope Valley: | 7.0% (52,285) |
| State: | 6.4% (130,070) |
Number of households with income $40k - 50k:| South Antelope Valley: | 7.0% (52,635) |
| State: | 6.5% (131,254) |
Number of households with income $50k - 60k:| South Antelope Valley: | 7.0% (52,045) |
| State: | 6.5% (132,382) |
Number of households with income $60k - 75k:| South Antelope Valley: | 9.2% (68,583) |
| State: | 9.4% (191,472) |
Number of households with income $75k - 100k:| South Antelope Valley: | 13.8% (103,185) |
| State: | 13.3% (269,691) |
Number of households with income $100k - 125k:| South Antelope Valley: | 9.2% (68,592) |
| State: | 10.2% (207,286) |
Number of households with income $125k - 150k:| South Antelope Valley: | 7.4% (55,526) |
| California: | 7.8% (158,259) |
Number of households with income $150k - 200k:| South Antelope Valley: | 9.9% (74,291) |
| State: | 10.3% (209,227) |
Number of households with income > $200k:| South Antelope Valley: | 11.0% (82,406) |
| California: | 13.0% (263,210) |
Aggregate household income in South Antelope Valley in 2022: $3,408,854,660
Median family income in South Antelope Valley in 2022:| South Antelope Valley: | $106,070 |
| California: | $87,642 |
Number of families with income < $10k:| South Antelope Valley: | 3.2% (244) |
| State: | 3.2% (48,017) |
Number of families with income $10k - 20k:| South Antelope Valley: | 4.0% (312) |
| State: | 4.1% (60,419) |
Number of families with income $20k - 30k:| South Antelope Valley: | 3.9% (302) |
| State: | 6.1% (89,742) |
Number of families with income $30k - 40k:| South Antelope Valley: | 4.0% (309) |
| State: | 6.2% (91,415) |
Number of families with income $40k - 50k:| South Antelope Valley: | 7.1% (548) |
| California: | 6.8% (100,085) |
Number of families with income $50k - 60k:| South Antelope Valley: | 10.0% (771) |
| State: | 6.7% (98,298) |
Number of families with income $60k - 75k:| South Antelope Valley: | 9.8% (755) |
| State: | 9.5% (140,131) |
Number of families with income $75k - 100k:| South Antelope Valley: | 18.2% (1,407) |
| State: | 13.8% (203,439) |
Number of families with income $100k - 125k:| South Antelope Valley: | 15.7% (1,216) |
| California: | 10.4% (153,515) |
Number of families with income $125k - 150k:| South Antelope Valley: | 7.4% (573) |
| State: | 8.4% (124,115) |
Number of families with income $150k - 200k:| South Antelope Valley: | 5.9% (458) |
| State: | 10.9% (161,643) |
Number of families with income > $200k:| South Antelope Valley: | 10.8% (835) |
| State: | 14.0% (207,317) |
Median non-family income in South Antelope Valley in 2022:| South Antelope Valley: | $38,954 |
| California: | $56,558 |
Change in median non-family income between 2000 and 2022:| South Antelope Valley, California: | +100.0% |
| State: | +100.2% |
Median per capita income in South Antelope Valley in 2022:| South Antelope Valley: | $26,751 |
| State: | $32,124 |
Change in median per capita income between 2000 and 2022:| South Antelope Valley, California: | +108.4% |
| State: | +120.4% |
Income statistics for other residents
Number of households with income < $10k:| South Antelope Valley: | 5.1% (4,870) |
| California: | 4.6% (93,035) |
Number of households with income $10k - 20k:| South Antelope Valley: | 7.4% (7,150) |
| State: | 6.3% (126,222) |
Number of households with income $20k - 30k:| South Antelope Valley: | 7.8% (7,515) |
| State: | 7.1% (142,656) |
Number of households with income $30k - 40k:| South Antelope Valley: | 8.5% (8,206) |
| State: | 8.2% (165,018) |
Number of households with income $40k - 50k:| South Antelope Valley: | 7.9% (7,657) |
| California: | 8.0% (161,732) |
Number of households with income $50k - 60k:| South Antelope Valley: | 8.0% (7,719) |
| State: | 7.6% (152,152) |
Number of households with income $60k - 75k:| South Antelope Valley: | 10.4% (10,076) |
| State: | 10.4% (209,951) |
Number of households with income $75k - 100k:| South Antelope Valley: | 14.7% (14,158) |
| California: | 14.7% (296,102) |
Number of households with income $100k - 125k:| South Antelope Valley: | 10.0% (9,636) |
| State: | 10.7% (214,281) |
Number of households with income $125k - 150k:| South Antelope Valley: | 6.9% (6,619) |
| State: | 7.1% (143,092) |
Number of households with income $150k - 200k:| South Antelope Valley: | 7.5% (7,215) |
| State: | 8.6% (172,215) |
Number of households with income > $200k:| South Antelope Valley: | 5.8% (5,601) |
| State: | 6.7% (134,102) |
Aggregate household income in South Antelope Valley in 2022: $8,096,857,769
Median family income in South Antelope Valley in 2022:| South Antelope Valley: | $80,940 |
| State: | $72,756 |
Number of families with income < $10k:| South Antelope Valley: | 3.5% (280) |
| California: | 4.3% (69,090) |
Number of families with income $10k - 20k:| South Antelope Valley: | 3.6% (289) |
| State: | 5.1% (82,116) |
Number of families with income $20k - 30k:| South Antelope Valley: | 6.4% (512) |
| California: | 7.0% (112,854) |
Number of families with income $30k - 40k:| South Antelope Valley: | 8.8% (707) |
| State: | 8.4% (135,938) |
Number of families with income $40k - 50k:| South Antelope Valley: | 8.7% (703) |
| State: | 8.4% (135,353) |
Number of families with income $50k - 60k:| South Antelope Valley: | 7.4% (595) |
| California: | 7.7% (124,826) |
Number of families with income $60k - 75k:| South Antelope Valley: | 13.2% (1,061) |
| State: | 10.7% (173,628) |
Number of families with income $75k - 100k:| South Antelope Valley: | 19.0% (1,527) |
| State: | 15.2% (245,724) |
Number of families with income $100k - 125k:| South Antelope Valley: | 13.8% (1,113) |
| State: | 10.9% (176,716) |
Number of families with income $125k - 150k:| South Antelope Valley: | 7.4% (593) |
| State: | 7.4% (119,985) |
Number of families with income $150k - 200k:| South Antelope Valley: | 6.3% (511) |
| California: | 8.5% (137,332) |
Number of families with income > $200k:| South Antelope Valley: | 2.0% (162) |
| State: | 6.6% (106,346) |
Median non-family income in South Antelope Valley in 2022:| South Antelope Valley: | $44,596 |
| State: | $43,881 |
Change in median non-family income between 2000 and 2022:| South Antelope Valley, California: | +84.3% |
| State: | +84.6% |
Median per capita income in South Antelope Valley in 2022:| South Antelope Valley: | $26,285 |
| California: | $25,164 |
Change in median per capita income between 2000 and 2022:| South Antelope Valley, California: | +144.3% |
| California: | +137.9% |