Sloughhouse, California (CA) income map, earnings map, and wages data
The median household income in Sloughhouse, CA in 2022 was $148,441, which was 38.3% greater than the median annual income of $91,551 across the entire state of California. Compared to the median income of $77,236 in 2000 this represents an increase of 48.0%. The per capita income in 2022 was $73,505, which means an increase of 48.2% compared to 2000 when it was $38,111.
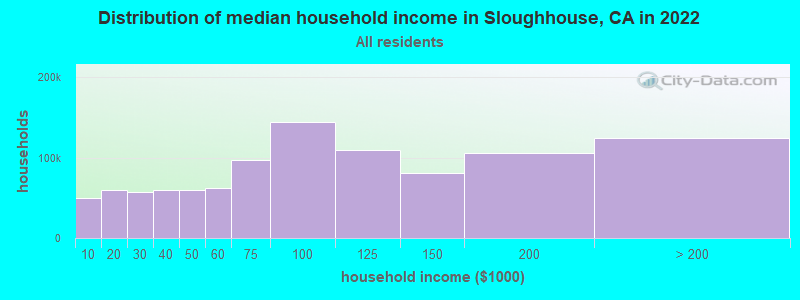
Income statistics for all residents
Median household income in Sloughhouse, CA in 2022:| Sloughhouse: | $148,442 |
| State: | $91,551 |
Change in median household income between 2000 and 2022:| Sloughhouse, California: | +92.2% |
| State: | +92.8% |
Number of households with income < $10k:| Sloughhouse: | 4.9% (49,628) |
| California: | 4.8% (654,370) |
Number of households with income $10k - 20k:| Sloughhouse: | 5.9% (60,017) |
| State: | 5.8% (789,493) |
Number of households with income $20k - 30k:| Sloughhouse: | 5.7% (57,463) |
| State: | 5.7% (778,318) |
Number of households with income $30k - 40k:| Sloughhouse: | 5.9% (59,150) |
| State: | 5.8% (783,170) |
Number of households with income $40k - 50k:| Sloughhouse: | 5.9% (59,182) |
| California: | 5.8% (781,352) |
Number of households with income $50k - 60k:| Sloughhouse: | 6.2% (62,299) |
| State: | 5.6% (760,175) |
Number of households with income $60k - 75k:| Sloughhouse: | 9.6% (96,672) |
| California: | 8.2% (1,104,699) |
Number of households with income $75k - 100k:| Sloughhouse: | 14.3% (144,243) |
| State: | 12.0% (1,627,633) |
Number of households with income $100k - 125k:| Sloughhouse: | 10.9% (109,753) |
| State: | 10.0% (1,358,619) |
Number of households with income $125k - 150k:| Sloughhouse: | 8.0% (80,315) |
| California: | 7.6% (1,027,455) |
Number of households with income $150k - 200k:| Sloughhouse: | 10.5% (105,926) |
| California: | 10.6% (1,439,811) |
Number of households with income > $200k:| Sloughhouse: | 12.4% (124,946) |
| State: | 18.0% (2,445,491) |
Aggregate household income in Sloughhouse in 2022: $6,119,964,050
Median family income in Sloughhouse in 2022:| Sloughhouse: | $166,664 |
| California: | $104,823 |
Median non-family income in Sloughhouse in 2022:| Sloughhouse: | $80,302 |
| California: | $59,348 |
Change in median non-family income between 2000 and 2022:| Sloughhouse, California: | +86.3% |
| State: | +85.3% |
Median per capita income in Sloughhouse in 2022:| Sloughhouse: | $73,505 |
| State: | $46,661 |
Change in median per capita income between 2000 and 2022:| Sloughhouse, California: | +92.9% |
| California: | +105.5% |
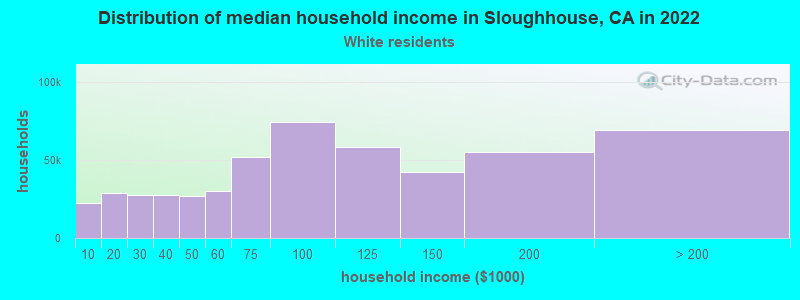
Income statistics for White residents
Median household income in Sloughhouse, CA in 2022:| Sloughhouse: | $148,818 |
| California: | $100,917 |
Change in median household income between 2000 and 2022:| Sloughhouse, California: | +88.3% |
| California: | +96.8% |
Number of households with income < $10k:| Sloughhouse: | 4.4% (22,491) |
| State: | 4.4% (284,109) |
Number of households with income $10k - 20k:| Sloughhouse: | 5.6% (29,004) |
| State: | 5.3% (340,330) |
Number of households with income $20k - 30k:| Sloughhouse: | 5.3% (27,391) |
| State: | 5.3% (343,145) |
Number of households with income $30k - 40k:| Sloughhouse: | 5.3% (27,405) |
| State: | 5.1% (330,146) |
Number of households with income $40k - 50k:| Sloughhouse: | 5.3% (27,024) |
| State: | 5.2% (335,310) |
Number of households with income $50k - 60k:| Sloughhouse: | 5.9% (30,288) |
| California: | 5.1% (326,299) |
Number of households with income $60k - 75k:| Sloughhouse: | 10.1% (51,949) |
| State: | 7.6% (487,640) |
Number of households with income $75k - 100k:| Sloughhouse: | 14.4% (74,124) |
| California: | 11.5% (736,578) |
Number of households with income $100k - 125k:| Sloughhouse: | 11.3% (58,109) |
| State: | 10.1% (648,782) |
Number of households with income $125k - 150k:| Sloughhouse: | 8.2% (42,341) |
| California: | 7.8% (499,671) |
Number of households with income $150k - 200k:| Sloughhouse: | 10.7% (54,793) |
| California: | 11.4% (729,603) |
Number of households with income > $200k:| Sloughhouse: | 13.4% (69,075) |
| State: | 21.2% (1,364,246) |
Aggregate household income in Sloughhouse in 2022: $3,055,487,171
Median family income in Sloughhouse in 2022:| Sloughhouse: | $172,148 |
| California: | $125,379 |
Number of families with income < $10k:| Sloughhouse: | 0.5% (12) |
| State: | 2.2% (87,079) |
Number of families with income $10k - 20k:| Sloughhouse: | 0.3% (9) |
| State: | 2.5% (97,716) |
Number of families with income $20k - 30k:| Sloughhouse: | 0.9% (22) |
| State: | 3.5% (137,295) |
Number of families with income $30k - 40k:| Sloughhouse: | 1.7% (43) |
| State: | 3.9% (152,947) |
Number of families with income $40k - 50k:| Sloughhouse: | 1.5% (39) |
| State: | 4.3% (169,197) |
Number of families with income $50k - 60k:| Sloughhouse: | 2.1% (53) |
| California: | 4.5% (176,192) |
Number of families with income $60k - 75k:| Sloughhouse: | 3.0% (76) |
| California: | 7.0% (274,752) |
Number of families with income $75k - 100k:| Sloughhouse: | 11.7% (299) |
| State: | 11.3% (445,632) |
Number of families with income $100k - 125k:| Sloughhouse: | 9.8% (250) |
| California: | 10.7% (423,630) |
Number of families with income $125k - 150k:| Sloughhouse: | 14.1% (360) |
| State: | 9.1% (357,408) |
Number of families with income $150k - 200k:| Sloughhouse: | 23.6% (604) |
| State: | 13.5% (532,693) |
Number of families with income > $200k:| Sloughhouse: | 30.9% (790) |
| State: | 27.6% (1,086,948) |
Median non-family income in Sloughhouse in 2022:| Sloughhouse: | $72,136 |
| State: | $62,819 |
Change in median non-family income between 2000 and 2022:| Sloughhouse, California: | +90.8% |
| California: | +84.4% |
Median per capita income in Sloughhouse in 2022:| Sloughhouse: | $79,507 |
| State: | $61,706 |
Change in median per capita income between 2000 and 2022:| Sloughhouse, California: | +100.9% |
| California: | +122.7% |
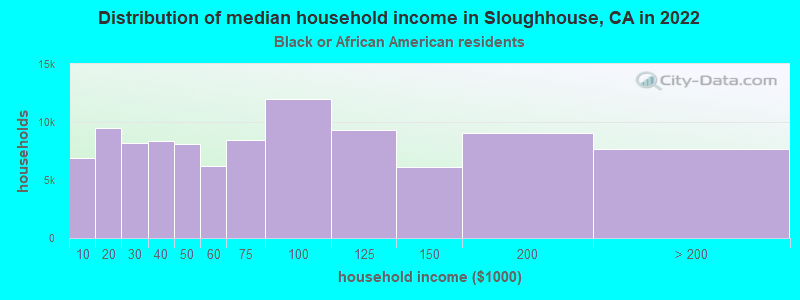
Income statistics for Black or African American residents
Median household income in Sloughhouse, CA in 2022:| Sloughhouse: | $118,419 |
| State: | $63,268 |
Change in median household income between 2000 and 2022:| Sloughhouse, California: | +92.7% |
| State: | +81.0% |
Number of households with income < $10k:| Sloughhouse: | 6.9% (6,858) |
| State: | 9.0% (73,219) |
Number of households with income $10k - 20k:| Sloughhouse: | 9.5% (9,486) |
| State: | 10.6% (86,666) |
Number of households with income $20k - 30k:| Sloughhouse: | 8.2% (8,212) |
| California: | 7.1% (57,719) |
Number of households with income $30k - 40k:| Sloughhouse: | 8.4% (8,399) |
| State: | 7.2% (58,714) |
Number of households with income $40k - 50k:| Sloughhouse: | 8.1% (8,111) |
| State: | 7.1% (58,075) |
Number of households with income $50k - 60k:| Sloughhouse: | 6.2% (6,167) |
| California: | 6.8% (55,229) |
Number of households with income $60k - 75k:| Sloughhouse: | 8.5% (8,456) |
| State: | 8.8% (71,895) |
Number of households with income $75k - 100k:| Sloughhouse: | 12.0% (12,011) |
| State: | 11.9% (96,893) |
Number of households with income $100k - 125k:| Sloughhouse: | 9.4% (9,352) |
| California: | 8.7% (70,729) |
Number of households with income $125k - 150k:| Sloughhouse: | 6.1% (6,141) |
| California: | 6.3% (51,211) |
Number of households with income $150k - 200k:| Sloughhouse: | 9.1% (9,067) |
| California: | 7.2% (58,687) |
Number of households with income > $200k:| Sloughhouse: | 7.7% (7,646) |
| California: | 9.3% (75,487) |
Aggregate household income in Sloughhouse in 2022: $14,124,370
Median family income in Sloughhouse in 2022:| Sloughhouse: | $129,651 |
| California: | $77,263 |
Number of families with income < $10k:| Sloughhouse: | 2.5% (4) |
| State: | 5.9% (27,037) |
Number of families with income $40k - 50k:| Sloughhouse: | 4.0% (7) |
| State: | 8.3% (38,171) |
Number of families with income $60k - 75k:| Sloughhouse: | 14.8% (27) |
| California: | 8.7% (40,021) |
Number of families with income > $200k:| Sloughhouse: | 78.7% (141) |
| California: | 12.2% (56,093) |
Median non-family income in Sloughhouse in 2022:| Sloughhouse: | $97,098 |
| California: | $41,942 |
Change in median non-family income between 2000 and 2022:| Sloughhouse, California: | +89.5% |
| State: | +72.0% |
Median per capita income in Sloughhouse in 2022:| Sloughhouse: | $82,755 |
| State: | $36,708 |
Change in median per capita income between 2000 and 2022:| Sloughhouse, California: | +125.4% |
| California: | +110.4% |
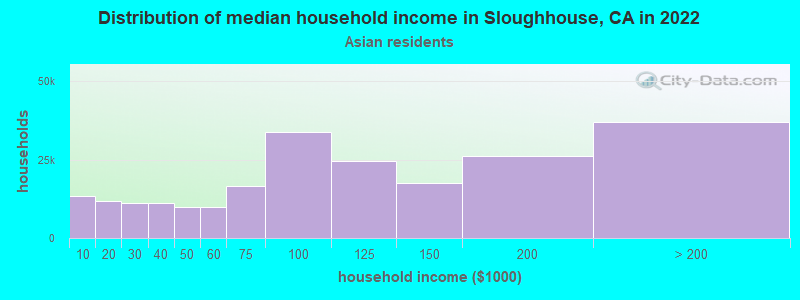
Income statistics for Asian residents
Median household income in Sloughhouse, CA in 2022:| Sloughhouse: | $244,965 |
| California: | $119,861 |
Change in median household income between 2000 and 2022:| Sloughhouse, California: | +114.7% |
| State: | +116.5% |
Number of households with income < $10k:| Sloughhouse: | 5.9% (13,228) |
| State: | 5.1% (106,273) |
Number of households with income $10k - 20k:| Sloughhouse: | 5.3% (11,805) |
| State: | 4.9% (101,815) |
Number of households with income $20k - 30k:| Sloughhouse: | 5.0% (11,159) |
| State: | 4.6% (94,414) |
Number of households with income $30k - 40k:| Sloughhouse: | 5.0% (11,140) |
| State: | 4.1% (84,491) |
Number of households with income $40k - 50k:| Sloughhouse: | 4.4% (9,772) |
| California: | 4.0% (81,758) |
Number of households with income $50k - 60k:| Sloughhouse: | 4.5% (9,987) |
| State: | 3.9% (80,971) |
Number of households with income $60k - 75k:| Sloughhouse: | 7.4% (16,518) |
| California: | 6.0% (124,194) |
Number of households with income $75k - 100k:| Sloughhouse: | 15.2% (33,804) |
| State: | 9.7% (200,337) |
Number of households with income $100k - 125k:| Sloughhouse: | 11.1% (24,628) |
| State: | 9.4% (193,488) |
Number of households with income $125k - 150k:| Sloughhouse: | 7.9% (17,471) |
| California: | 7.7% (158,253) |
Number of households with income $150k - 200k:| Sloughhouse: | 11.7% (25,987) |
| State: | 12.2% (252,139) |
Number of households with income > $200k:| Sloughhouse: | 16.6% (36,958) |
| State: | 28.4% (586,641) |
Aggregate household income in Sloughhouse in 2022: $32,036,237
Median family income in Sloughhouse in 2022:| Sloughhouse: | $204,676 |
| State: | $136,040 |
Number of families with income $20k - 30k:| Sloughhouse: | 17.6% (6) |
| State: | 4.1% (61,519) |
Number of families with income $100k - 125k:| Sloughhouse: | 82.4% (28) |
| State: | 9.4% (142,085) |
Median non-family income in Sloughhouse in 2022:| Sloughhouse: | $391,626 |
| State: | $74,216 |
Change in median non-family income between 2000 and 2022:| Sloughhouse, California: | +95.8% |
| State: | +136.3% |
Median per capita income in Sloughhouse in 2022:| Sloughhouse: | $178,157 |
| California: | $58,824 |
Change in median per capita income between 2000 and 2022:| Sloughhouse, California: | +126.3% |
| State: | +166.8% |
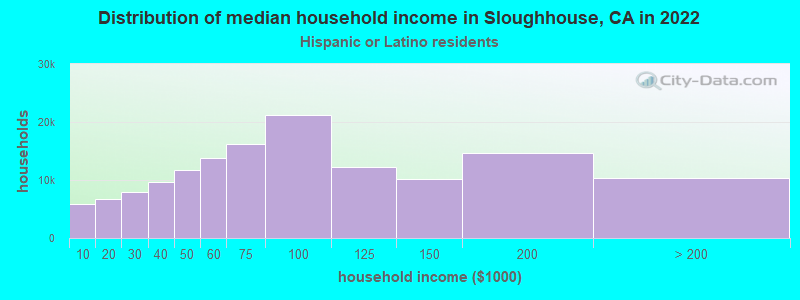
Income statistics for Hispanic or Latino residents
Median household income in Sloughhouse, CA in 2022:| Sloughhouse: | $96,259 |
| California: | $75,698 |
Change in median household income between 2000 and 2022:| Sloughhouse, California: | +97.5% |
| California: | +107.2% |
Number of households with income < $10k:| Sloughhouse: | 4.2% (5,919) |
| State: | 4.3% (183,294) |
Number of households with income $10k - 20k:| Sloughhouse: | 4.7% (6,638) |
| State: | 6.0% (253,903) |
Number of households with income $20k - 30k:| Sloughhouse: | 5.7% (7,951) |
| State: | 6.8% (286,386) |
Number of households with income $30k - 40k:| Sloughhouse: | 6.9% (9,723) |
| State: | 7.4% (313,728) |
Number of households with income $40k - 50k:| Sloughhouse: | 8.3% (11,707) |
| State: | 7.4% (313,199) |
Number of households with income $50k - 60k:| Sloughhouse: | 9.8% (13,735) |
| California: | 7.2% (305,366) |
Number of households with income $60k - 75k:| Sloughhouse: | 11.6% (16,246) |
| State: | 10.3% (434,937) |
Number of households with income $75k - 100k:| Sloughhouse: | 15.1% (21,172) |
| State: | 14.4% (607,302) |
Number of households with income $100k - 125k:| Sloughhouse: | 8.7% (12,168) |
| State: | 10.6% (447,424) |
Number of households with income $125k - 150k:| Sloughhouse: | 7.3% (10,197) |
| State: | 7.5% (316,022) |
Number of households with income $150k - 200k:| Sloughhouse: | 10.5% (14,714) |
| State: | 9.2% (386,269) |
Number of households with income > $200k:| Sloughhouse: | 7.4% (10,398) |
| State: | 8.8% (372,651) |
Aggregate household income in Sloughhouse in 2022: $21,894,555
Median family income in Sloughhouse in 2022:| Sloughhouse: | $139,498 |
| California: | $77,589 |
Number of families with income < $10k:| Sloughhouse: | 1.3% (11) |
| State: | 3.9% (129,468) |
Number of families with income $10k - 20k:| Sloughhouse: | 0.8% (7) |
| State: | 4.6% (151,997) |
Number of families with income $20k - 30k:| Sloughhouse: | 1.3% (12) |
| State: | 6.6% (216,764) |
Number of families with income $30k - 40k:| Sloughhouse: | 4.0% (36) |
| State: | 7.6% (249,849) |
Number of families with income $40k - 50k:| Sloughhouse: | 3.8% (34) |
| State: | 7.7% (254,822) |
Number of families with income $50k - 60k:| Sloughhouse: | 5.2% (47) |
| State: | 7.4% (244,815) |
Number of families with income $60k - 75k:| Sloughhouse: | 4.3% (39) |
| State: | 10.5% (345,838) |
Number of families with income $75k - 100k:| Sloughhouse: | 13.9% (126) |
| State: | 14.9% (491,589) |
Number of families with income $100k - 125k:| Sloughhouse: | 9.2% (84) |
| State: | 10.7% (355,400) |
Number of families with income $125k - 150k:| Sloughhouse: | 14.5% (131) |
| California: | 7.8% (259,317) |
Number of families with income $150k - 200k:| Sloughhouse: | 24.8% (225) |
| State: | 9.3% (306,566) |
Number of families with income > $200k:| Sloughhouse: | 17.1% (155) |
| State: | 9.1% (299,984) |
Median non-family income in Sloughhouse in 2022:| Sloughhouse: | $51,801 |
| State: | $49,746 |
Change in median non-family income between 2000 and 2022:| Sloughhouse, California: | +111.2% |
| State: | +100.7% |
Median per capita income in Sloughhouse in 2022:| Sloughhouse: | $30,287 |
| California: | $27,240 |
Change in median per capita income between 2000 and 2022:| Sloughhouse, California: | +114.7% |
| State: | +133.3% |
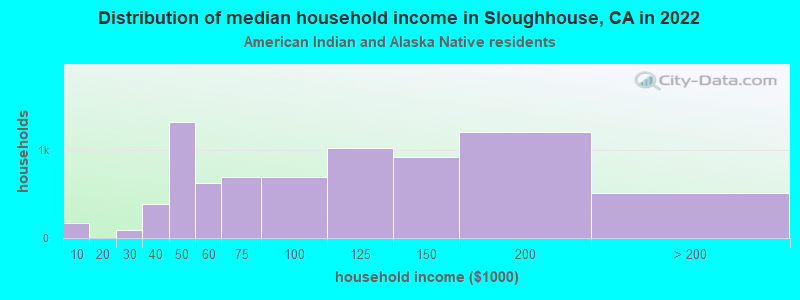
Income statistics for American Indian and Alaska Native residents
Median household income in Sloughhouse, CA in 2022:| Sloughhouse: | $135,336 |
| California: | $76,752 |
Change in median household income between 2000 and 2022:| Sloughhouse, California: | +140.6% |
| State: | +110.0% |
Number of households with income < $10k:| Sloughhouse: | 2.2% (169) |
| California: | 5.4% (8,471) |
Number of households with income $10k - 20k:| Sloughhouse: | 0.0% (0) |
| State: | 6.0% (9,381) |
Number of households with income $20k - 30k:| Sloughhouse: | 1.2% (91) |
| State: | 5.5% (8,668) |
Number of households with income $30k - 40k:| Sloughhouse: | 5.0% (384) |
| State: | 8.3% (13,030) |
Number of households with income $40k - 50k:| Sloughhouse: | 17.3% (1,321) |
| State: | 6.9% (10,908) |
Number of households with income $50k - 60k:| Sloughhouse: | 8.2% (627) |
| State: | 7.1% (11,198) |
Number of households with income $60k - 75k:| Sloughhouse: | 9.1% (698) |
| State: | 9.6% (15,190) |
Number of households with income $75k - 100k:| Sloughhouse: | 9.1% (692) |
| California: | 14.1% (22,274) |
Number of households with income $100k - 125k:| Sloughhouse: | 13.4% (1,024) |
| State: | 11.2% (17,643) |
Number of households with income $125k - 150k:| Sloughhouse: | 12.0% (921) |
| California: | 8.3% (13,117) |
Number of households with income $150k - 200k:| Sloughhouse: | 15.8% (1,206) |
| California: | 8.8% (13,853) |
Number of households with income > $200k:| Sloughhouse: | 6.7% (511) |
| State: | 8.8% (13,925) |
Aggregate household income in Sloughhouse in 2022: $1,257,052
Median family income in Sloughhouse in 2022:| Sloughhouse: | $121,427 |
| California: | $81,108 |
Median per capita income in Sloughhouse in 2022:| Sloughhouse: | $23,546 |
| State: | $30,289 |
Change in median per capita income between 2000 and 2022:| Sloughhouse, California: | +92.5% |
| State: | +98.9% |
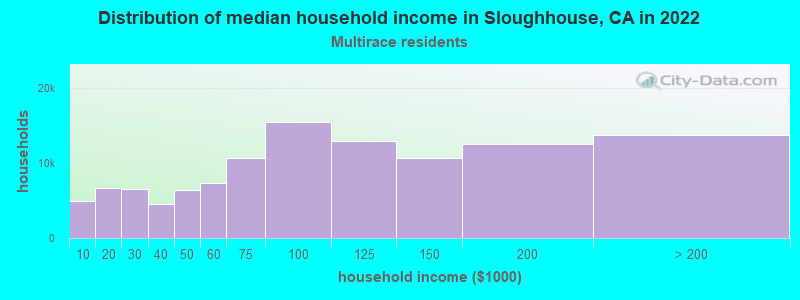
Income statistics for Multirace residents
Median household income in Sloughhouse, CA in 2022:| Sloughhouse: | $161,235 |
| State: | $83,153 |
Change in median household income between 2000 and 2022:| Sloughhouse, California: | +129.2% |
| California: | +106.0% |
Number of households with income < $10k:| Sloughhouse: | 4.4% (4,918) |
| California: | 4.2% (85,299) |
Number of households with income $10k - 20k:| Sloughhouse: | 5.9% (6,673) |
| State: | 6.1% (122,966) |
Number of households with income $20k - 30k:| Sloughhouse: | 5.8% (6,489) |
| California: | 6.4% (129,328) |
Number of households with income $30k - 40k:| Sloughhouse: | 4.1% (4,567) |
| State: | 6.4% (130,070) |
Number of households with income $40k - 50k:| Sloughhouse: | 5.7% (6,393) |
| State: | 6.5% (131,254) |
Number of households with income $50k - 60k:| Sloughhouse: | 6.5% (7,295) |
| State: | 6.5% (132,382) |
Number of households with income $60k - 75k:| Sloughhouse: | 9.5% (10,663) |
| State: | 9.4% (191,472) |
Number of households with income $75k - 100k:| Sloughhouse: | 13.8% (15,472) |
| State: | 13.3% (269,691) |
Number of households with income $100k - 125k:| Sloughhouse: | 11.6% (12,989) |
| California: | 10.2% (207,286) |
Number of households with income $125k - 150k:| Sloughhouse: | 9.5% (10,682) |
| California: | 7.8% (158,259) |
Number of households with income $150k - 200k:| Sloughhouse: | 11.1% (12,536) |
| California: | 10.3% (209,227) |
Number of households with income > $200k:| Sloughhouse: | 12.2% (13,758) |
| California: | 13.0% (263,210) |
Aggregate household income in Sloughhouse in 2022: $31,088,115
Median family income in Sloughhouse in 2022:| Sloughhouse: | $147,383 |
| California: | $87,642 |
Number of families with income $10k - 20k:| Sloughhouse: | 6.2% (9) |
| State: | 4.1% (60,419) |
Number of families with income $20k - 30k:| Sloughhouse: | 7.6% (11) |
| California: | 6.1% (89,742) |
Number of families with income $50k - 60k:| Sloughhouse: | 25.7% (35) |
| State: | 6.7% (98,298) |
Number of families with income $75k - 100k:| Sloughhouse: | 60.4% (83) |
| California: | 13.8% (203,439) |
Median non-family income in Sloughhouse in 2022:| Sloughhouse: | $142,735 |
| State: | $56,558 |
Change in median non-family income between 2000 and 2022:| Sloughhouse, California: | +100.3% |
| State: | +100.2% |
Median per capita income in Sloughhouse in 2022:| Sloughhouse: | $47,417 |
| California: | $32,124 |
Income statistics for other residents
Number of households with income < $10k:| Sloughhouse: | 5.6% (4) |
| State: | 4.6% (93,035) |
Number of households with income $10k - 20k:| Sloughhouse: | 5.6% (4) |
| California: | 6.3% (126,222) |
Number of households with income $20k - 30k:| Sloughhouse: | 6.9% (5) |
| State: | 7.1% (142,656) |
Number of households with income $30k - 40k:| Sloughhouse: | 9.7% (7) |
| California: | 8.2% (165,018) |
Number of households with income $40k - 50k:| Sloughhouse: | 9.7% (7) |
| State: | 8.0% (161,732) |
Number of households with income $50k - 60k:| Sloughhouse: | 9.7% (7) |
| California: | 7.6% (152,152) |
Number of households with income $60k - 75k:| Sloughhouse: | 11.1% (8) |
| State: | 10.4% (209,951) |
Number of households with income $75k - 100k:| Sloughhouse: | 15.3% (11) |
| State: | 14.7% (296,102) |
Number of households with income $100k - 125k:| Sloughhouse: | 6.9% (5) |
| State: | 10.7% (214,281) |
Number of households with income $125k - 150k:| Sloughhouse: | 5.6% (4) |
| State: | 7.1% (143,092) |
Number of households with income $150k - 200k:| Sloughhouse: | 8.3% (6) |
| State: | 8.6% (172,215) |
Number of households with income > $200k:| Sloughhouse: | 5.6% (4) |
| State: | 6.7% (134,102) |
Aggregate household income in Sloughhouse in 2022: $5,941,172
Median family income in Sloughhouse in 2022:| Sloughhouse: | $147,535 |
| State: | $72,756 |
Number of families with income < $10k:| Sloughhouse: | 16.2% (12) |
| California: | 4.3% (69,090) |
Number of families with income $75k - 100k:| Sloughhouse: | 83.8% (60) |
| State: | 15.2% (245,724) |
Median per capita income in Sloughhouse in 2022:| Sloughhouse: | $19,925 |
| California: | $25,164 |
Change in median per capita income between 2000 and 2022:| Sloughhouse, California: | +108.3% |
| State: | +137.9% |