Shepherd-Evergreen, Texas (TX) income map, earnings map, and wages data
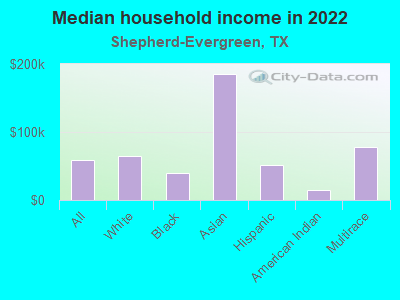
The median household income in Shepherd-Evergreen, TX in 2022 was $58,900, which was 22.7% less than the median annual income of $72,284 across the entire state of Texas. Compared to the median income of $31,949 in 2000 this represents an increase of 45.8%. The per capita income in 2022 was $27,366, which means an increase of 48.5% compared to 2000 when it was $14,091.
Income statistics for all residents
Median household income in Shepherd-Evergreen, TX in 2022:| Shepherd-Evergreen: | $58,901 |
| State: | $72,284 |
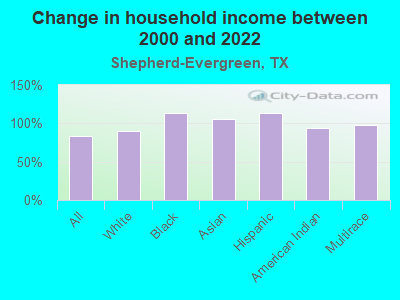
Change in median household income between 2000 and 2022:| Shepherd-Evergreen, Texas: | +84.4% |
| Texas: | +81.0% |
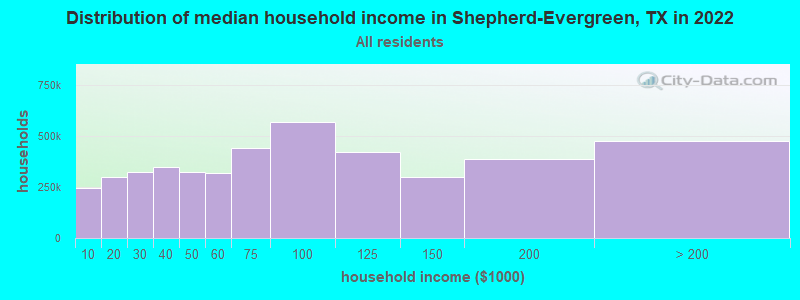
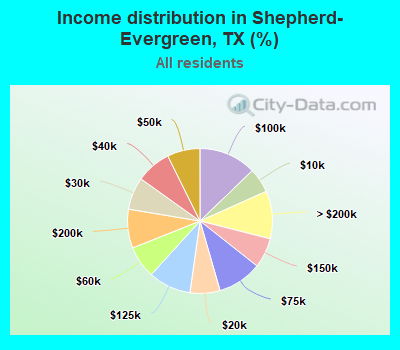
Number of households with income < $10k:| Shepherd-Evergreen: | 5.5% (244,328) |
| Texas: | 5.5% (611,011) |
Number of households with income $10k - 20k:| Shepherd-Evergreen: | 6.7% (297,323) |
| State: | 6.7% (743,157) |
Number of households with income $20k - 30k:| Shepherd-Evergreen: | 7.2% (321,428) |
| State: | 7.2% (803,381) |
Number of households with income $30k - 40k:| Shepherd-Evergreen: | 7.8% (346,473) |
| State: | 7.8% (866,080) |
Number of households with income $40k - 50k:| Shepherd-Evergreen: | 7.3% (324,228) |
| State: | 7.3% (810,440) |
Number of households with income $50k - 60k:| Shepherd-Evergreen: | 7.2% (319,922) |
| State: | 7.2% (799,783) |
Number of households with income $60k - 75k:| Shepherd-Evergreen: | 9.9% (438,187) |
| State: | 9.9% (1,095,384) |
Number of households with income $75k - 100k:| Shepherd-Evergreen: | 12.8% (567,821) |
| State: | 12.8% (1,419,057) |
Number of households with income $100k - 125k:| Shepherd-Evergreen: | 9.5% (422,021) |
| State: | 9.5% (1,054,577) |
Number of households with income $125k - 150k:| Shepherd-Evergreen: | 6.7% (296,815) |
| State: | 6.7% (741,518) |
Number of households with income $150k - 200k:| Shepherd-Evergreen: | 8.7% (384,765) |
| State: | 8.7% (961,776) |
Number of households with income > $200k:| Shepherd-Evergreen: | 10.7% (472,490) |
| State: | 10.7% (1,181,544) |
Aggregate household income in Shepherd-Evergreen in 2022: $49,880,383,994
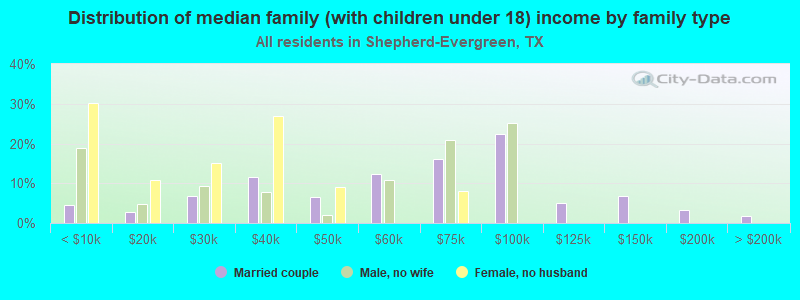
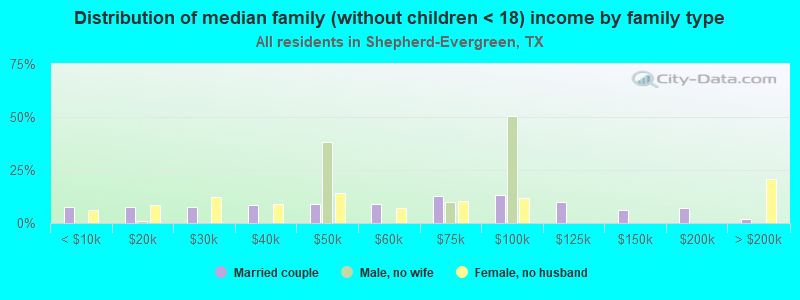
Median family income in Shepherd-Evergreen in 2022:| Shepherd-Evergreen: | $70,817 |
| State: | $86,267 |
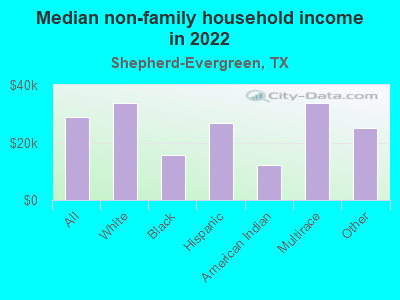
Median non-family income in Shepherd-Evergreen in 2022:| Shepherd-Evergreen: | $28,754 |
| Texas: | $45,999 |
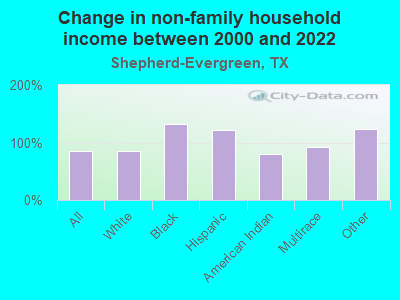
Change in median non-family income between 2000 and 2022:| Shepherd-Evergreen, Texas: | +85.2% |
| State: | +79.5% |
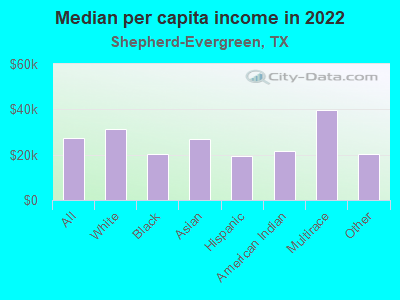
Median per capita income in Shepherd-Evergreen in 2022:| Shepherd-Evergreen: | $27,366 |
| Texas: | $38,123 |
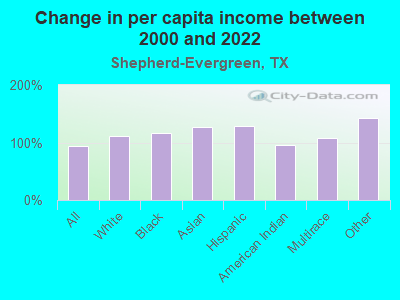
Change in median per capita income between 2000 and 2022:| Shepherd-Evergreen, Texas: | +94.2% |
| State: | +94.3% |
Income statistics for White residents
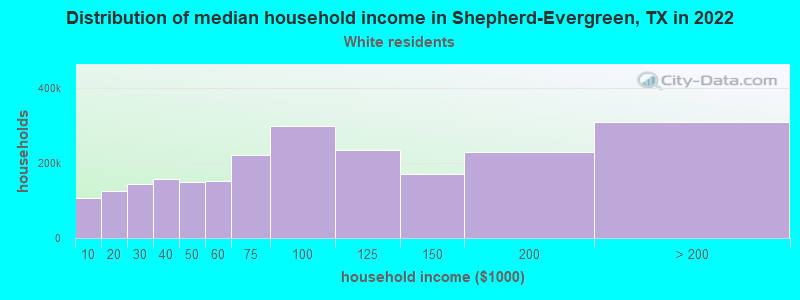
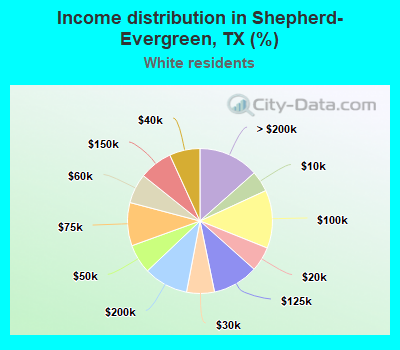
Median household income in Shepherd-Evergreen, TX in 2022:| Shepherd-Evergreen: | $64,286 |
| State: | $82,032 |
Change in median household income between 2000 and 2022:| Shepherd-Evergreen, Texas: | +90.4% |
| Texas: | +91.0% |
Number of households with income < $10k:| Shepherd-Evergreen: | 4.7% (107,283) |
| Texas: | 4.7% (273,716) |
Number of households with income $10k - 20k:| Shepherd-Evergreen: | 5.5% (126,714) |
| State: | 5.5% (322,702) |
Number of households with income $20k - 30k:| Shepherd-Evergreen: | 6.2% (142,989) |
| State: | 6.2% (363,947) |
Number of households with income $30k - 40k:| Shepherd-Evergreen: | 6.8% (156,733) |
| Texas: | 6.8% (399,275) |
Number of households with income $40k - 50k:| Shepherd-Evergreen: | 6.5% (150,455) |
| State: | 6.5% (383,417) |
Number of households with income $50k - 60k:| Shepherd-Evergreen: | 6.6% (152,434) |
| State: | 6.6% (388,535) |
Number of households with income $60k - 75k:| Shepherd-Evergreen: | 9.6% (221,882) |
| Texas: | 9.7% (566,295) |
Number of households with income $75k - 100k:| Shepherd-Evergreen: | 13.0% (298,172) |
| Texas: | 13.0% (760,276) |
Number of households with income $100k - 125k:| Shepherd-Evergreen: | 10.2% (234,375) |
| State: | 10.2% (597,596) |
Number of households with income $125k - 150k:| Shepherd-Evergreen: | 7.4% (171,275) |
| Texas: | 7.4% (436,830) |
Number of households with income $150k - 200k:| Shepherd-Evergreen: | 9.9% (228,431) |
| Texas: | 9.9% (583,067) |
Number of households with income > $200k:| Shepherd-Evergreen: | 13.5% (309,729) |
| Texas: | 13.5% (792,647) |
Aggregate household income in Shepherd-Evergreen in 2022: $27,168,506,730
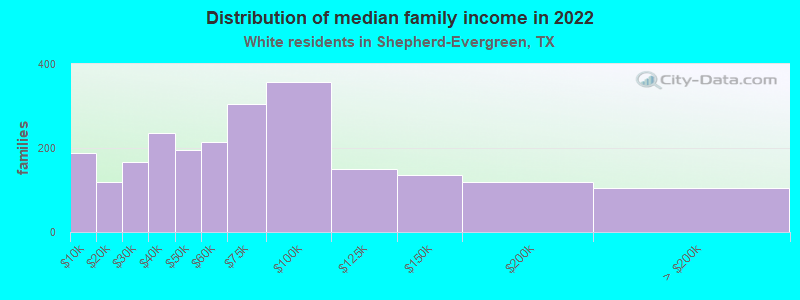
Median family income in Shepherd-Evergreen in 2022:| Shepherd-Evergreen: | $77,215 |
| State: | $101,788 |
Number of families with income < $10k:| Shepherd-Evergreen: | 8.2% (188) |
| State: | 2.8% (108,142) |
Number of families with income $10k - 20k:| Shepherd-Evergreen: | 5.3% (120) |
| Texas: | 2.9% (113,421) |
Number of families with income $20k - 30k:| Shepherd-Evergreen: | 7.2% (166) |
| State: | 4.1% (157,688) |
Number of families with income $30k - 40k:| Shepherd-Evergreen: | 10.3% (235) |
| Texas: | 5.2% (198,847) |
Number of families with income $40k - 50k:| Shepherd-Evergreen: | 8.5% (195) |
| State: | 5.6% (216,490) |
Number of families with income $50k - 60k:| Shepherd-Evergreen: | 9.4% (214) |
| State: | 5.7% (220,689) |
Number of families with income $60k - 75k:| Shepherd-Evergreen: | 13.3% (304) |
| Texas: | 9.0% (346,106) |
Number of families with income $75k - 100k:| Shepherd-Evergreen: | 15.6% (356) |
| Texas: | 13.7% (527,363) |
Number of families with income $100k - 125k:| Shepherd-Evergreen: | 6.6% (151) |
| State: | 11.6% (448,411) |
Number of families with income $125k - 150k:| Shepherd-Evergreen: | 5.9% (135) |
| State: | 9.2% (355,798) |
Number of families with income $150k - 200k:| Shepherd-Evergreen: | 5.2% (119) |
| State: | 12.5% (480,185) |
Number of families with income > $200k:| Shepherd-Evergreen: | 4.6% (104) |
| State: | 17.6% (677,490) |
Median non-family income in Shepherd-Evergreen in 2022:| Shepherd-Evergreen: | $33,842 |
| State: | $50,587 |
Change in median non-family income between 2000 and 2022:| Shepherd-Evergreen, Texas: | +85.8% |
| State: | +87.7% |
Median per capita income in Shepherd-Evergreen in 2022:| Shepherd-Evergreen: | $31,310 |
| Texas: | $47,740 |
Change in median per capita income between 2000 and 2022:| Shepherd-Evergreen, Texas: | +112.1% |
| State: | +114.3% |
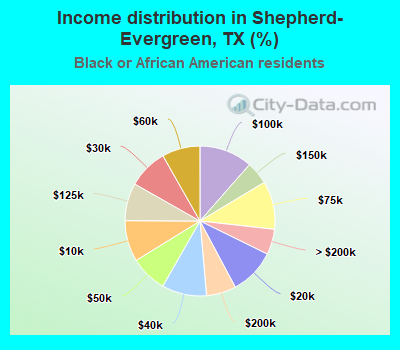
Income statistics for Black or African American residents
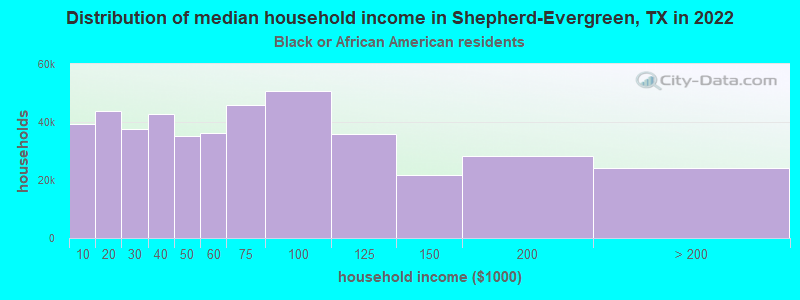
Median household income in Shepherd-Evergreen, TX in 2022:| Shepherd-Evergreen: | $39,012 |
| State: | $55,759 |
Change in median household income between 2000 and 2022:| Shepherd-Evergreen, Texas: | +113.5% |
| Texas: | +90.3% |
Number of households with income < $10k:| Shepherd-Evergreen: | 8.9% (39,248) |
| State: | 8.9% (126,378) |
Number of households with income $10k - 20k:| Shepherd-Evergreen: | 9.9% (43,880) |
| Texas: | 9.9% (140,369) |
Number of households with income $20k - 30k:| Shepherd-Evergreen: | 8.5% (37,751) |
| State: | 8.5% (120,639) |
Number of households with income $30k - 40k:| Shepherd-Evergreen: | 9.7% (42,682) |
| State: | 9.7% (137,517) |
Number of households with income $40k - 50k:| Shepherd-Evergreen: | 7.9% (35,064) |
| State: | 8.0% (112,973) |
Number of households with income $50k - 60k:| Shepherd-Evergreen: | 8.2% (36,333) |
| Texas: | 8.3% (117,156) |
Number of households with income $60k - 75k:| Shepherd-Evergreen: | 10.4% (45,865) |
| Texas: | 10.4% (147,462) |
Number of households with income $75k - 100k:| Shepherd-Evergreen: | 11.5% (50,643) |
| State: | 11.5% (162,718) |
Number of households with income $100k - 125k:| Shepherd-Evergreen: | 8.1% (35,957) |
| Texas: | 8.2% (115,829) |
Number of households with income $125k - 150k:| Shepherd-Evergreen: | 4.9% (21,789) |
| State: | 4.9% (69,556) |
Number of households with income $150k - 200k:| Shepherd-Evergreen: | 6.4% (28,221) |
| Texas: | 6.4% (90,701) |
Number of households with income > $200k:| Shepherd-Evergreen: | 5.5% (24,245) |
| Texas: | 5.5% (77,988) |
Aggregate household income in Shepherd-Evergreen in 2022: $319,950,172
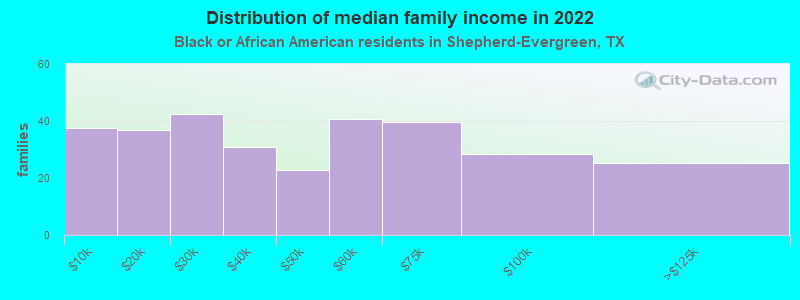
Median family income in Shepherd-Evergreen in 2022:| Shepherd-Evergreen: | $59,270 |
| Texas: | $69,134 |
Number of families with income < $10k:| Shepherd-Evergreen: | 12.4% (38) |
| State: | 6.8% (55,625) |
Number of families with income $10k - 20k:| Shepherd-Evergreen: | 12.1% (37) |
| Texas: | 6.8% (55,300) |
Number of families with income $20k - 30k:| Shepherd-Evergreen: | 14.0% (42) |
| Texas: | 7.1% (57,877) |
Number of families with income $30k - 40k:| Shepherd-Evergreen: | 10.2% (31) |
| State: | 8.5% (68,776) |
Number of families with income $40k - 50k:| Shepherd-Evergreen: | 7.5% (23) |
| Texas: | 7.1% (57,907) |
Number of families with income $50k - 60k:| Shepherd-Evergreen: | 13.4% (41) |
| State: | 7.3% (59,511) |
Number of families with income $60k - 75k:| Shepherd-Evergreen: | 13.0% (40) |
| State: | 10.1% (81,994) |
Number of families with income $75k - 100k:| Shepherd-Evergreen: | 9.3% (28) |
| Texas: | 12.7% (103,723) |
Number of families with income $100k - 125k:| Shepherd-Evergreen: | 8.3% (25) |
| Texas: | 9.4% (76,609) |
Median non-family income in Shepherd-Evergreen in 2022:| Shepherd-Evergreen: | $15,553 |
| Texas: | $40,133 |
Change in median non-family income between 2000 and 2022:| Shepherd-Evergreen, Texas: | +133.0% |
| State: | +102.2% |
Median per capita income in Shepherd-Evergreen in 2022:| Shepherd-Evergreen: | $20,287 |
| State: | $30,490 |
Change in median per capita income between 2000 and 2022:| Shepherd-Evergreen, Texas: | +116.3% |
| State: | +113.9% |
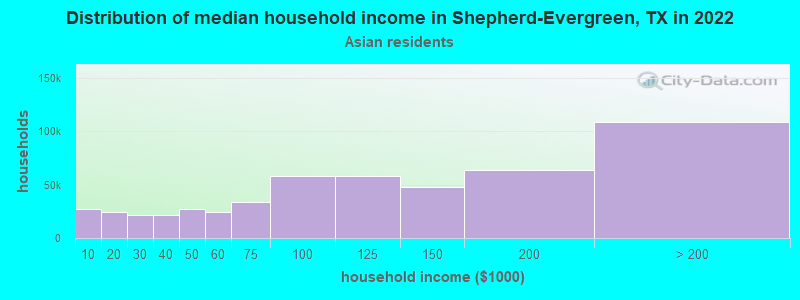
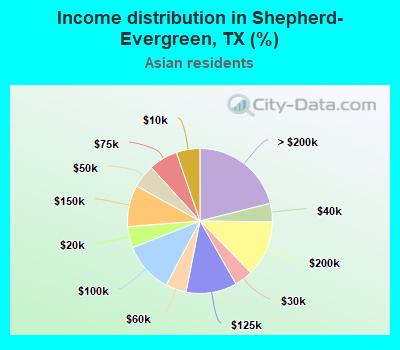
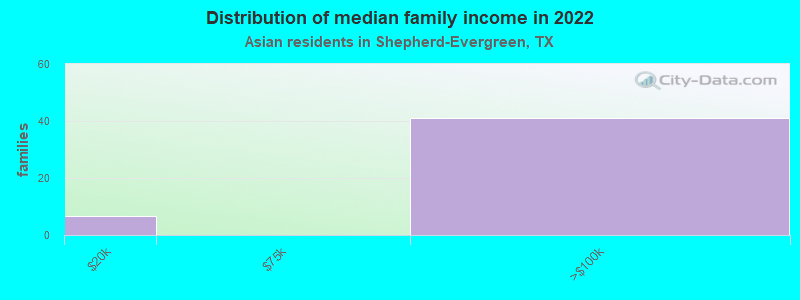
Income statistics for Asian residents
Median household income in Shepherd-Evergreen, TX in 2022:| Shepherd-Evergreen: | $185,940 |
| Texas: | $107,673 |
Change in median household income between 2000 and 2022:| Shepherd-Evergreen, Texas: | +105.9% |
| Texas: | +115.1% |
Number of households with income < $10k:| Shepherd-Evergreen: | 5.3% (26,994) |
| State: | 5.2% (29,885) |
Number of households with income $10k - 20k:| Shepherd-Evergreen: | 4.8% (24,425) |
| Texas: | 4.7% (27,044) |
Number of households with income $20k - 30k:| Shepherd-Evergreen: | 4.1% (21,050) |
| Texas: | 4.1% (23,363) |
Number of households with income $30k - 40k:| Shepherd-Evergreen: | 4.1% (21,044) |
| State: | 4.1% (23,309) |
Number of households with income $40k - 50k:| Shepherd-Evergreen: | 5.2% (26,903) |
| State: | 5.2% (29,826) |
Number of households with income $50k - 60k:| Shepherd-Evergreen: | 4.6% (23,864) |
| Texas: | 4.7% (26,512) |
Number of households with income $60k - 75k:| Shepherd-Evergreen: | 6.5% (33,330) |
| State: | 6.5% (36,905) |
Number of households with income $75k - 100k:| Shepherd-Evergreen: | 11.3% (57,957) |
| Texas: | 11.3% (64,350) |
Number of households with income $100k - 125k:| Shepherd-Evergreen: | 11.3% (58,327) |
| State: | 11.4% (64,714) |
Number of households with income $125k - 150k:| Shepherd-Evergreen: | 9.3% (47,551) |
| State: | 9.3% (52,719) |
Number of households with income $150k - 200k:| Shepherd-Evergreen: | 12.5% (64,008) |
| Texas: | 12.5% (70,953) |
Number of households with income > $200k:| Shepherd-Evergreen: | 21.1% (108,482) |
| State: | 21.1% (120,260) |
Aggregate household income in Shepherd-Evergreen in 2022: $24,922,513
Median family income in Shepherd-Evergreen in 2022:| Shepherd-Evergreen: | $192,716 |
| Texas: | $123,328 |
Number of families with income $10k - 20k:| Shepherd-Evergreen: | 13.7% (7) |
| State: | 3.0% (13,043) |
Number of families with income $75k - 100k:| Shepherd-Evergreen: | 86.3% (41) |
| Texas: | 10.7% (46,626) |
Median per capita income in Shepherd-Evergreen in 2022:| Shepherd-Evergreen: | $26,741 |
| Texas: | $48,626 |
Change in median per capita income between 2000 and 2022:| Shepherd-Evergreen, Texas: | +127.1% |
| State: | +132.0% |
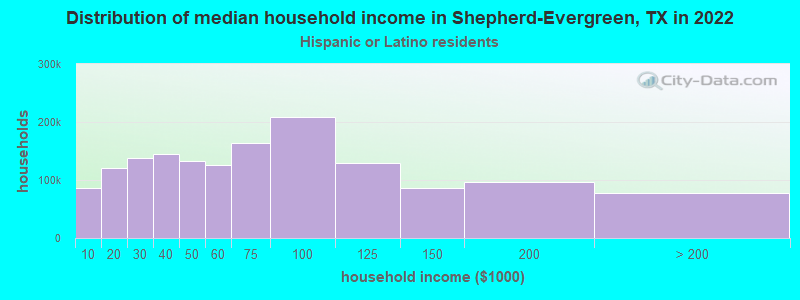
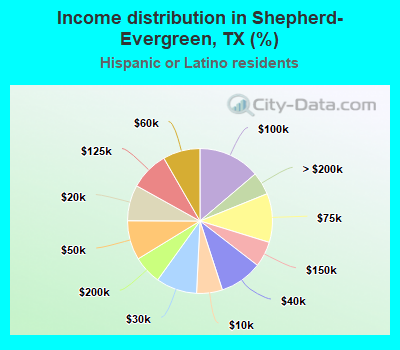
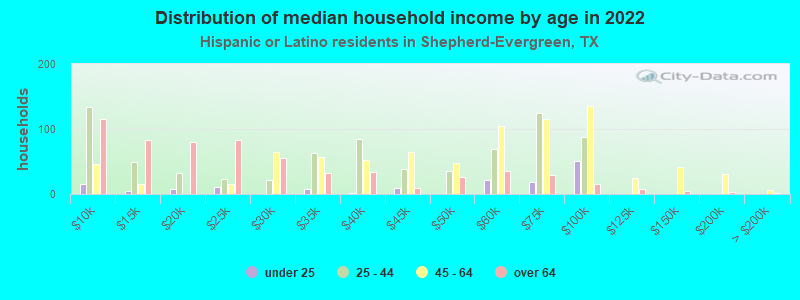
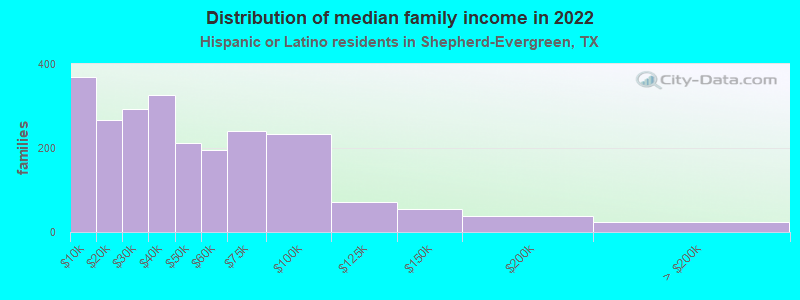
Income statistics for Hispanic or Latino residents
Median household income in Shepherd-Evergreen, TX in 2022:| Shepherd-Evergreen: | $51,627 |
| Texas: | $60,504 |
Change in median household income between 2000 and 2022:| Shepherd-Evergreen, Texas: | +112.9% |
| State: | +102.5% |
Number of households with income < $10k:| Shepherd-Evergreen: | 5.8% (86,937) |
| Texas: | 5.8% (213,953) |
Number of households with income $10k - 20k:| Shepherd-Evergreen: | 8.0% (120,909) |
| State: | 8.0% (297,456) |
Number of households with income $20k - 30k:| Shepherd-Evergreen: | 9.2% (138,146) |
| State: | 9.2% (340,166) |
Number of households with income $30k - 40k:| Shepherd-Evergreen: | 9.5% (144,031) |
| State: | 9.5% (354,336) |
Number of households with income $40k - 50k:| Shepherd-Evergreen: | 8.8% (132,835) |
| Texas: | 8.8% (327,013) |
Number of households with income $50k - 60k:| Shepherd-Evergreen: | 8.3% (125,370) |
| State: | 8.3% (308,818) |
Number of households with income $60k - 75k:| Shepherd-Evergreen: | 10.9% (164,605) |
| State: | 10.9% (405,109) |
Number of households with income $75k - 100k:| Shepherd-Evergreen: | 13.8% (207,984) |
| Texas: | 13.8% (511,639) |
Number of households with income $100k - 125k:| Shepherd-Evergreen: | 8.6% (129,980) |
| State: | 8.6% (319,728) |
Number of households with income $125k - 150k:| Shepherd-Evergreen: | 5.7% (85,825) |
| State: | 5.7% (210,932) |
Number of households with income $150k - 200k:| Shepherd-Evergreen: | 6.4% (95,850) |
| State: | 6.4% (236,055) |
Number of households with income > $200k:| Shepherd-Evergreen: | 5.1% (76,954) |
| State: | 5.1% (189,259) |
Aggregate household income in Shepherd-Evergreen in 2022: $424,317,345
Median family income in Shepherd-Evergreen in 2022:| Shepherd-Evergreen: | $54,372 |
| State: | $65,080 |
Number of families with income < $10k:| Shepherd-Evergreen: | 15.9% (369) |
| State: | 5.3% (147,493) |
Number of families with income $10k - 20k:| Shepherd-Evergreen: | 11.5% (267) |
| State: | 6.3% (174,531) |
Number of families with income $20k - 30k:| Shepherd-Evergreen: | 12.7% (294) |
| State: | 8.6% (238,528) |
Number of families with income $30k - 40k:| Shepherd-Evergreen: | 14.0% (326) |
| Texas: | 9.1% (251,999) |
Number of families with income $40k - 50k:| Shepherd-Evergreen: | 9.2% (213) |
| Texas: | 8.6% (240,188) |
Number of families with income $50k - 60k:| Shepherd-Evergreen: | 8.4% (196) |
| Texas: | 8.0% (223,566) |
Number of families with income $60k - 75k:| Shepherd-Evergreen: | 10.4% (240) |
| Texas: | 10.9% (302,688) |
Number of families with income $75k - 100k:| Shepherd-Evergreen: | 10.0% (233) |
| Texas: | 14.3% (398,554) |
Number of families with income $100k - 125k:| Shepherd-Evergreen: | 3.1% (72) |
| State: | 9.5% (264,007) |
Number of families with income $125k - 150k:| Shepherd-Evergreen: | 2.3% (54) |
| State: | 6.2% (171,274) |
Number of families with income $150k - 200k:| Shepherd-Evergreen: | 1.6% (37) |
| State: | 7.3% (202,259) |
Number of families with income > $200k:| Shepherd-Evergreen: | 1.0% (23) |
| State: | 5.9% (165,129) |
Median non-family income in Shepherd-Evergreen in 2022:| Shepherd-Evergreen: | $26,913 |
| Texas: | $39,934 |
Change in median non-family income between 2000 and 2022:| Shepherd-Evergreen, Texas: | +120.8% |
| State: | +109.1% |
Median per capita income in Shepherd-Evergreen in 2022:| Shepherd-Evergreen: | $19,240 |
| Texas: | $24,862 |
Change in median per capita income between 2000 and 2022:| Shepherd-Evergreen, Texas: | +128.5% |
| Texas: | +130.8% |
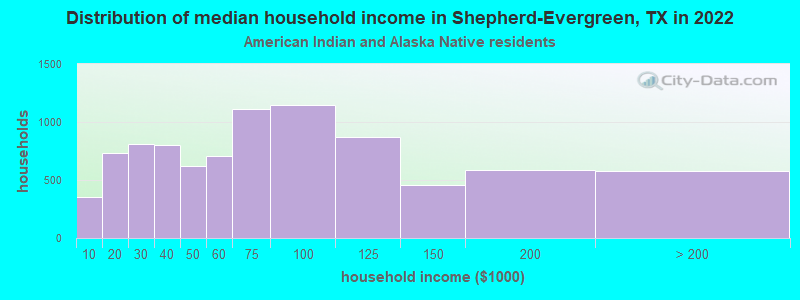
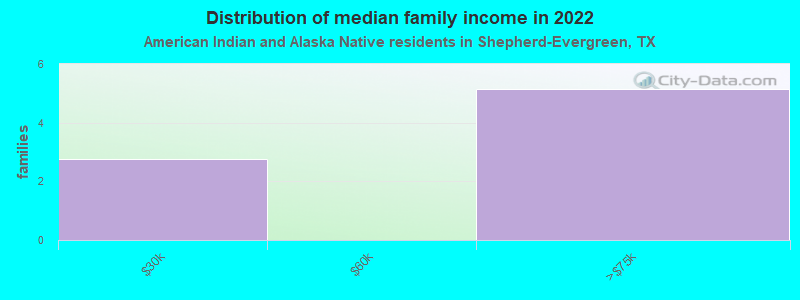
Income statistics for American Indian and Alaska Native residents
Median household income in Shepherd-Evergreen, TX in 2022:| Shepherd-Evergreen: | $14,182 |
| Texas: | $65,765 |
Change in median household income between 2000 and 2022:| Shepherd-Evergreen, Texas: | +93.7% |
| State: | +88.3% |
Number of households with income < $10k:| Shepherd-Evergreen: | 4.1% (357) |
| State: | 4.1% (3,398) |
Number of households with income $10k - 20k:| Shepherd-Evergreen: | 8.3% (730) |
| State: | 8.3% (6,949) |
Number of households with income $20k - 30k:| Shepherd-Evergreen: | 9.3% (813) |
| State: | 9.3% (7,742) |
Number of households with income $30k - 40k:| Shepherd-Evergreen: | 9.1% (800) |
| State: | 9.1% (7,627) |
Number of households with income $40k - 50k:| Shepherd-Evergreen: | 7.1% (623) |
| State: | 7.1% (5,922) |
Number of households with income $50k - 60k:| Shepherd-Evergreen: | 8.1% (710) |
| Texas: | 8.1% (6,761) |
Number of households with income $60k - 75k:| Shepherd-Evergreen: | 12.7% (1,111) |
| Texas: | 12.7% (10,588) |
Number of households with income $75k - 100k:| Shepherd-Evergreen: | 13.0% (1,145) |
| State: | 13.0% (10,903) |
Number of households with income $100k - 125k:| Shepherd-Evergreen: | 9.9% (867) |
| Texas: | 9.9% (8,256) |
Number of households with income $125k - 150k:| Shepherd-Evergreen: | 5.2% (457) |
| State: | 5.2% (4,355) |
Number of households with income $150k - 200k:| Shepherd-Evergreen: | 6.7% (590) |
| State: | 6.7% (5,623) |
Number of households with income > $200k:| Shepherd-Evergreen: | 6.6% (579) |
| State: | 6.6% (5,522) |
Aggregate household income in Shepherd-Evergreen in 2022: $1,928,447
Median family income in Shepherd-Evergreen in 2022:| Shepherd-Evergreen: | $51,248 |
| State: | $72,369 |
Median non-family income in Shepherd-Evergreen in 2022:| Shepherd-Evergreen: | $12,224 |
| State: | $40,351 |
Change in median non-family income between 2000 and 2022:| Shepherd-Evergreen, Texas: | +80.1% |
| State: | +71.9% |
Median per capita income in Shepherd-Evergreen in 2022:| Shepherd-Evergreen: | $21,796 |
| State: | $28,166 |
Change in median per capita income between 2000 and 2022:| Shepherd-Evergreen, Texas: | +95.5% |
| State: | +77.2% |
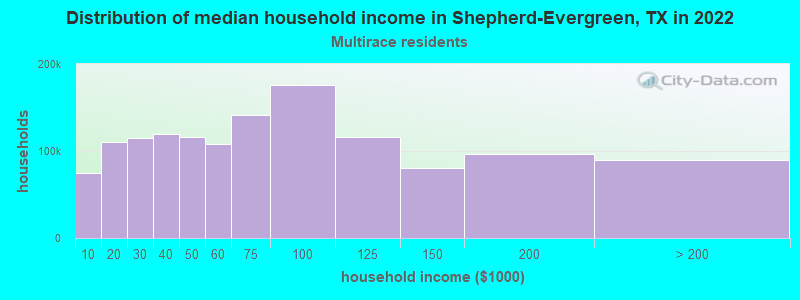
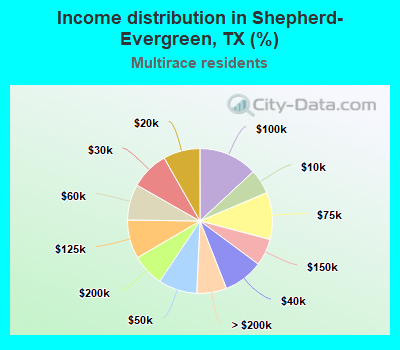
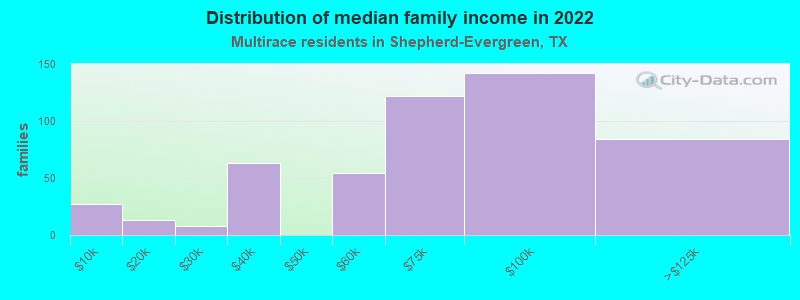
Income statistics for Multirace residents
Median household income in Shepherd-Evergreen, TX in 2022:| Shepherd-Evergreen: | $78,468 |
| State: | $62,748 |
Change in median household income between 2000 and 2022:| Shepherd-Evergreen, Texas: | +97.9% |
| State: | +92.3% |
Number of households with income < $10k:| Shepherd-Evergreen: | 5.5% (74,233) |
| Texas: | 5.5% (122,324) |
Number of households with income $10k - 20k:| Shepherd-Evergreen: | 8.2% (110,590) |
| State: | 8.2% (182,232) |
Number of households with income $20k - 30k:| Shepherd-Evergreen: | 8.5% (114,854) |
| State: | 8.5% (189,456) |
Number of households with income $30k - 40k:| Shepherd-Evergreen: | 8.9% (119,822) |
| State: | 8.9% (197,499) |
Number of households with income $40k - 50k:| Shepherd-Evergreen: | 8.7% (116,387) |
| Texas: | 8.7% (191,735) |
Number of households with income $50k - 60k:| Shepherd-Evergreen: | 8.0% (107,648) |
| State: | 8.0% (177,535) |
Number of households with income $60k - 75k:| Shepherd-Evergreen: | 10.5% (141,095) |
| State: | 10.5% (232,479) |
Number of households with income $75k - 100k:| Shepherd-Evergreen: | 13.1% (176,220) |
| Texas: | 13.1% (290,448) |
Number of households with income $100k - 125k:| Shepherd-Evergreen: | 8.6% (116,295) |
| Texas: | 8.6% (191,595) |
Number of households with income $125k - 150k:| Shepherd-Evergreen: | 6.0% (81,003) |
| Texas: | 6.0% (133,361) |
Number of households with income $150k - 200k:| Shepherd-Evergreen: | 7.2% (96,479) |
| State: | 7.2% (159,195) |
Number of households with income > $200k:| Shepherd-Evergreen: | 6.7% (89,828) |
| Texas: | 6.7% (148,064) |
Aggregate household income in Shepherd-Evergreen in 2022: $104,319,593
Median family income in Shepherd-Evergreen in 2022:| Shepherd-Evergreen: | $100,959 |
| Texas: | $69,780 |
Number of families with income < $10k:| Shepherd-Evergreen: | 5.3% (27) |
| State: | 4.4% (70,825) |
Number of families with income $10k - 20k:| Shepherd-Evergreen: | 2.5% (13) |
| State: | 5.9% (95,279) |
Number of families with income $20k - 30k:| Shepherd-Evergreen: | 1.6% (8) |
| Texas: | 7.8% (126,627) |
Number of families with income $30k - 40k:| Shepherd-Evergreen: | 12.2% (63) |
| Texas: | 8.5% (137,626) |
Number of families with income $50k - 60k:| Shepherd-Evergreen: | 10.5% (54) |
| State: | 7.9% (127,739) |
Number of families with income $60k - 75k:| Shepherd-Evergreen: | 23.7% (122) |
| State: | 10.5% (169,549) |
Number of families with income $75k - 100k:| Shepherd-Evergreen: | 27.8% (142) |
| Texas: | 14.0% (226,284) |
Number of families with income $100k - 125k:| Shepherd-Evergreen: | 16.4% (84) |
| State: | 9.5% (153,597) |
Median non-family income in Shepherd-Evergreen in 2022:| Shepherd-Evergreen: | $33,802 |
| State: | $40,634 |
Change in median non-family income between 2000 and 2022:| Shepherd-Evergreen, Texas: | +93.2% |
| Texas: | +77.2% |
Median per capita income in Shepherd-Evergreen in 2022:| Shepherd-Evergreen: | $39,874 |
| State: | $26,785 |
Change in median per capita income between 2000 and 2022:| Shepherd-Evergreen, Texas: | +108.4% |
| State: | +110.9% |
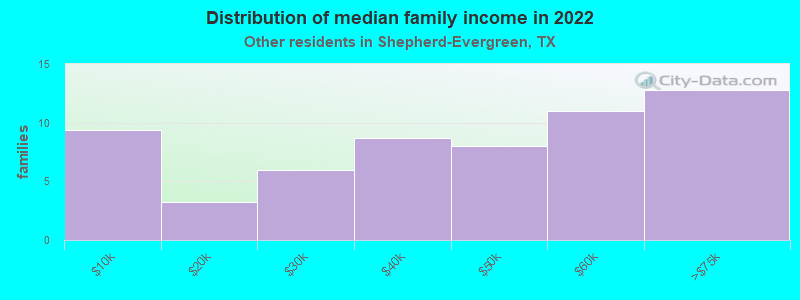
Income statistics for other residents
Number of households with income < $10k:| Shepherd-Evergreen: | 6.0% (26) |
| State: | 5.9% (54,162) |
Number of households with income $10k - 20k:| Shepherd-Evergreen: | 6.9% (30) |
| Texas: | 6.8% (62,891) |
Number of households with income $20k - 30k:| Shepherd-Evergreen: | 10.6% (46) |
| State: | 10.6% (97,294) |
Number of households with income $30k - 40k:| Shepherd-Evergreen: | 10.8% (47) |
| State: | 10.8% (99,670) |
Number of households with income $40k - 50k:| Shepherd-Evergreen: | 9.2% (40) |
| State: | 9.3% (85,548) |
Number of households with income $50k - 60k:| Shepherd-Evergreen: | 9.0% (39) |
| State: | 9.0% (82,757) |
Number of households with income $60k - 75k:| Shepherd-Evergreen: | 10.8% (47) |
| State: | 10.9% (100,326) |
Number of households with income $75k - 100k:| Shepherd-Evergreen: | 14.1% (61) |
| State: | 14.0% (128,767) |
Number of households with income $100k - 125k:| Shepherd-Evergreen: | 8.3% (36) |
| State: | 8.2% (75,218) |
Number of households with income $125k - 150k:| Shepherd-Evergreen: | 4.8% (21) |
| Texas: | 4.8% (44,223) |
Number of households with income $150k - 200k:| Shepherd-Evergreen: | 5.5% (24) |
| State: | 5.6% (51,376) |
Number of households with income > $200k:| Shepherd-Evergreen: | 3.9% (17) |
| State: | 4.0% (36,393) |
Aggregate household income in Shepherd-Evergreen in 2022: $31,831,676
Median family income in Shepherd-Evergreen in 2022:| Shepherd-Evergreen: | $69,500 |
| Texas: | $60,064 |
Number of families with income < $10k:| Shepherd-Evergreen: | 15.8% (9) |
| Texas: | 6.8% (47,502) |
Number of families with income $10k - 20k:| Shepherd-Evergreen: | 5.5% (3) |
| State: | 6.0% (41,763) |
Number of families with income $20k - 30k:| Shepherd-Evergreen: | 10.1% (6) |
| State: | 9.9% (68,761) |
Number of families with income $30k - 40k:| Shepherd-Evergreen: | 14.8% (9) |
| State: | 9.7% (67,685) |
Number of families with income $40k - 50k:| Shepherd-Evergreen: | 13.6% (8) |
| State: | 9.0% (62,441) |
Number of families with income $50k - 60k:| Shepherd-Evergreen: | 18.6% (11) |
| State: | 8.5% (59,321) |
Number of families with income $60k - 75k:| Shepherd-Evergreen: | 21.6% (13) |
| State: | 11.2% (77,588) |
Median non-family income in Shepherd-Evergreen in 2022:| Shepherd-Evergreen: | $25,192 |
| State: | $38,690 |
Change in median non-family income between 2000 and 2022:| Shepherd-Evergreen, Texas: | +123.9% |
| State: | +90.2% |
Median per capita income in Shepherd-Evergreen in 2022:| Shepherd-Evergreen: | $20,460 |
| Texas: | $23,899 |
Change in median per capita income between 2000 and 2022:| Shepherd-Evergreen, Texas: | +141.8% |
| Texas: | +135.2% |