The median household income in Seabrook, MD in 2022 was $92,650, which was 2.5% less than the median annual income of $94,991 across the entire state of Maryland. Compared to the median income of $55,256 in 2000 this represents an increase of 40.4%. The per capita income in 2022 was $34,273, which means an increase of 31.8% compared to 2000 when it was $23,360.
Whole page based on the data from 2000 / 2022 when the population of Seabrook, Maryland was 17,287 / 19,162
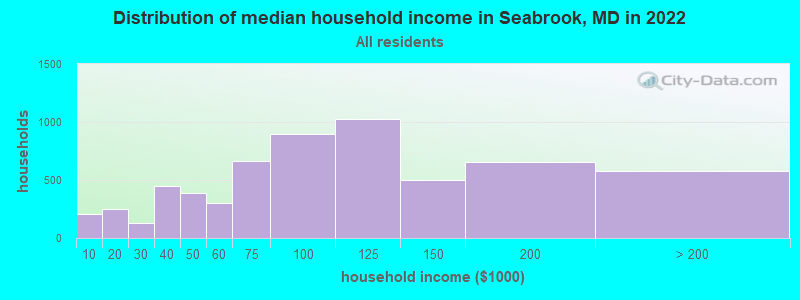
Income statistics for all residents
Median household income in Seabrook, MD in 2022:
Seabrook:
$92,650
State:
$94,991
Change in median household income between 2000 and 2022:
Seabrook, Maryland:
+67.7%
State:
+79.7%
Number of households with income < $10k:
Seabrook:
3.4% (205)
State:
4.8% (114,450)
Number of households with income $10k - 20k:
Seabrook:
4.1% (247)
Maryland:
5.0% (117,883)
Number of households with income $20k - 30k:
Seabrook:
2.2% (132)
Maryland:
5.2% (123,350)
Number of households with income $30k - 40k:
Seabrook:
7.4% (448)
State:
5.6% (134,104)
Number of households with income $40k - 50k:
Seabrook:
6.4% (384)
State:
5.6% (132,932)
Number of households with income $50k - 60k:
Seabrook:
5.0% (299)
State:
5.6% (132,707)
Number of households with income $60k - 75k:
Seabrook:
11.0% (667)
State:
7.9% (188,335)
Number of households with income $75k - 100k:
Seabrook:
14.9% (899)
State:
12.5% (297,873)
Number of households with income $100k - 125k:
Seabrook:
17.0% (1,027)
State:
10.5% (250,497)
Number of households with income $125k - 150k:
Seabrook:
8.2% (497)
State:
8.1% (193,208)
Number of households with income $150k - 200k:
Seabrook:
10.8% (654)
State:
11.6% (274,905)
Number of households with income > $200k:
Seabrook:
9.6% (578)
State:
17.5% (415,740)
Aggregate household income in Seabrook in 2022: $634,134,540
Median family income in Seabrook in 2022:
Seabrook:
$91,589
State:
$117,294
Number of families with income < $10k:
Seabrook:
3.9% (184)
State:
2.7% (41,433)
Number of families with income $10k - 20k:
Seabrook:
3.2% (153)
Maryland:
2.6% (40,126)
Number of families with income $20k - 30k:
Seabrook:
1.1% (53)
Maryland:
3.4% (52,891)
Number of families with income $30k - 40k:
Seabrook:
8.1% (384)
Maryland:
4.5% (70,252)
Number of families with income $40k - 50k:
Seabrook:
8.7% (410)
State:
4.8% (74,112)
Number of families with income $50k - 60k:
Seabrook:
4.0% (187)
Maryland:
5.0% (77,590)
Number of families with income $60k - 75k:
Seabrook:
11.9% (561)
State:
7.1% (109,924)
Number of families with income $75k - 100k:
Seabrook:
12.7% (602)
State:
12.0% (185,255)
Number of families with income $100k - 125k:
Seabrook:
17.6% (832)
State:
11.2% (173,203)
Number of families with income $125k - 150k:
Seabrook:
8.6% (406)
State:
9.3% (143,453)
Number of families with income $150k - 200k:
Seabrook:
9.2% (435)
Maryland:
14.2% (218,861)
Number of families with income > $200k:
Seabrook:
10.9% (517)
State:
23.2% (359,182)
Median non-family income in Seabrook in 2022:
Seabrook:
$68,887
Maryland:
$57,179
Change in median non-family income between 2000 and 2022:
Seabrook, Maryland:
+84.0%
State:
+75.1%
Median per capita income in Seabrook in 2022:
Seabrook:
$34,273
State:
$49,236
Change in median per capita income between 2000 and 2022:
Seabrook, Maryland:
+46.7%
State:
+92.2%
Income statistics for White residents
Median household income in Seabrook, MD in 2022:
Seabrook:
$112,435
State:
$107,160
Change in median household income between 2000 and 2022:
Seabrook, Maryland:
+87.6%
State:
+85.3%
Number of households with income < $10k:
Seabrook:
4.1% (28)
State:
3.7% (47,387)
Number of households with income $10k - 20k:
Seabrook:
0.7% (5)
State:
4.1% (52,102)
Number of households with income $20k - 30k:
Seabrook:
3.3% (22)
State:
4.6% (58,758)
Number of households with income $30k - 40k:
Seabrook:
4.1% (28)
State:
4.7% (59,745)
Number of households with income $40k - 50k:
Seabrook:
9.9% (67)
State:
5.0% (62,576)
Number of households with income $50k - 60k:
Seabrook:
4.4% (30)
State:
5.1% (64,484)
Number of households with income $60k - 75k:
Seabrook:
8.9% (60)
Maryland:
7.7% (97,019)
Number of households with income $75k - 100k:
Seabrook:
11.1% (75)
State:
11.8% (149,205)
Number of households with income $100k - 125k:
Seabrook:
20.6% (139)
State:
10.6% (134,231)
Number of households with income $125k - 150k:
Seabrook:
6.1% (41)
State:
8.8% (111,081)
Number of households with income $150k - 200k:
Seabrook:
10.7% (72)
State:
12.9% (162,966)
Number of households with income > $200k:
Seabrook:
16.1% (109)
State:
20.9% (264,377)
Aggregate household income in Seabrook in 2022: $77,189,260
Median family income in Seabrook in 2022:
Seabrook:
$126,122
Maryland:
$134,708
Number of families with income < $10k:
Seabrook:
10.9% (39)
Maryland:
1.6% (13,064)
Number of families with income $30k - 40k:
Seabrook:
4.3% (15)
Maryland:
3.3% (26,886)
Number of families with income $50k - 60k:
Seabrook:
1.5% (5)
Maryland:
4.1% (33,120)
Number of families with income $60k - 75k:
Seabrook:
6.7% (24)
State:
6.6% (53,501)
Number of families with income $75k - 100k:
Seabrook:
7.7% (27)
Maryland:
11.3% (91,779)
Number of families with income $100k - 125k:
Seabrook:
30.9% (109)
State:
11.3% (91,483)
Number of families with income $125k - 150k:
Seabrook:
4.8% (17)
Maryland:
9.9% (80,832)
Number of families with income $150k - 200k:
Seabrook:
8.5% (30)
Maryland:
16.0% (130,295)
Number of families with income > $200k:
Seabrook:
24.8% (87)
State:
28.1% (228,324)
Median non-family income in Seabrook in 2022:
Seabrook:
$85,180
State:
$61,991
Change in median non-family income between 2000 and 2022:
Seabrook, Maryland:
+117.5%
State:
+76.8%
Median per capita income in Seabrook in 2022:
Seabrook:
$56,368
State:
$59,750
Change in median per capita income between 2000 and 2022:
Seabrook, Maryland:
+105.1%
State:
+104.5%
Income statistics for Black or African American residents
Median household income in Seabrook, MD in 2022:
Seabrook:
$93,647
State:
$77,368
Change in median household income between 2000 and 2022:
Seabrook, Maryland:
+73.6%
State:
+85.7%
Number of households with income < $10k:
Seabrook:
2.5% (99)
State:
7.0% (50,093)
Number of households with income $10k - 20k:
Seabrook:
6.2% (244)
State:
7.2% (51,849)
Number of households with income $20k - 30k:
Seabrook:
2.2% (87)
State:
5.8% (41,510)
Number of households with income $30k - 40k:
Seabrook:
5.9% (233)
State:
6.9% (49,466)
Number of households with income $40k - 50k:
Seabrook:
4.7% (184)
State:
6.6% (47,557)
Number of households with income $50k - 60k:
Seabrook:
4.5% (175)
Maryland:
6.2% (44,818)
Number of households with income $60k - 75k:
Seabrook:
12.5% (489)
State:
8.6% (61,728)
Number of households with income $75k - 100k:
Seabrook:
15.8% (619)
Maryland:
13.2% (95,107)
Number of households with income $100k - 125k:
Seabrook:
18.4% (722)
State:
10.2% (73,579)
Number of households with income $125k - 150k:
Seabrook:
8.7% (341)
Maryland:
7.2% (51,970)
Number of households with income $150k - 200k:
Seabrook:
11.0% (430)
Maryland:
9.4% (67,623)
Number of households with income > $200k:
Seabrook:
7.6% (299)
State:
11.7% (83,862)
Aggregate household income in Seabrook in 2022: $408,087,515
Median family income in Seabrook in 2022:
Seabrook:
$85,574
State:
$96,241
Number of families with income < $10k:
Seabrook:
2.9% (90)
State:
4.5% (19,574)
Number of families with income $10k - 20k:
Seabrook:
5.0% (152)
State:
3.8% (16,604)
Number of families with income $20k - 30k:
Seabrook:
1.2% (35)
State:
4.3% (18,629)
Number of families with income $30k - 40k:
Seabrook:
5.7% (175)
State:
6.1% (26,770)
Number of families with income $40k - 50k:
Seabrook:
9.0% (275)
State:
6.2% (27,138)
Number of families with income $50k - 60k:
Seabrook:
3.3% (100)
State:
5.9% (25,636)
Number of families with income $60k - 75k:
Seabrook:
13.8% (423)
Maryland:
8.0% (35,163)
Number of families with income $75k - 100k:
Seabrook:
14.2% (434)
Maryland:
12.8% (55,976)
Number of families with income $100k - 125k:
Seabrook:
16.9% (518)
Maryland:
11.4% (49,778)
Number of families with income $125k - 150k:
Seabrook:
9.2% (280)
State:
8.8% (38,547)
Number of families with income $150k - 200k:
Seabrook:
9.9% (303)
State:
11.8% (51,381)
Number of families with income > $200k:
Seabrook:
8.9% (271)
State:
16.5% (71,997)
Median non-family income in Seabrook in 2022:
Seabrook:
$71,111
State:
$49,944
Change in median non-family income between 2000 and 2022:
Seabrook, Maryland:
+90.6%
Maryland:
+71.8%
Median per capita income in Seabrook in 2022:
Seabrook:
$37,145
State:
$40,756
Change in median per capita income between 2000 and 2022:
Seabrook, Maryland:
+63.7%
State:
+113.5%
Income statistics for Asian residents
Median household income in Seabrook, MD in 2022:
Seabrook:
$87,815
State:
$117,771
Change in median household income between 2000 and 2022:
Seabrook, Maryland:
+62.0%
State:
+97.6%
Number of households with income < $10k:
Seabrook:
3.4% (15)
Maryland:
4.6% (6,395)
Number of households with income $10k - 20k:
Seabrook:
0.0% (0)
State:
3.6% (4,994)
Number of households with income $20k - 30k:
Seabrook:
6.0% (26)
State:
4.6% (6,399)
Number of households with income $30k - 40k:
Seabrook:
19.8% (86)
Maryland:
3.4% (4,682)
Number of households with income $40k - 50k:
Seabrook:
4.4% (19)
State:
4.6% (6,382)
Number of households with income $50k - 60k:
Seabrook:
0.0% (0)
State:
4.6% (6,402)
Number of households with income $60k - 75k:
Seabrook:
3.4% (15)
Maryland:
5.4% (7,426)
Number of households with income $75k - 100k:
Seabrook:
21.4% (93)
State:
11.1% (15,313)
Number of households with income $100k - 125k:
Seabrook:
9.4% (41)
State:
10.6% (14,640)
Number of households with income $125k - 150k:
Seabrook:
16.8% (73)
State:
8.3% (11,465)
Number of households with income $150k - 200k:
Seabrook:
4.6% (20)
State:
13.4% (18,490)
Number of households with income > $200k:
Seabrook:
10.8% (47)
State:
25.6% (35,377)
Aggregate household income in Seabrook in 2022: $47,988,555
Median family income in Seabrook in 2022:
Seabrook:
$86,871
State:
$137,857
Number of families with income < $10k:
Seabrook:
6.6% (23)
State:
2.7% (2,888)
Number of families with income $20k - 30k:
Seabrook:
5.7% (20)
State:
3.3% (3,499)
Number of families with income $30k - 40k:
Seabrook:
10.4% (37)
State:
2.4% (2,563)
Number of families with income $40k - 50k:
Seabrook:
5.1% (18)
Maryland:
4.1% (4,351)
Number of families with income $60k - 75k:
Seabrook:
2.3% (8)
State:
4.5% (4,749)
Number of families with income $75k - 100k:
Seabrook:
20.5% (72)
Maryland:
10.9% (11,658)
Number of families with income $100k - 125k:
Seabrook:
13.9% (49)
State:
10.6% (11,243)
Number of families with income $125k - 150k:
Seabrook:
19.8% (70)
State:
9.2% (9,834)
Number of families with income $150k - 200k:
Seabrook:
5.5% (19)
State:
15.2% (16,182)
Number of families with income > $200k:
Seabrook:
10.1% (36)
State:
30.3% (32,297)
Median non-family income in Seabrook in 2022:
Seabrook:
$117,235
State:
$62,510
Median per capita income in Seabrook in 2022:
Seabrook:
$34,733
Maryland:
$53,546
Change in median per capita income between 2000 and 2022:
Seabrook, Maryland:
+75.6%
Maryland:
+122.9%
Income statistics for Hispanic or Latino residents
Median household income in Seabrook, MD in 2022:
Seabrook:
$89,769
State:
$82,138
Change in median household income between 2000 and 2022:
Seabrook, Maryland:
+98.6%
State:
+70.2%
Number of households with income < $10k:
Seabrook:
2.9% (27)
State:
3.7% (6,871)
Number of households with income $10k - 20k:
Seabrook:
1.9% (18)
Maryland:
2.9% (5,465)
Number of households with income $20k - 30k:
Seabrook:
0.0% (0)
Maryland:
5.9% (11,012)
Number of households with income $30k - 40k:
Seabrook:
5.4% (50)
State:
7.9% (14,668)
Number of households with income $40k - 50k:
Seabrook:
14.4% (134)
State:
7.6% (14,074)
Number of households with income $50k - 60k:
Seabrook:
12.2% (114)
State:
7.6% (14,166)
Number of households with income $60k - 75k:
Seabrook:
12.1% (113)
State:
9.9% (18,486)
Number of households with income $75k - 100k:
Seabrook:
11.4% (106)
State:
16.1% (30,032)
Number of households with income $100k - 125k:
Seabrook:
11.7% (109)
State:
9.4% (17,432)
Number of households with income $125k - 150k:
Seabrook:
6.5% (61)
State:
7.5% (13,963)
Number of households with income $150k - 200k:
Seabrook:
12.8% (119)
Maryland:
10.1% (18,750)
Number of households with income > $200k:
Seabrook:
8.8% (82)
State:
11.4% (21,133)
Aggregate household income in Seabrook in 2022: $95,160,061
Median family income in Seabrook in 2022:
Seabrook:
$71,278
State:
$80,127
Number of families with income < $10k:
Seabrook:
3.7% (31)
Maryland:
3.1% (4,499)
Number of families with income $10k - 20k:
Seabrook:
1.0% (8)
State:
2.2% (3,250)
Number of families with income $30k - 40k:
Seabrook:
14.9% (126)
Maryland:
7.6% (11,123)
Number of families with income $40k - 50k:
Seabrook:
8.3% (70)
Maryland:
8.1% (11,900)
Number of families with income $50k - 60k:
Seabrook:
8.3% (70)
Maryland:
8.5% (12,561)
Number of families with income $60k - 75k:
Seabrook:
17.7% (150)
Maryland:
10.2% (15,051)
Number of families with income $75k - 100k:
Seabrook:
7.3% (61)
State:
14.6% (21,440)
Number of families with income $100k - 125k:
Seabrook:
13.7% (116)
State:
9.6% (14,146)
Number of families with income $125k - 150k:
Seabrook:
6.6% (55)
State:
6.9% (10,202)
Number of families with income $150k - 200k:
Seabrook:
7.5% (63)
State:
10.7% (15,752)
Number of families with income > $200k:
Seabrook:
11.1% (93)
Maryland:
11.6% (17,028)
Median non-family income in Seabrook in 2022:
Seabrook:
$50,190
Maryland:
$55,347
Change in median non-family income between 2000 and 2022:
Seabrook, Maryland:
+42.3%
Maryland:
+61.9%
Median per capita income in Seabrook in 2022:
Seabrook:
$20,553
State:
$29,024
Change in median per capita income between 2000 and 2022:
Seabrook, Maryland:
+55.7%
State:
+79.2%
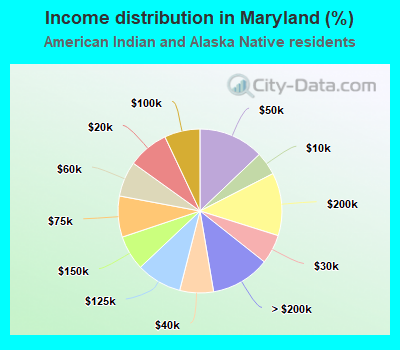
Income statistics for American Indian and Alaska Native residents
Number of households with income < $10k:
Seabrook:
0.0% (0)
State:
4.6% (360)
Number of households with income $10k - 20k:
Seabrook:
0.0% (0)
State:
8.1% (632)
Number of households with income $20k - 30k:
Seabrook:
0.0% (0)
Maryland:
5.8% (454)
Number of households with income $30k - 40k:
Seabrook:
68.7% (68)
Maryland:
6.7% (522)
Number of households with income $40k - 50k:
Seabrook:
0.0% (0)
State:
12.9% (1,010)
Number of households with income $50k - 60k:
Seabrook:
0.0% (0)
State:
7.0% (546)
Number of households with income $60k - 75k:
Seabrook:
0.0% (0)
Maryland:
8.1% (635)
Number of households with income $75k - 100k:
Seabrook:
0.0% (0)
State:
7.0% (551)
Number of households with income $100k - 125k:
Seabrook:
0.0% (0)
Maryland:
9.0% (702)
Number of households with income $125k - 150k:
Seabrook:
31.3% (31)
Maryland:
6.9% (541)
Number of households with income $150k - 200k:
Seabrook:
0.0% (0)
Maryland:
12.4% (972)
Number of households with income > $200k:
Seabrook:
0.0% (0)
Maryland:
11.7% (916)
Aggregate household income in Seabrook in 2022: $202,100,400
Median per capita income in Seabrook in 2022:
Seabrook:
$49,706
State:
$35,089
Change in median per capita income between 2000 and 2022:
Seabrook, Maryland:
+133.9%
State:
+56.2%
Income statistics for Multirace residents
Median household income in Seabrook, MD in 2022:
Seabrook:
$107,569
Maryland:
$99,027
Change in median household income between 2000 and 2022:
Seabrook, Maryland:
+124.9%
State:
+111.4%
Number of households with income < $10k:
Seabrook:
16.0% (65)
State:
4.8% (6,469)
Number of households with income $10k - 20k:
Seabrook:
0.7% (3)
Maryland:
3.3% (4,464)
Number of households with income $20k - 30k:
Seabrook:
0.0% (0)
State:
5.8% (7,826)
Number of households with income $30k - 40k:
Seabrook:
0.0% (0)
Maryland:
8.1% (11,077)
Number of households with income $40k - 50k:
Seabrook:
23.1% (94)
State:
4.3% (5,895)
Number of households with income $50k - 60k:
Seabrook:
0.0% (0)
State:
3.9% (5,346)
Number of households with income $60k - 75k:
Seabrook:
0.0% (0)
State:
6.7% (9,159)
Number of households with income $75k - 100k:
Seabrook:
9.6% (39)
State:
13.6% (18,420)
Number of households with income $100k - 125k:
Seabrook:
16.5% (67)
Maryland:
12.9% (17,488)
Number of households with income $125k - 150k:
Seabrook:
0.0% (0)
State:
8.1% (11,039)
Number of households with income $150k - 200k:
Seabrook:
15.7% (64)
State:
11.5% (15,675)
Number of households with income > $200k:
Seabrook:
18.4% (75)
Maryland:
17.0% (23,059)
Aggregate household income in Seabrook in 2022: $45,683,083
Median family income in Seabrook in 2022:
Seabrook:
$147,552
State:
$110,784
Number of families with income $40k - 50k:
Seabrook:
18.3% (52)
Maryland:
3.6% (3,426)
Number of families with income $60k - 75k:
Seabrook:
4.8% (14)
Maryland:
6.5% (6,128)
Number of families with income $75k - 100k:
Seabrook:
1.0% (3)
Maryland:
11.7% (11,110)
Number of families with income $100k - 125k:
Seabrook:
31.4% (89)
State:
13.2% (12,548)
Number of families with income $150k - 200k:
Seabrook:
15.0% (43)
State:
13.6% (12,921)
Number of families with income > $200k:
Seabrook:
29.4% (84)
Maryland:
20.9% (19,875)
Median per capita income in Seabrook in 2022:
Seabrook:
$25,163
State:
$35,630
Change in median per capita income between 2000 and 2022:
Seabrook, Maryland:
+55.1%
State:
+125.1%
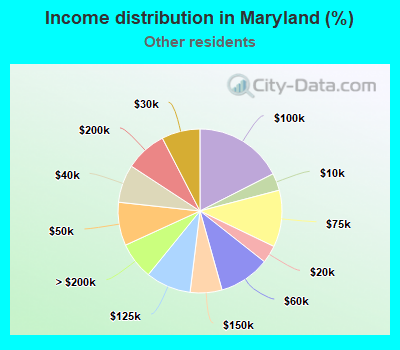
Income statistics for other residents
Median household income in Seabrook, MD in 2022:
Seabrook:
$65,632
Maryland:
$72,980
Number of households with income < $10k:
Seabrook:
5.4% (31)
State:
3.4% (3,746)
Number of households with income $10k - 20k:
Seabrook:
2.8% (16)
Maryland:
3.5% (3,842)
Number of households with income $20k - 30k:
Seabrook:
0.0% (0)
Maryland:
7.6% (8,343)
Number of households with income $30k - 40k:
Seabrook:
2.1% (12)
Maryland:
7.5% (8,251)
Number of households with income $40k - 50k:
Seabrook:
7.6% (44)
State:
8.6% (9,414)
Number of households with income $50k - 60k:
Seabrook:
20.1% (116)
State:
10.0% (11,048)
Number of households with income $60k - 75k:
Seabrook:
21.6% (125)
State:
11.2% (12,339)
Number of households with income $75k - 100k:
Seabrook:
10.9% (63)
State:
17.5% (19,277)
Number of households with income $100k - 125k:
Seabrook:
9.0% (52)
State:
8.9% (9,813)
Number of households with income $125k - 150k:
Seabrook:
4.7% (27)
Maryland:
6.3% (6,907)
Number of households with income $150k - 200k:
Seabrook:
12.5% (72)
Maryland:
8.2% (9,023)
Number of households with income > $200k:
Seabrook:
3.5% (20)
State:
7.3% (8,036)
Aggregate household income in Seabrook in 2022: $48,256,828
Median family income in Seabrook in 2022:
Seabrook:
$59,632
State:
$69,179
Number of families with income < $10k:
Seabrook:
4.0% (23)
Maryland:
3.0% (2,713)
Number of families with income $10k - 20k:
Seabrook:
2.0% (12)
Maryland:
2.8% (2,505)
Number of families with income $30k - 40k:
Seabrook:
15.0% (86)
State:
7.3% (6,474)
Number of families with income $40k - 50k:
Seabrook:
11.2% (64)
State:
10.0% (8,917)
Number of families with income $50k - 60k:
Seabrook:
14.1% (81)
State:
11.3% (10,043)
Number of families with income $60k - 75k:
Seabrook:
18.6% (107)
Maryland:
11.0% (9,850)
Number of families with income $75k - 100k:
Seabrook:
10.2% (59)
State:
15.9% (14,199)
Number of families with income $100k - 125k:
Seabrook:
11.0% (63)
State:
8.6% (7,698)
Number of families with income $125k - 150k:
Seabrook:
4.2% (24)
State:
6.0% (5,327)
Number of families with income $150k - 200k:
Seabrook:
5.4% (31)
State:
7.9% (7,065)
Number of families with income > $200k:
Seabrook:
4.2% (24)
Maryland:
6.7% (6,005)
Median per capita income in Seabrook in 2022:
Seabrook:
$17,220
State:
$24,415
Change in median per capita income between 2000 and 2022:
Seabrook, Maryland:
+32.9%
State:
+73.6%
Discuss Seabrook, Maryland (MD) on our hugely popular Maryland forum.