The median household income in Schiller Park, IL in 2022 was $64,455, which was 19.0% less than the median annual income of $76,708 across the entire state of Illinois. Compared to the median income of $41,583 in 2000 this represents an increase of 35.5%. The per capita income in 2022 was $30,079, which means an increase of 40.9% compared to 2000 when it was $17,781.
Whole page based on the data from 2000 / 2022 when the population of Schiller Park, Illinois was 11,850 / 11,342
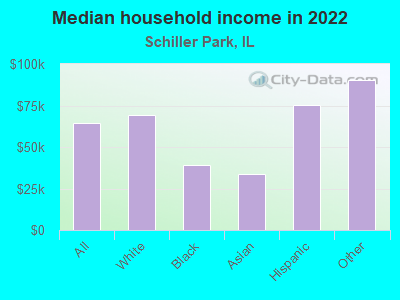
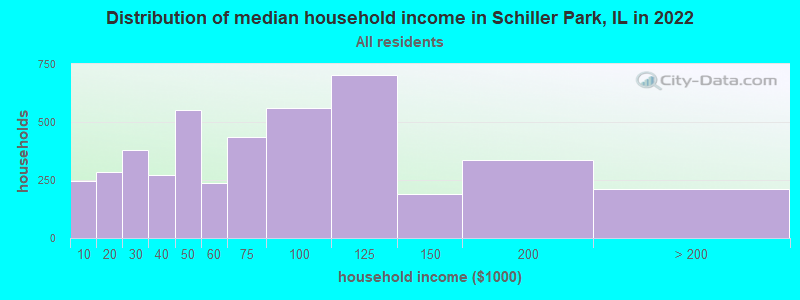
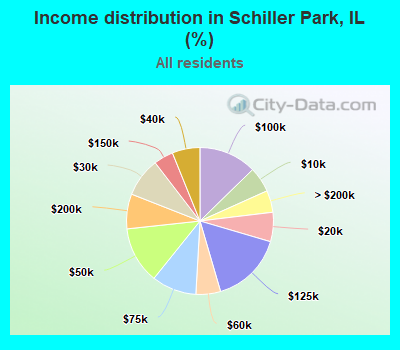
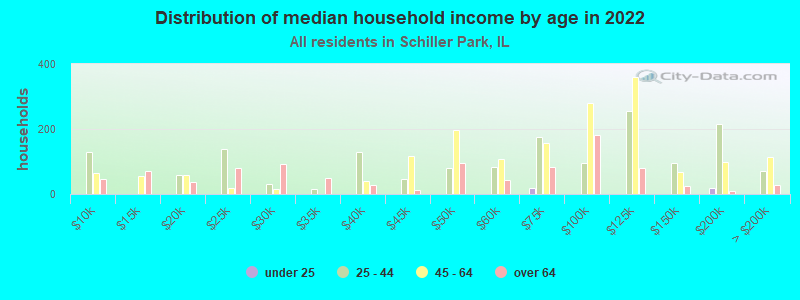
Income statistics for all residents
Median household income in Schiller Park, IL in 2022:
Schiller Park:
$64,456
Illinois:
$76,708
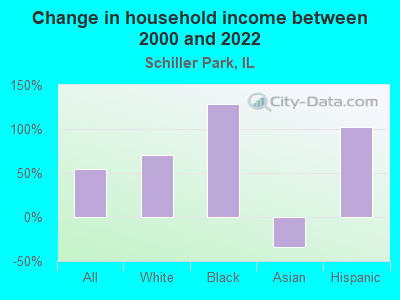
Change in median household income between 2000 and 2022:
Schiller Park, Illinois:
+55.0%
Illinois:
+64.6%
Number of households with income < $10k:
Schiller Park:
5.6% (246)
Illinois:
5.9% (296,090)
Number of households with income $10k - 20k:
Schiller Park:
6.4% (284)
State:
6.6% (333,259)
Number of households with income $20k - 30k:
Schiller Park:
8.6% (380)
Illinois:
6.8% (342,921)
Number of households with income $30k - 40k:
Schiller Park:
6.1% (270)
State:
7.0% (355,254)
Number of households with income $40k - 50k:
Schiller Park:
12.5% (552)
State:
6.7% (340,678)
Number of households with income $50k - 60k:
Schiller Park:
5.4% (239)
State:
6.7% (339,405)
Number of households with income $60k - 75k:
Schiller Park:
9.9% (435)
State:
9.2% (465,709)
Number of households with income $75k - 100k:
Schiller Park:
12.7% (560)
Illinois:
12.9% (651,353)
Number of households with income $100k - 125k:
Schiller Park:
15.9% (703)
Illinois:
10.3% (522,359)
Number of households with income $125k - 150k:
Schiller Park:
4.3% (190)
State:
7.3% (367,136)
Number of households with income $150k - 200k:
Schiller Park:
7.7% (338)
Illinois:
9.0% (455,249)
Number of households with income > $200k:
Schiller Park:
4.8% (213)
State:
11.6% (586,947)
Aggregate household income in Schiller Park in 2022: $347,118,813
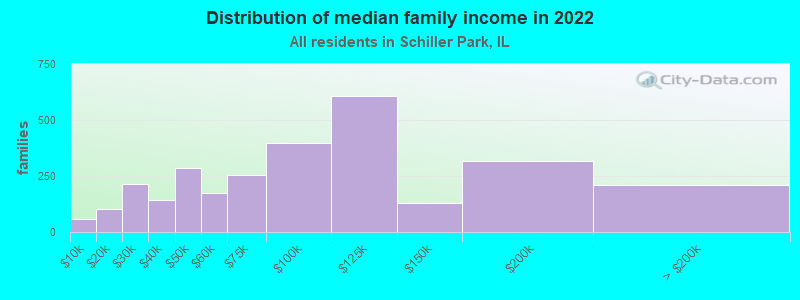
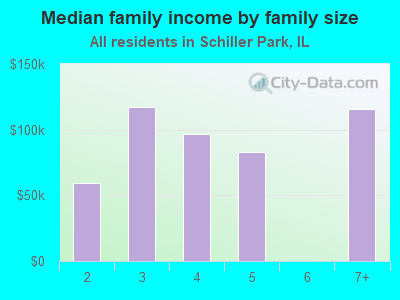
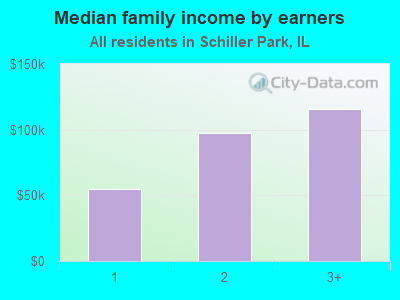
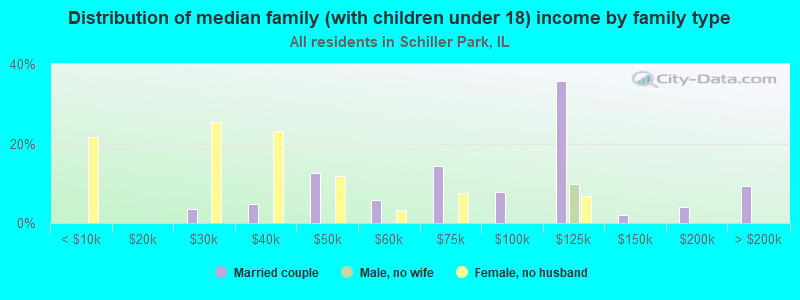
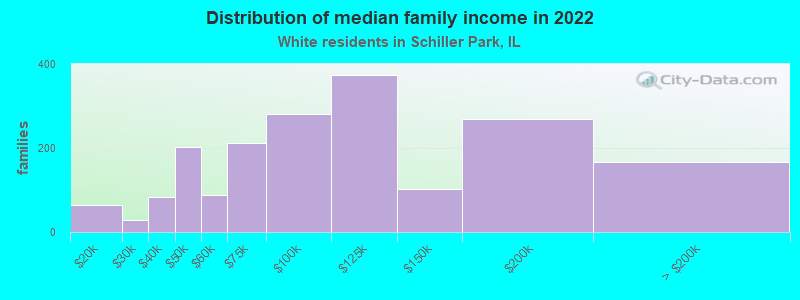
Median family income in Schiller Park in 2022:
Schiller Park:
$90,435
State:
$96,948
Number of families with income < $10k:
Schiller Park:
2.0% (57)
State:
3.4% (105,875)
Number of families with income $10k - 20k:
Schiller Park:
3.5% (101)
State:
3.3% (105,017)
Number of families with income $20k - 30k:
Schiller Park:
7.3% (213)
Illinois:
4.7% (146,403)
Number of families with income $30k - 40k:
Schiller Park:
5.0% (145)
State:
5.3% (167,069)
Number of families with income $40k - 50k:
Schiller Park:
9.9% (286)
State:
5.8% (181,164)
Number of families with income $50k - 60k:
Schiller Park:
6.1% (176)
State:
6.1% (191,561)
Number of families with income $60k - 75k:
Schiller Park:
8.7% (253)
State:
9.0% (282,985)
Number of families with income $75k - 100k:
Schiller Park:
13.8% (398)
State:
13.8% (432,725)
Number of families with income $100k - 125k:
Schiller Park:
21.0% (609)
State:
11.9% (373,296)
Number of families with income $125k - 150k:
Schiller Park:
4.5% (130)
State:
8.9% (279,791)
Number of families with income $150k - 200k:
Schiller Park:
10.9% (317)
State:
11.9% (372,004)
Number of families with income > $200k:
Schiller Park:
7.3% (212)
State:
15.9% (500,033)
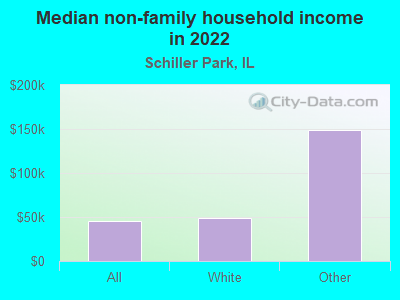
Median non-family income in Schiller Park in 2022:
Schiller Park:
$44,993
State:
$46,533
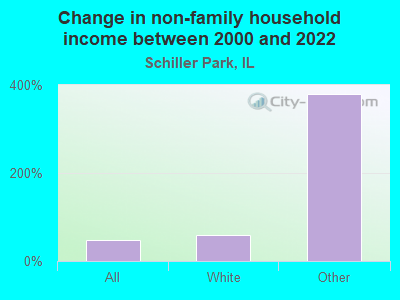
Change in median non-family income between 2000 and 2022:
Schiller Park, Illinois:
+46.8%
Illinois:
+64.0%
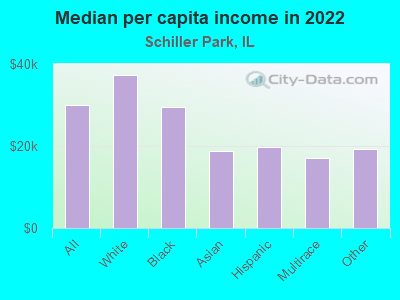
Median per capita income in Schiller Park in 2022:
Schiller Park:
$30,079
State:
$43,317
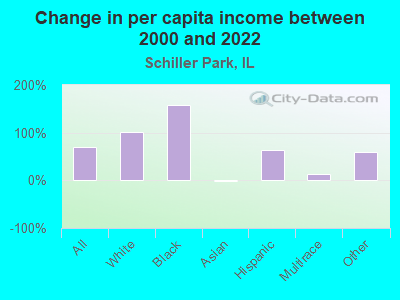
Change in median per capita income between 2000 and 2022:
Schiller Park, Illinois:
+69.2%
State:
+87.5%
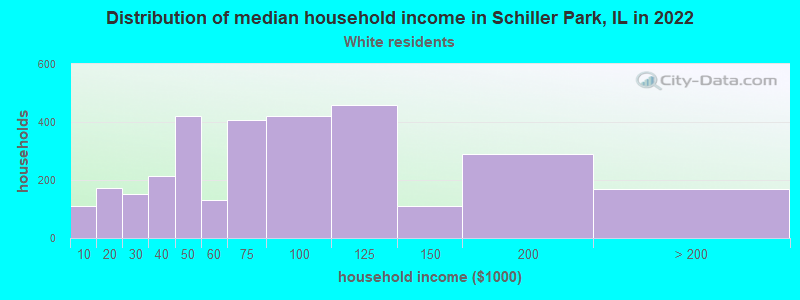
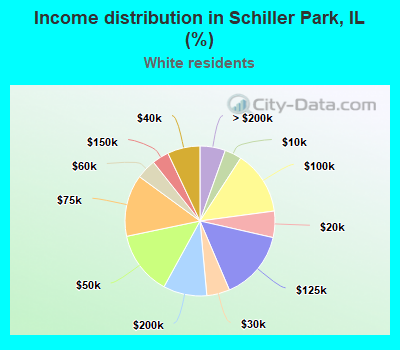
Income statistics for White residents
Median household income in Schiller Park, IL in 2022:
Schiller Park:
$69,120
Illinois:
$83,346
Change in median household income between 2000 and 2022:
Schiller Park, Illinois:
+70.0%
State:
+67.5%
Number of households with income < $10k:
Schiller Park:
3.7% (112)
State:
4.5% (149,895)
Number of households with income $10k - 20k:
Schiller Park:
5.7% (174)
Illinois:
5.5% (184,529)
Number of households with income $20k - 30k:
Schiller Park:
5.0% (152)
State:
6.1% (205,767)
Number of households with income $30k - 40k:
Schiller Park:
7.0% (215)
Illinois:
6.7% (225,572)
Number of households with income $40k - 50k:
Schiller Park:
13.8% (421)
Illinois:
6.5% (216,965)
Number of households with income $50k - 60k:
Schiller Park:
4.3% (131)
Illinois:
6.6% (222,841)
Number of households with income $60k - 75k:
Schiller Park:
13.3% (408)
State:
9.3% (312,758)
Number of households with income $75k - 100k:
Schiller Park:
13.7% (420)
State:
12.9% (433,180)
Number of households with income $100k - 125k:
Schiller Park:
15.0% (460)
State:
10.7% (360,753)
Number of households with income $125k - 150k:
Schiller Park:
3.6% (111)
State:
7.9% (266,532)
Number of households with income $150k - 200k:
Schiller Park:
9.4% (288)
State:
10.0% (337,357)
Number of households with income > $200k:
Schiller Park:
5.5% (168)
State:
13.3% (446,069)
Aggregate household income in Schiller Park in 2022: $260,512,982
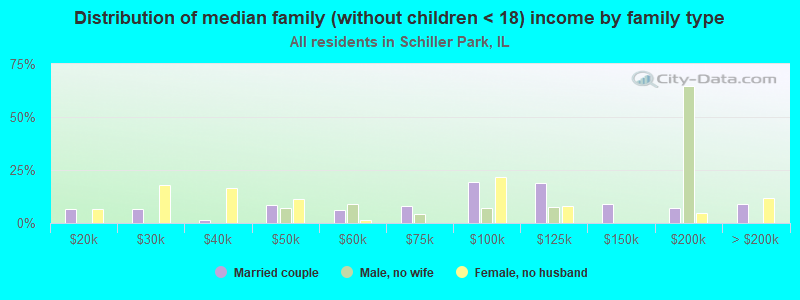
Median family income in Schiller Park in 2022:
Schiller Park:
$96,345
State:
$107,938
Number of families with income $10k - 20k:
Schiller Park:
3.4% (65)
State:
2.5% (50,574)
Number of families with income $20k - 30k:
Schiller Park:
1.6% (29)
State:
3.5% (70,927)
Number of families with income $30k - 40k:
Schiller Park:
4.5% (84)
State:
4.4% (90,563)
Number of families with income $40k - 50k:
Schiller Park:
10.9% (203)
State:
5.0% (102,597)
Number of families with income $50k - 60k:
Schiller Park:
4.7% (87)
Illinois:
5.8% (119,129)
Number of families with income $60k - 75k:
Schiller Park:
11.3% (211)
Illinois:
8.8% (179,665)
Number of families with income $75k - 100k:
Schiller Park:
15.0% (281)
Illinois:
13.5% (276,887)
Number of families with income $100k - 125k:
Schiller Park:
20.0% (374)
State:
12.5% (256,099)
Number of families with income $125k - 150k:
Schiller Park:
5.5% (102)
State:
9.8% (199,855)
Number of families with income $150k - 200k:
Schiller Park:
14.3% (268)
State:
13.4% (274,569)
Number of families with income > $200k:
Schiller Park:
8.9% (167)
State:
18.6% (381,354)
Median non-family income in Schiller Park in 2022:
Schiller Park:
$48,748
State:
$50,934
Change in median non-family income between 2000 and 2022:
Schiller Park, Illinois:
+58.8%
State:
+70.7%
Median per capita income in Schiller Park in 2022:
Schiller Park:
$37,325
Illinois:
$50,738
Change in median per capita income between 2000 and 2022:
Schiller Park, Illinois:
+101.2%
Illinois:
+95.5%
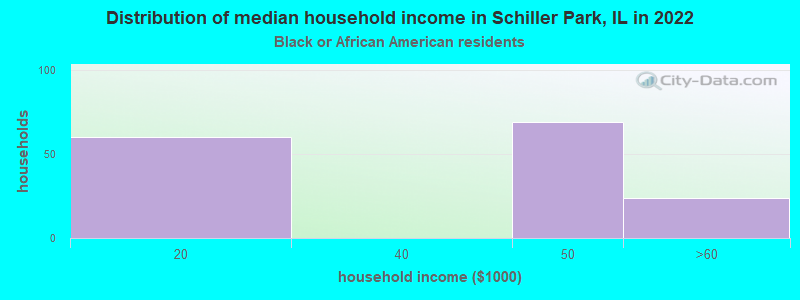
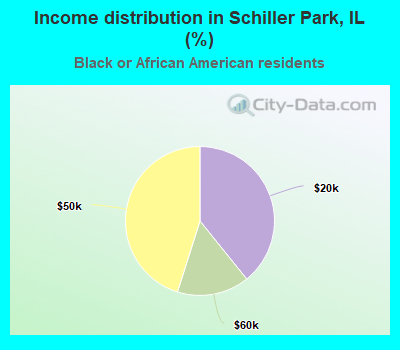
Income statistics for Black or African American residents
Median household income in Schiller Park, IL in 2022:
Schiller Park:
$39,427
State:
$45,019
Change in median household income between 2000 and 2022:
Schiller Park, Illinois:
+127.6%
Illinois:
+42.0%
Number of households with income < $10k:
Schiller Park:
0.0% (0)
State:
13.3% (92,224)
Number of households with income $10k - 20k:
Schiller Park:
39.2% (60)
State:
13.5% (93,732)
Number of households with income $20k - 30k:
Schiller Park:
0.0% (0)
State:
9.9% (68,453)
Number of households with income $30k - 40k:
Schiller Park:
0.0% (0)
Illinois:
8.5% (59,072)
Number of households with income $40k - 50k:
Schiller Park:
45.1% (69)
Illinois:
7.9% (55,033)
Number of households with income $50k - 60k:
Schiller Park:
15.7% (24)
State:
7.2% (49,556)
Number of households with income $60k - 75k:
Schiller Park:
0.0% (0)
State:
7.8% (53,726)
Number of households with income $75k - 100k:
Schiller Park:
0.0% (0)
Illinois:
11.6% (80,439)
Number of households with income $100k - 125k:
Schiller Park:
0.0% (0)
State:
7.5% (52,244)
Number of households with income $125k - 150k:
Schiller Park:
0.0% (0)
Illinois:
3.9% (27,058)
Number of households with income $150k - 200k:
Schiller Park:
0.0% (0)
State:
4.6% (32,057)
Number of households with income > $200k:
Schiller Park:
0.0% (0)
State:
4.1% (28,731)
Aggregate household income in Schiller Park in 2022: $4,698,958
Median per capita income in Schiller Park in 2022:
Schiller Park:
$29,449
State:
$28,045
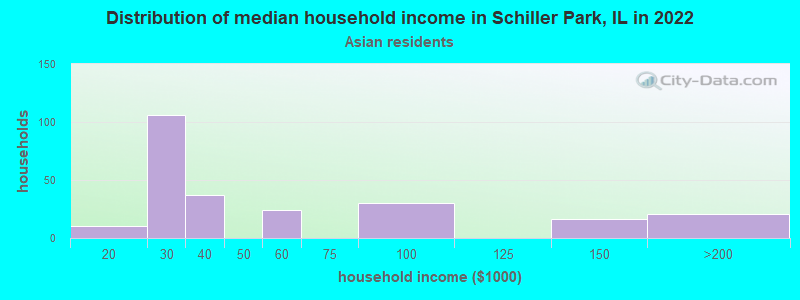
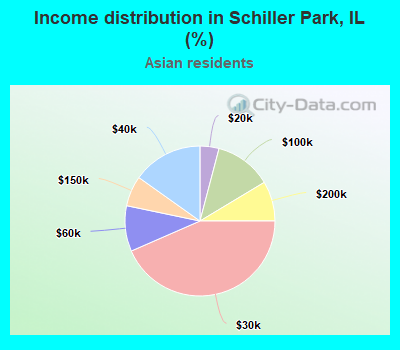
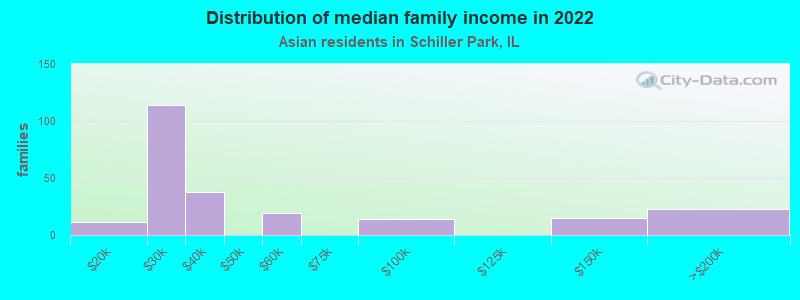
Income statistics for Asian residents
Median household income in Schiller Park, IL in 2022:
Schiller Park:
$33,708
State:
$104,287
Change in median household income between 2000 and 2022:: -33.7%
Schiller Park, Illinois:
-33.7%
Illinois:
+81.9%
Number of households with income < $10k:
Schiller Park:
0.0% (0)
State:
5.3% (14,653)
Number of households with income $10k - 20k:
Schiller Park:
4.1% (10)
State:
4.5% (12,283)
Number of households with income $20k - 30k:
Schiller Park:
43.4% (106)
State:
4.8% (13,135)
Number of households with income $30k - 40k:
Schiller Park:
15.2% (37)
State:
5.0% (13,655)
Number of households with income $40k - 50k:
Schiller Park:
0.0% (0)
State:
4.5% (12,357)
Number of households with income $50k - 60k:
Schiller Park:
9.8% (24)
State:
4.9% (13,568)
Number of households with income $60k - 75k:
Schiller Park:
0.0% (0)
State:
7.1% (19,606)
Number of households with income $75k - 100k:
Schiller Park:
12.3% (30)
State:
12.1% (33,349)
Number of households with income $100k - 125k:
Schiller Park:
0.0% (0)
State:
9.7% (26,669)
Number of households with income $125k - 150k:
Schiller Park:
6.6% (16)
Illinois:
7.3% (20,172)
Number of households with income $150k - 200k:
Schiller Park:
8.6% (21)
State:
11.5% (31,711)
Number of households with income > $200k:
Schiller Park:
0.0% (0)
Illinois:
23.1% (63,411)
Aggregate household income in Schiller Park in 2022: $13,887,414
Median family income in Schiller Park in 2022:
Schiller Park:
$28,990
State:
$124,630
Number of families with income $10k - 20k:
Schiller Park:
4.6% (11)
State:
2.6% (5,077)
Number of families with income $20k - 30k:
Schiller Park:
48.7% (114)
State:
4.4% (8,618)
Number of families with income $30k - 40k:
Schiller Park:
16.3% (38)
Illinois:
4.4% (8,628)
Number of families with income $50k - 60k:
Schiller Park:
8.2% (19)
State:
4.1% (7,974)
Number of families with income $75k - 100k:
Schiller Park:
5.9% (14)
Illinois:
12.3% (24,156)
Number of families with income $125k - 150k:
Schiller Park:
6.5% (15)
Illinois:
8.0% (15,639)
Number of families with income $150k - 200k:
Schiller Park:
9.8% (23)
State:
13.9% (27,222)
Median per capita income in Schiller Park in 2022:
Schiller Park:
$18,849
Illinois:
$52,977
Change in median per capita income between 2000 and 2022:: -1.6%
Schiller Park, Illinois:
-1.6%
Illinois:
+119.5%
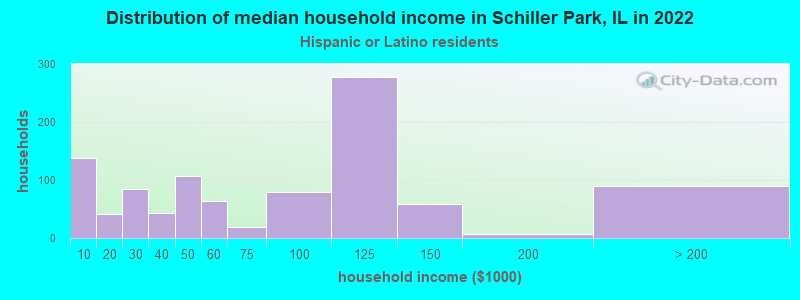
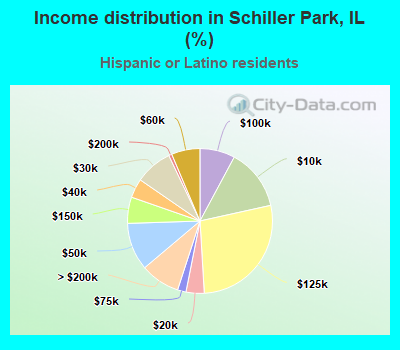
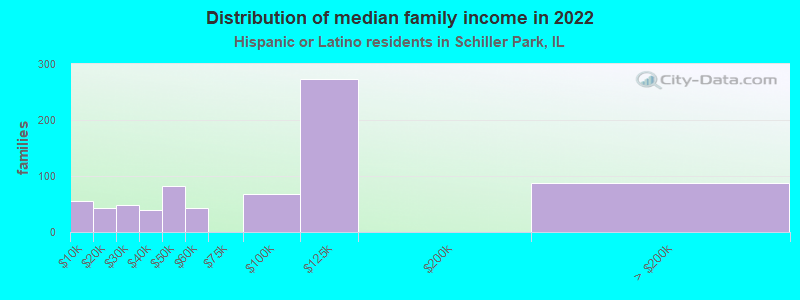
Income statistics for Hispanic or Latino residents
Median household income in Schiller Park, IL in 2022:
Schiller Park:
$75,453
State:
$72,139
Change in median household income between 2000 and 2022:
Schiller Park, Illinois:
+101.6%
State:
+75.7%
Number of households with income < $10k:
Schiller Park:
13.7% (138)
State:
4.9% (33,145)
Number of households with income $10k - 20k:
Schiller Park:
4.1% (41)
Illinois:
5.4% (36,345)
Number of households with income $20k - 30k:
Schiller Park:
8.3% (84)
Illinois:
7.5% (50,677)
Number of households with income $30k - 40k:
Schiller Park:
4.3% (43)
State:
7.7% (52,008)
Number of households with income $40k - 50k:
Schiller Park:
10.6% (107)
State:
8.1% (54,702)
Number of households with income $50k - 60k:
Schiller Park:
6.4% (64)
State:
7.5% (51,062)
Number of households with income $60k - 75k:
Schiller Park:
1.9% (19)
Illinois:
11.3% (76,576)
Number of households with income $75k - 100k:
Schiller Park:
7.8% (79)
Illinois:
15.5% (105,152)
Number of households with income $100k - 125k:
Schiller Park:
27.5% (277)
State:
11.5% (77,760)
Number of households with income $125k - 150k:
Schiller Park:
5.9% (59)
Illinois:
7.3% (49,310)
Number of households with income $150k - 200k:
Schiller Park:
0.7% (7)
State:
7.6% (51,233)
Number of households with income > $200k:
Schiller Park:
8.8% (89)
Illinois:
5.9% (40,028)
Aggregate household income in Schiller Park in 2022: $82,305,294
Median family income in Schiller Park in 2022:
Schiller Park:
$86,237
State:
$76,467
Number of families with income < $10k:
Schiller Park:
7.4% (55)
Illinois:
3.8% (19,330)
Number of families with income $10k - 20k:
Schiller Park:
5.7% (42)
Illinois:
3.8% (19,314)
Number of families with income $20k - 30k:
Schiller Park:
6.5% (48)
State:
6.8% (34,467)
Number of families with income $30k - 40k:
Schiller Park:
5.3% (39)
State:
7.5% (37,976)
Number of families with income $40k - 50k:
Schiller Park:
11.2% (83)
State:
7.7% (38,858)
Number of families with income $50k - 60k:
Schiller Park:
5.9% (43)
Illinois:
7.6% (38,606)
Number of families with income $75k - 100k:
Schiller Park:
9.1% (67)
State:
16.0% (81,055)
Number of families with income $100k - 125k:
Schiller Park:
37.1% (274)
State:
12.1% (61,491)
Number of families with income > $200k:
Schiller Park:
11.9% (88)
State:
6.6% (33,240)
Median per capita income in Schiller Park in 2022:
Schiller Park:
$19,667
State:
$26,551
Change in median per capita income between 2000 and 2022:
Schiller Park, Illinois:
+64.3%
State:
+111.0%
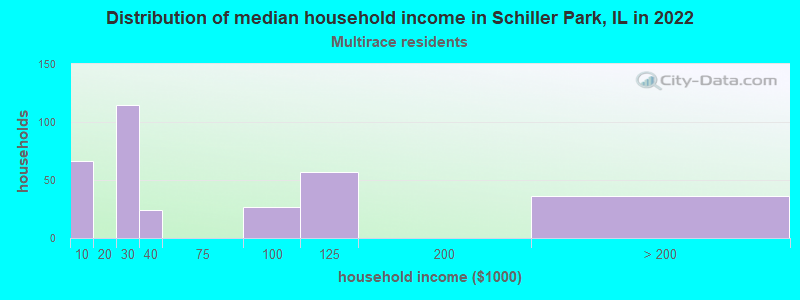
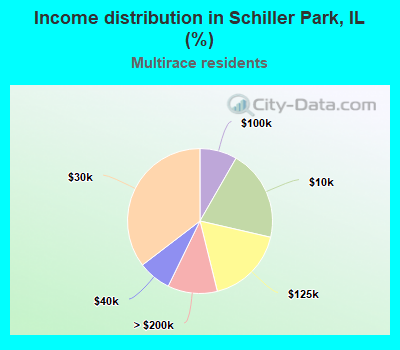
Income statistics for Multirace residents
Number of households with income < $10k:
Schiller Park:
20.3% (66)
State:
5.3% (21,595)
Number of households with income $10k - 20k:
Schiller Park:
0.0% (0)
Illinois:
6.5% (26,720)
Number of households with income $20k - 30k:
Schiller Park:
35.4% (115)
State:
8.0% (32,573)
Number of households with income $30k - 40k:
Schiller Park:
7.4% (24)
Illinois:
8.4% (34,383)
Number of households with income $40k - 50k:
Schiller Park:
0.0% (0)
State:
7.4% (30,234)
Number of households with income $50k - 60k:
Schiller Park:
0.0% (0)
State:
6.9% (28,432)
Number of households with income $60k - 75k:
Schiller Park:
0.0% (0)
Illinois:
10.2% (41,780)
Number of households with income $75k - 100k:
Schiller Park:
8.3% (27)
Illinois:
13.0% (53,426)
Number of households with income $100k - 125k:
Schiller Park:
17.5% (57)
Illinois:
10.5% (43,126)
Number of households with income $125k - 150k:
Schiller Park:
0.0% (0)
State:
7.6% (31,153)
Number of households with income $150k - 200k:
Schiller Park:
0.0% (0)
State:
7.6% (30,946)
Number of households with income > $200k:
Schiller Park:
11.1% (36)
Illinois:
8.6% (35,208)
Aggregate household income in Schiller Park in 2022: $20,088,271
Median per capita income in Schiller Park in 2022:
Schiller Park:
$17,022
State:
$29,285
Change in median per capita income between 2000 and 2022:
Schiller Park, Illinois:
+14.4%
State:
+112.9%
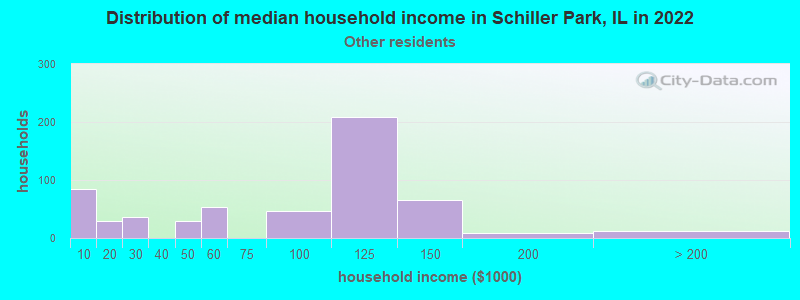
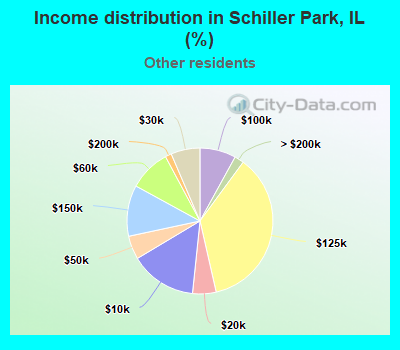
Income statistics for other residents
Median household income in Schiller Park, IL in 2022:
Schiller Park:
$90,607
State:
$71,711
Number of households with income < $10k:
Schiller Park:
14.8% (85)
State:
5.7% (16,383)
Number of households with income $10k - 20k:
Schiller Park:
5.2% (30)
State:
4.8% (13,886)
Number of households with income $20k - 30k:
Schiller Park:
6.4% (37)
Illinois:
7.0% (20,054)
Number of households with income $30k - 40k:
Schiller Park:
0.0% (0)
State:
7.0% (20,038)
Number of households with income $40k - 50k:
Schiller Park:
5.2% (30)
State:
8.3% (23,759)
Number of households with income $50k - 60k:
Schiller Park:
9.2% (53)
State:
7.8% (22,410)
Number of households with income $60k - 75k:
Schiller Park:
0.0% (0)
Illinois:
12.0% (34,448)
Number of households with income $75k - 100k:
Schiller Park:
8.0% (46)
Illinois:
16.2% (46,508)
Number of households with income $100k - 125k:
Schiller Park:
36.3% (209)
Illinois:
12.5% (35,952)
Number of households with income $125k - 150k:
Schiller Park:
11.3% (65)
State:
6.9% (19,732)
Number of households with income $150k - 200k:
Schiller Park:
1.4% (8)
State:
7.5% (21,422)
Number of households with income > $200k:
Schiller Park:
2.1% (12)
State:
4.3% (12,194)
Aggregate household income in Schiller Park in 2022: $44,315,234
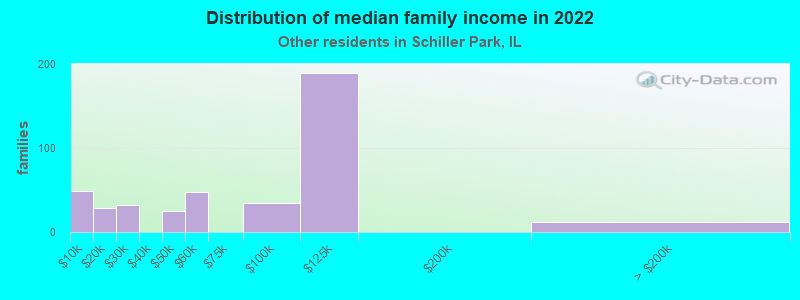
Median family income in Schiller Park in 2022:
Schiller Park:
$82,290
State:
$74,069
Number of families with income < $10k:
Schiller Park:
11.8% (49)
State:
4.1% (9,256)
Number of families with income $10k - 20k:
Schiller Park:
6.8% (28)
State:
3.3% (7,467)
Number of families with income $20k - 30k:
Schiller Park:
7.7% (32)
State:
6.8% (15,193)
Number of families with income $40k - 50k:
Schiller Park:
6.0% (25)
State:
8.1% (18,155)
Number of families with income $50k - 60k:
Schiller Park:
11.5% (48)
State:
7.4% (16,614)
Number of families with income $75k - 100k:
Schiller Park:
8.4% (35)
State:
17.2% (38,560)
Number of families with income $100k - 125k:
Schiller Park:
45.0% (189)
State:
12.3% (27,638)
Number of families with income > $200k:
Schiller Park:
2.8% (12)
State:
4.6% (10,400)
Median non-family income in Schiller Park in 2022:
Schiller Park:
$148,866
State:
$44,975
Median per capita income in Schiller Park in 2022:
Schiller Park:
$19,183
State:
$25,392
Change in median per capita income between 2000 and 2022:
Schiller Park, Illinois:
+60.2%
Illinois:
+117.4%
Discuss Schiller Park, Illinois (IL) on our hugely popular Illinois forum.