San Gorgonio Pass, California (CA) income map, earnings map, and wages data
The median household income in San Gorgonio Pass, CA in 2022 was $67,135, which was 36.4% less than the median annual income of $91,551 across the entire state of California. Compared to the median income of $33,191 in 2000 this represents an increase of 50.6%. The per capita income in 2022 was $32,031, which means an increase of 47.3% compared to 2000 when it was $16,878.
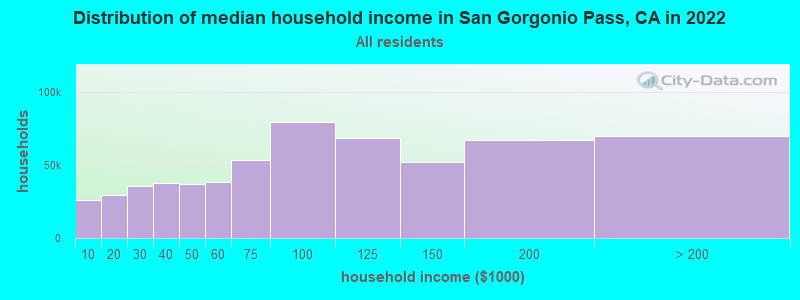
Income statistics for all residents
Median household income in San Gorgonio Pass, CA in 2022:| San Gorgonio Pass: | $67,136 |
| State: | $91,551 |
Change in median household income between 2000 and 2022:| San Gorgonio Pass, California: | +102.3% |
| State: | +92.8% |
Number of households with income < $10k:| San Gorgonio Pass: | 4.4% (26,056) |
| California: | 4.8% (654,370) |
Number of households with income $10k - 20k:| San Gorgonio Pass: | 4.9% (29,467) |
| California: | 5.8% (789,493) |
Number of households with income $20k - 30k:| San Gorgonio Pass: | 6.0% (35,565) |
| State: | 5.7% (778,318) |
Number of households with income $30k - 40k:| San Gorgonio Pass: | 6.3% (37,790) |
| California: | 5.8% (783,170) |
Number of households with income $40k - 50k:| San Gorgonio Pass: | 6.3% (37,323) |
| State: | 5.8% (781,352) |
Number of households with income $50k - 60k:| San Gorgonio Pass: | 6.4% (38,382) |
| State: | 5.6% (760,175) |
Number of households with income $60k - 75k:| San Gorgonio Pass: | 9.0% (53,743) |
| State: | 8.2% (1,104,699) |
Number of households with income $75k - 100k:| San Gorgonio Pass: | 13.4% (79,529) |
| California: | 12.0% (1,627,633) |
Number of households with income $100k - 125k:| San Gorgonio Pass: | 11.5% (68,441) |
| California: | 10.0% (1,358,619) |
Number of households with income $125k - 150k:| San Gorgonio Pass: | 8.8% (52,347) |
| State: | 7.6% (1,027,455) |
Number of households with income $150k - 200k:| San Gorgonio Pass: | 11.2% (66,881) |
| State: | 10.6% (1,439,811) |
Number of households with income > $200k:| San Gorgonio Pass: | 11.8% (69,985) |
| State: | 18.0% (2,445,491) |
Aggregate household income in San Gorgonio Pass in 2022: $34,421,244,911
Median family income in San Gorgonio Pass in 2022:| San Gorgonio Pass: | $79,771 |
| State: | $104,823 |
Median non-family income in San Gorgonio Pass in 2022:| San Gorgonio Pass: | $37,145 |
| California: | $59,348 |
Change in median non-family income between 2000 and 2022:| San Gorgonio Pass, California: | +90.9% |
| State: | +85.3% |
Median per capita income in San Gorgonio Pass in 2022:| San Gorgonio Pass: | $32,031 |
| California: | $46,661 |
Change in median per capita income between 2000 and 2022:| San Gorgonio Pass, California: | +89.8% |
| State: | +105.5% |
Income statistics for White residents
Median household income in San Gorgonio Pass, CA in 2022:| San Gorgonio Pass: | $69,681 |
| State: | $100,917 |
Change in median household income between 2000 and 2022:| San Gorgonio Pass, California: | +101.4% |
| State: | +96.8% |
Number of households with income < $10k:| San Gorgonio Pass: | 4.4% (11,987) |
| State: | 4.4% (284,109) |
Number of households with income $10k - 20k:| San Gorgonio Pass: | 5.2% (14,371) |
| California: | 5.3% (340,330) |
Number of households with income $20k - 30k:| San Gorgonio Pass: | 6.3% (17,365) |
| State: | 5.3% (343,145) |
Number of households with income $30k - 40k:| San Gorgonio Pass: | 5.7% (15,781) |
| State: | 5.1% (330,146) |
Number of households with income $40k - 50k:| San Gorgonio Pass: | 5.8% (15,935) |
| State: | 5.2% (335,310) |
Number of households with income $50k - 60k:| San Gorgonio Pass: | 6.0% (16,659) |
| State: | 5.1% (326,299) |
Number of households with income $60k - 75k:| San Gorgonio Pass: | 8.8% (24,207) |
| California: | 7.6% (487,640) |
Number of households with income $75k - 100k:| San Gorgonio Pass: | 12.4% (34,294) |
| California: | 11.5% (736,578) |
Number of households with income $100k - 125k:| San Gorgonio Pass: | 10.7% (29,518) |
| California: | 10.1% (648,782) |
Number of households with income $125k - 150k:| San Gorgonio Pass: | 9.0% (24,826) |
| State: | 7.8% (499,671) |
Number of households with income $150k - 200k:| San Gorgonio Pass: | 11.5% (31,670) |
| California: | 11.4% (729,603) |
Number of households with income > $200k:| San Gorgonio Pass: | 14.1% (38,898) |
| State: | 21.2% (1,364,246) |
Aggregate household income in San Gorgonio Pass in 2022: $13,882,853,120
Median family income in San Gorgonio Pass in 2022:| San Gorgonio Pass: | $85,558 |
| State: | $125,379 |
Number of families with income < $10k:| San Gorgonio Pass: | 4.9% (362) |
| State: | 2.2% (87,079) |
Number of families with income $10k - 20k:| San Gorgonio Pass: | 4.2% (316) |
| State: | 2.5% (97,716) |
Number of families with income $20k - 30k:| San Gorgonio Pass: | 6.0% (444) |
| State: | 3.5% (137,295) |
Number of families with income $30k - 40k:| San Gorgonio Pass: | 7.5% (557) |
| California: | 3.9% (152,947) |
Number of families with income $40k - 50k:| San Gorgonio Pass: | 8.0% (595) |
| State: | 4.3% (169,197) |
Number of families with income $50k - 60k:| San Gorgonio Pass: | 7.5% (559) |
| State: | 4.5% (176,192) |
Number of families with income $60k - 75k:| San Gorgonio Pass: | 11.2% (837) |
| State: | 7.0% (274,752) |
Number of families with income $75k - 100k:| San Gorgonio Pass: | 12.9% (963) |
| State: | 11.3% (445,632) |
Number of families with income $100k - 125k:| San Gorgonio Pass: | 8.9% (667) |
| California: | 10.7% (423,630) |
Number of families with income $125k - 150k:| San Gorgonio Pass: | 7.5% (559) |
| State: | 9.1% (357,408) |
Number of families with income $150k - 200k:| San Gorgonio Pass: | 10.2% (757) |
| State: | 13.5% (532,693) |
Number of families with income > $200k:| San Gorgonio Pass: | 11.2% (839) |
| California: | 27.6% (1,086,948) |
Median non-family income in San Gorgonio Pass in 2022:| San Gorgonio Pass: | $37,261 |
| State: | $62,819 |
Change in median non-family income between 2000 and 2022:| San Gorgonio Pass, California: | +89.2% |
| State: | +84.4% |
Median per capita income in San Gorgonio Pass in 2022:| San Gorgonio Pass: | $40,983 |
| California: | $61,706 |
Change in median per capita income between 2000 and 2022:| San Gorgonio Pass, California: | +114.2% |
| California: | +122.7% |
Income statistics for Black or African American residents
Median household income in San Gorgonio Pass, CA in 2022:| San Gorgonio Pass: | $44,869 |
| State: | $63,268 |
Change in median household income between 2000 and 2022:| San Gorgonio Pass, California: | +106.7% |
| State: | +81.0% |
Number of households with income < $10k:| San Gorgonio Pass: | 7.4% (2,249) |
| California: | 9.0% (73,219) |
Number of households with income $10k - 20k:| San Gorgonio Pass: | 7.7% (2,340) |
| California: | 10.6% (86,666) |
Number of households with income $20k - 30k:| San Gorgonio Pass: | 5.3% (1,618) |
| State: | 7.1% (57,719) |
Number of households with income $30k - 40k:| San Gorgonio Pass: | 5.6% (1,713) |
| California: | 7.2% (58,714) |
Number of households with income $40k - 50k:| San Gorgonio Pass: | 5.7% (1,739) |
| State: | 7.1% (58,075) |
Number of households with income $50k - 60k:| San Gorgonio Pass: | 7.0% (2,129) |
| California: | 6.8% (55,229) |
Number of households with income $60k - 75k:| San Gorgonio Pass: | 8.5% (2,609) |
| California: | 8.8% (71,895) |
Number of households with income $75k - 100k:| San Gorgonio Pass: | 13.3% (4,064) |
| State: | 11.9% (96,893) |
Number of households with income $100k - 125k:| San Gorgonio Pass: | 13.0% (3,964) |
| California: | 8.7% (70,729) |
Number of households with income $125k - 150k:| San Gorgonio Pass: | 6.8% (2,083) |
| State: | 6.3% (51,211) |
Number of households with income $150k - 200k:| San Gorgonio Pass: | 9.2% (2,808) |
| California: | 7.2% (58,687) |
Number of households with income > $200k:| San Gorgonio Pass: | 10.6% (3,246) |
| California: | 9.3% (75,487) |
Aggregate household income in San Gorgonio Pass in 2022: $125,091,227
Median family income in San Gorgonio Pass in 2022:| San Gorgonio Pass: | $46,548 |
| State: | $77,263 |
Number of families with income < $10k:| San Gorgonio Pass: | 15.2% (118) |
| State: | 5.9% (27,037) |
Number of families with income $10k - 20k:| San Gorgonio Pass: | 16.9% (131) |
| State: | 6.4% (29,505) |
Number of families with income $20k - 30k:| San Gorgonio Pass: | 6.1% (47) |
| State: | 5.6% (25,755) |
Number of families with income $30k - 40k:| San Gorgonio Pass: | 5.0% (39) |
| State: | 6.8% (30,948) |
Number of families with income $40k - 50k:| San Gorgonio Pass: | 9.4% (73) |
| State: | 8.3% (38,171) |
Number of families with income $50k - 60k:| San Gorgonio Pass: | 3.3% (26) |
| State: | 7.0% (31,860) |
Number of families with income $60k - 75k:| San Gorgonio Pass: | 14.4% (112) |
| State: | 8.7% (40,021) |
Number of families with income $75k - 100k:| San Gorgonio Pass: | 6.9% (54) |
| State: | 12.4% (56,846) |
Number of families with income $100k - 125k:| San Gorgonio Pass: | 3.0% (24) |
| State: | 9.8% (44,911) |
Number of families with income > $200k:| San Gorgonio Pass: | 19.7% (153) |
| State: | 12.2% (56,093) |
Median non-family income in San Gorgonio Pass in 2022:| San Gorgonio Pass: | $41,641 |
| State: | $41,942 |
Change in median non-family income between 2000 and 2022:| San Gorgonio Pass, California: | +129.1% |
| California: | +72.0% |
Median per capita income in San Gorgonio Pass in 2022:| San Gorgonio Pass: | $29,720 |
| State: | $36,708 |
Change in median per capita income between 2000 and 2022:| San Gorgonio Pass, California: | +132.5% |
| California: | +110.4% |
Income statistics for Asian residents
Median household income in San Gorgonio Pass, CA in 2022:| San Gorgonio Pass: | $64,535 |
| State: | $119,861 |
Change in median household income between 2000 and 2022:| San Gorgonio Pass, California: | +115.7% |
| State: | +116.5% |
Number of households with income < $10k:| San Gorgonio Pass: | 4.6% (1,398) |
| California: | 5.1% (106,273) |
Number of households with income $10k - 20k:| San Gorgonio Pass: | 2.9% (878) |
| California: | 4.9% (101,815) |
Number of households with income $20k - 30k:| San Gorgonio Pass: | 6.1% (1,859) |
| State: | 4.6% (94,414) |
Number of households with income $30k - 40k:| San Gorgonio Pass: | 4.8% (1,468) |
| State: | 4.1% (84,491) |
Number of households with income $40k - 50k:| San Gorgonio Pass: | 6.5% (1,958) |
| California: | 4.0% (81,758) |
Number of households with income $50k - 60k:| San Gorgonio Pass: | 4.1% (1,238) |
| State: | 3.9% (80,971) |
Number of households with income $60k - 75k:| San Gorgonio Pass: | 7.3% (2,221) |
| State: | 6.0% (124,194) |
Number of households with income $75k - 100k:| San Gorgonio Pass: | 8.9% (2,706) |
| California: | 9.7% (200,337) |
Number of households with income $100k - 125k:| San Gorgonio Pass: | 12.8% (3,872) |
| California: | 9.4% (193,488) |
Number of households with income $125k - 150k:| San Gorgonio Pass: | 11.9% (3,618) |
| State: | 7.7% (158,253) |
Number of households with income $150k - 200k:| San Gorgonio Pass: | 13.9% (4,228) |
| California: | 12.2% (252,139) |
Number of households with income > $200k:| San Gorgonio Pass: | 16.1% (4,883) |
| California: | 28.4% (586,641) |
Aggregate household income in San Gorgonio Pass in 2022: $113,380,450
Median family income in San Gorgonio Pass in 2022:| San Gorgonio Pass: | $68,910 |
| California: | $136,040 |
Number of families with income < $10k:| San Gorgonio Pass: | 7.8% (66) |
| State: | 2.8% (42,046) |
Number of families with income $10k - 20k:| San Gorgonio Pass: | 4.1% (35) |
| State: | 3.1% (46,821) |
Number of families with income $20k - 30k:| San Gorgonio Pass: | 3.6% (31) |
| California: | 4.1% (61,519) |
Number of families with income $30k - 40k:| San Gorgonio Pass: | 5.2% (44) |
| State: | 3.7% (55,234) |
Number of families with income $40k - 50k:| San Gorgonio Pass: | 4.6% (39) |
| California: | 3.9% (58,471) |
Number of families with income $50k - 60k:| San Gorgonio Pass: | 2.6% (22) |
| State: | 3.9% (58,911) |
Number of families with income $60k - 75k:| San Gorgonio Pass: | 11.8% (101) |
| State: | 5.9% (88,675) |
Number of families with income $75k - 100k:| San Gorgonio Pass: | 2.0% (17) |
| California: | 9.5% (143,103) |
Number of families with income $125k - 150k:| San Gorgonio Pass: | 13.1% (112) |
| California: | 8.0% (120,635) |
Number of families with income $150k - 200k:| San Gorgonio Pass: | 13.8% (118) |
| State: | 13.2% (198,099) |
Number of families with income > $200k:| San Gorgonio Pass: | 31.3% (266) |
| State: | 32.5% (489,303) |
Median non-family income in San Gorgonio Pass in 2022:| San Gorgonio Pass: | $60,341 |
| State: | $74,216 |
Median per capita income in San Gorgonio Pass in 2022:| San Gorgonio Pass: | $24,377 |
| State: | $58,824 |
Change in median per capita income between 2000 and 2022:| San Gorgonio Pass, California: | +104.0% |
| State: | +166.8% |
Income statistics for Hispanic or Latino residents
Median household income in San Gorgonio Pass, CA in 2022:| San Gorgonio Pass: | $71,632 |
| State: | $75,698 |
Change in median household income between 2000 and 2022:| San Gorgonio Pass, California: | +126.6% |
| California: | +107.2% |
Number of households with income < $10k:| San Gorgonio Pass: | 3.7% (10,108) |
| State: | 4.3% (183,294) |
Number of households with income $10k - 20k:| San Gorgonio Pass: | 4.5% (12,403) |
| State: | 6.0% (253,903) |
Number of households with income $20k - 30k:| San Gorgonio Pass: | 5.7% (15,776) |
| California: | 6.8% (286,386) |
Number of households with income $30k - 40k:| San Gorgonio Pass: | 7.3% (20,042) |
| State: | 7.4% (313,728) |
Number of households with income $40k - 50k:| San Gorgonio Pass: | 6.5% (17,827) |
| California: | 7.4% (313,199) |
Number of households with income $50k - 60k:| San Gorgonio Pass: | 7.3% (20,215) |
| State: | 7.2% (305,366) |
Number of households with income $60k - 75k:| San Gorgonio Pass: | 9.4% (25,918) |
| State: | 10.3% (434,937) |
Number of households with income $75k - 100k:| San Gorgonio Pass: | 15.8% (43,692) |
| State: | 14.4% (607,302) |
Number of households with income $100k - 125k:| San Gorgonio Pass: | 12.5% (34,400) |
| California: | 10.6% (447,424) |
Number of households with income $125k - 150k:| San Gorgonio Pass: | 9.0% (24,802) |
| California: | 7.5% (316,022) |
Number of households with income $150k - 200k:| San Gorgonio Pass: | 11.0% (30,453) |
| State: | 9.2% (386,269) |
Number of households with income > $200k:| San Gorgonio Pass: | 7.3% (20,024) |
| California: | 8.8% (372,651) |
Aggregate household income in San Gorgonio Pass in 2022: $1,979,871,775
Median family income in San Gorgonio Pass in 2022:| San Gorgonio Pass: | $81,634 |
| State: | $77,589 |
Number of families with income < $10k:| San Gorgonio Pass: | 4.8% (467) |
| California: | 3.9% (129,468) |
Number of families with income $10k - 20k:| San Gorgonio Pass: | 6.4% (616) |
| California: | 4.6% (151,997) |
Number of families with income $20k - 30k:| San Gorgonio Pass: | 9.5% (915) |
| California: | 6.6% (216,764) |
Number of families with income $30k - 40k:| San Gorgonio Pass: | 11.6% (1,121) |
| State: | 7.6% (249,849) |
Number of families with income $40k - 50k:| San Gorgonio Pass: | 8.6% (831) |
| California: | 7.7% (254,822) |
Number of families with income $50k - 60k:| San Gorgonio Pass: | 9.8% (944) |
| California: | 7.4% (244,815) |
Number of families with income $60k - 75k:| San Gorgonio Pass: | 9.4% (911) |
| State: | 10.5% (345,838) |
Number of families with income $75k - 100k:| San Gorgonio Pass: | 14.4% (1,390) |
| California: | 14.9% (491,589) |
Number of families with income $100k - 125k:| San Gorgonio Pass: | 8.5% (826) |
| State: | 10.7% (355,400) |
Number of families with income $125k - 150k:| San Gorgonio Pass: | 6.2% (601) |
| State: | 7.8% (259,317) |
Number of families with income $150k - 200k:| San Gorgonio Pass: | 6.7% (652) |
| California: | 9.3% (306,566) |
Number of families with income > $200k:| San Gorgonio Pass: | 4.1% (400) |
| California: | 9.1% (299,984) |
Median non-family income in San Gorgonio Pass in 2022:| San Gorgonio Pass: | $35,992 |
| California: | $49,746 |
Change in median non-family income between 2000 and 2022:| San Gorgonio Pass, California: | +97.0% |
| State: | +100.7% |
Median per capita income in San Gorgonio Pass in 2022:| San Gorgonio Pass: | $25,106 |
| State: | $27,240 |
Change in median per capita income between 2000 and 2022:| San Gorgonio Pass, California: | +141.6% |
| State: | +133.3% |
Income statistics for American Indian and Alaska Native residents
Median household income in San Gorgonio Pass, CA in 2022:| San Gorgonio Pass: | $60,727 |
| California: | $76,752 |
Change in median household income between 2000 and 2022:| San Gorgonio Pass, California: | +101.6% |
| California: | +110.0% |
Number of households with income < $10k:| San Gorgonio Pass: | 8.5% (749) |
| State: | 5.4% (8,471) |
Number of households with income $10k - 20k:| San Gorgonio Pass: | 4.5% (394) |
| California: | 6.0% (9,381) |
Number of households with income $20k - 30k:| San Gorgonio Pass: | 2.2% (193) |
| California: | 5.5% (8,668) |
Number of households with income $30k - 40k:| San Gorgonio Pass: | 5.6% (491) |
| State: | 8.3% (13,030) |
Number of households with income $40k - 50k:| San Gorgonio Pass: | 5.8% (511) |
| State: | 6.9% (10,908) |
Number of households with income $50k - 60k:| San Gorgonio Pass: | 13.0% (1,144) |
| California: | 7.1% (11,198) |
Number of households with income $60k - 75k:| San Gorgonio Pass: | 9.1% (796) |
| State: | 9.6% (15,190) |
Number of households with income $75k - 100k:| San Gorgonio Pass: | 15.5% (1,360) |
| California: | 14.1% (22,274) |
Number of households with income $100k - 125k:| San Gorgonio Pass: | 9.6% (847) |
| State: | 11.2% (17,643) |
Number of households with income $125k - 150k:| San Gorgonio Pass: | 6.0% (530) |
| State: | 8.3% (13,117) |
Number of households with income $150k - 200k:| San Gorgonio Pass: | 10.1% (886) |
| California: | 8.8% (13,853) |
Number of households with income > $200k:| San Gorgonio Pass: | 10.1% (885) |
| State: | 8.8% (13,925) |
Aggregate household income in San Gorgonio Pass in 2022: $131,865,466
Median family income in San Gorgonio Pass in 2022:| San Gorgonio Pass: | $70,187 |
| California: | $81,108 |
Number of families with income < $10k:| San Gorgonio Pass: | 12.5% (127) |
| State: | 5.0% (5,711) |
Number of families with income $20k - 30k:| San Gorgonio Pass: | 6.8% (69) |
| California: | 4.3% (4,876) |
Number of families with income $30k - 40k:| San Gorgonio Pass: | 4.1% (42) |
| California: | 8.8% (9,994) |
Number of families with income $40k - 50k:| San Gorgonio Pass: | 5.0% (51) |
| State: | 7.8% (8,776) |
Number of families with income $50k - 60k:| San Gorgonio Pass: | 8.2% (84) |
| California: | 6.9% (7,834) |
Number of families with income $60k - 75k:| San Gorgonio Pass: | 1.9% (19) |
| State: | 9.1% (10,247) |
Number of families with income $75k - 100k:| San Gorgonio Pass: | 6.4% (65) |
| California: | 14.8% (16,731) |
Number of families with income $100k - 125k:| San Gorgonio Pass: | 18.6% (189) |
| State: | 12.0% (13,609) |
Number of families with income $125k - 150k:| San Gorgonio Pass: | 13.8% (140) |
| State: | 8.0% (9,104) |
Number of families with income $150k - 200k:| San Gorgonio Pass: | 15.0% (153) |
| State: | 9.5% (10,721) |
Number of families with income > $200k:| San Gorgonio Pass: | 7.6% (78) |
| California: | 10.1% (11,409) |
Median non-family income in San Gorgonio Pass in 2022:| San Gorgonio Pass: | $41,451 |
| State: | $51,296 |
Median per capita income in San Gorgonio Pass in 2022:| San Gorgonio Pass: | $33,311 |
| State: | $30,289 |
Change in median per capita income between 2000 and 2022:| San Gorgonio Pass, California: | +133.6% |
| California: | +98.9% |
Income statistics for Multirace residents
Median household income in San Gorgonio Pass, CA in 2022:| San Gorgonio Pass: | $62,690 |
| State: | $83,153 |
Change in median household income between 2000 and 2022:| San Gorgonio Pass, California: | +104.2% |
| State: | +106.0% |
Number of households with income < $10k:| San Gorgonio Pass: | 4.2% (4,364) |
| State: | 4.2% (85,299) |
Number of households with income $10k - 20k:| San Gorgonio Pass: | 4.7% (4,923) |
| State: | 6.1% (122,966) |
Number of households with income $20k - 30k:| San Gorgonio Pass: | 5.5% (5,807) |
| State: | 6.4% (129,328) |
Number of households with income $30k - 40k:| San Gorgonio Pass: | 7.8% (8,158) |
| State: | 6.4% (130,070) |
Number of households with income $40k - 50k:| San Gorgonio Pass: | 7.2% (7,544) |
| State: | 6.5% (131,254) |
Number of households with income $50k - 60k:| San Gorgonio Pass: | 7.3% (7,617) |
| State: | 6.5% (132,382) |
Number of households with income $60k - 75k:| San Gorgonio Pass: | 8.9% (9,356) |
| California: | 9.4% (191,472) |
Number of households with income $75k - 100k:| San Gorgonio Pass: | 15.1% (15,816) |
| California: | 13.3% (269,691) |
Number of households with income $100k - 125k:| San Gorgonio Pass: | 10.7% (11,198) |
| California: | 10.2% (207,286) |
Number of households with income $125k - 150k:| San Gorgonio Pass: | 8.9% (9,328) |
| California: | 7.8% (158,259) |
Number of households with income $150k - 200k:| San Gorgonio Pass: | 10.2% (10,742) |
| California: | 10.3% (209,227) |
Number of households with income > $200k:| San Gorgonio Pass: | 9.7% (10,204) |
| State: | 13.0% (263,210) |
Aggregate household income in San Gorgonio Pass in 2022: $379,026,349
Median family income in San Gorgonio Pass in 2022:| San Gorgonio Pass: | $72,828 |
| State: | $87,642 |
Number of families with income < $10k:| San Gorgonio Pass: | 2.7% (80) |
| State: | 3.2% (48,017) |
Number of families with income $10k - 20k:| San Gorgonio Pass: | 3.7% (108) |
| State: | 4.1% (60,419) |
Number of families with income $20k - 30k:| San Gorgonio Pass: | 7.5% (220) |
| California: | 6.1% (89,742) |
Number of families with income $30k - 40k:| San Gorgonio Pass: | 11.1% (328) |
| State: | 6.2% (91,415) |
Number of families with income $40k - 50k:| San Gorgonio Pass: | 6.6% (195) |
| California: | 6.8% (100,085) |
Number of families with income $50k - 60k:| San Gorgonio Pass: | 9.4% (276) |
| California: | 6.7% (98,298) |
Number of families with income $60k - 75k:| San Gorgonio Pass: | 7.0% (206) |
| California: | 9.5% (140,131) |
Number of families with income $75k - 100k:| San Gorgonio Pass: | 15.4% (453) |
| State: | 13.8% (203,439) |
Number of families with income $125k - 150k:| San Gorgonio Pass: | 9.4% (278) |
| State: | 8.4% (124,115) |
Number of families with income > $200k:| San Gorgonio Pass: | 27.3% (806) |
| State: | 14.0% (207,317) |
Median non-family income in San Gorgonio Pass in 2022:| San Gorgonio Pass: | $41,197 |
| State: | $56,558 |
Change in median non-family income between 2000 and 2022:| San Gorgonio Pass, California: | +80.4% |
| State: | +100.2% |
Median per capita income in San Gorgonio Pass in 2022:| San Gorgonio Pass: | $22,971 |
| State: | $32,124 |
Change in median per capita income between 2000 and 2022:| San Gorgonio Pass, California: | +142.3% |
| California: | +120.4% |
Income statistics for other residents
Number of households with income < $10k:| San Gorgonio Pass: | 3.0% (148) |
| California: | 4.6% (93,035) |
Number of households with income $10k - 20k:| San Gorgonio Pass: | 4.4% (215) |
| State: | 6.3% (126,222) |
Number of households with income $20k - 30k:| San Gorgonio Pass: | 6.1% (297) |
| California: | 7.1% (142,656) |
Number of households with income $30k - 40k:| San Gorgonio Pass: | 7.3% (359) |
| State: | 8.2% (165,018) |
Number of households with income $40k - 50k:| San Gorgonio Pass: | 6.8% (334) |
| State: | 8.0% (161,732) |
Number of households with income $50k - 60k:| San Gorgonio Pass: | 6.8% (335) |
| State: | 7.6% (152,152) |
Number of households with income $60k - 75k:| San Gorgonio Pass: | 10.3% (505) |
| State: | 10.4% (209,951) |
Number of households with income $75k - 100k:| San Gorgonio Pass: | 15.2% (747) |
| State: | 14.7% (296,102) |
Number of households with income $100k - 125k:| San Gorgonio Pass: | 13.1% (643) |
| State: | 10.7% (214,281) |
Number of households with income $125k - 150k:| San Gorgonio Pass: | 8.2% (402) |
| State: | 7.1% (143,092) |
Number of households with income $150k - 200k:| San Gorgonio Pass: | 11.5% (563) |
| State: | 8.6% (172,215) |
Number of households with income > $200k:| San Gorgonio Pass: | 7.2% (351) |
| State: | 6.7% (134,102) |
Aggregate household income in San Gorgonio Pass in 2022: $472,232,498
Median family income in San Gorgonio Pass in 2022:| San Gorgonio Pass: | $80,080 |
| State: | $72,756 |
Number of families with income < $10k:| San Gorgonio Pass: | 5.6% (153) |
| California: | 4.3% (69,090) |
Number of families with income $10k - 20k:| San Gorgonio Pass: | 4.7% (131) |
| State: | 5.1% (82,116) |
Number of families with income $20k - 30k:| San Gorgonio Pass: | 5.8% (160) |
| State: | 7.0% (112,854) |
Number of families with income $30k - 40k:| San Gorgonio Pass: | 7.5% (207) |
| State: | 8.4% (135,938) |
Number of families with income $40k - 50k:| San Gorgonio Pass: | 7.7% (212) |
| California: | 8.4% (135,353) |
Number of families with income $50k - 60k:| San Gorgonio Pass: | 7.1% (196) |
| State: | 7.7% (124,826) |
Number of families with income $60k - 75k:| San Gorgonio Pass: | 10.6% (292) |
| State: | 10.7% (173,628) |
Number of families with income $75k - 100k:| San Gorgonio Pass: | 19.0% (524) |
| California: | 15.2% (245,724) |
Number of families with income $100k - 125k:| San Gorgonio Pass: | 9.1% (250) |
| California: | 10.9% (176,716) |
Number of families with income $125k - 150k:| San Gorgonio Pass: | 3.3% (92) |
| California: | 7.4% (119,985) |
Number of families with income $150k - 200k:| San Gorgonio Pass: | 6.0% (167) |
| State: | 8.5% (137,332) |
Number of families with income > $200k:| San Gorgonio Pass: | 13.6% (376) |
| California: | 6.6% (106,346) |
Median non-family income in San Gorgonio Pass in 2022:| San Gorgonio Pass: | $39,851 |
| California: | $43,881 |
Change in median non-family income between 2000 and 2022:| San Gorgonio Pass, California: | +121.1% |
| State: | +84.6% |
Median per capita income in San Gorgonio Pass in 2022:| San Gorgonio Pass: | $25,263 |
| State: | $25,164 |
Change in median per capita income between 2000 and 2022:| San Gorgonio Pass, California: | +141.4% |
| California: | +137.9% |