The median household income in Rutland, VT in 2022 was $53,287, which was 38.9% less than the median annual income of $73,991 across the entire state of Vermont. Compared to the median income of $30,478 in 2000 this represents an increase of 42.8%. The per capita income in 2022 was $35,543, which means an increase of 52.0% compared to 2000 when it was $17,075.
Whole page based on the data from 2000 / 2022 when the population of Rutland, Vermont was 17,292 / 15,899
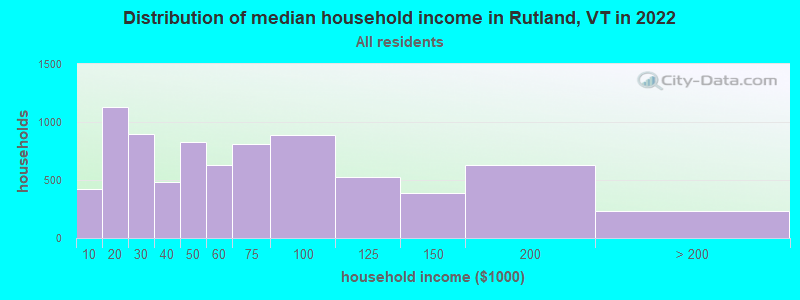
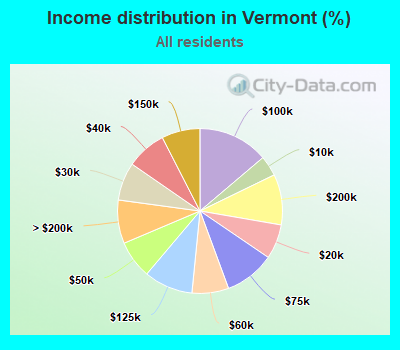
Income statistics for all residents
Median household income in Rutland, VT in 2022:
Rutland:
$53,287
State:
$73,991
Change in median household income between 2000 and 2022:
Rutland, Vermont:
+74.8%
Vermont:
+81.1%
Number of households with income < $10k:
Rutland:
5.3% (420)
State:
4.0% (11,050)
Number of households with income $10k - 20k:
Rutland:
14.4% (1,130)
Vermont:
6.8% (18,853)
Number of households with income $20k - 30k:
Rutland:
11.4% (896)
State:
7.5% (20,673)
Number of households with income $30k - 40k:
Rutland:
6.2% (485)
State:
7.8% (21,750)
Number of households with income $40k - 50k:
Rutland:
10.5% (830)
Vermont:
7.4% (20,642)
Number of households with income $50k - 60k:
Rutland:
8.0% (631)
State:
7.2% (19,901)
Number of households with income $60k - 75k:
Rutland:
10.3% (813)
State:
9.9% (27,351)
Number of households with income $75k - 100k:
Rutland:
11.3% (888)
State:
13.8% (38,275)
Number of households with income $100k - 125k:
Rutland:
6.7% (526)
Vermont:
9.6% (26,632)
Number of households with income $125k - 150k:
Rutland:
5.0% (390)
State:
7.5% (20,857)
Number of households with income $150k - 200k:
Rutland:
8.0% (628)
Vermont:
9.9% (27,469)
Number of households with income > $200k:
Rutland:
2.9% (232)
Vermont:
8.5% (23,637)
Aggregate household income in Rutland in 2022: $540,467,529
Median family income in Rutland in 2022:
Rutland:
$81,062
Vermont:
$96,345
Number of families with income < $10k:
Rutland:
2.3% (85)
State:
2.0% (3,329)
Number of families with income $10k - 20k:
Rutland:
8.0% (303)
Vermont:
3.3% (5,446)
Number of families with income $20k - 30k:
Rutland:
6.1% (228)
Vermont:
4.4% (7,162)
Number of families with income $30k - 40k:
Rutland:
3.8% (144)
State:
5.9% (9,690)
Number of families with income $40k - 50k:
Rutland:
7.9% (297)
Vermont:
6.1% (10,098)
Number of families with income $50k - 60k:
Rutland:
7.3% (275)
State:
5.9% (9,726)
Number of families with income $60k - 75k:
Rutland:
8.6% (322)
State:
9.2% (15,108)
Number of families with income $75k - 100k:
Rutland:
16.8% (632)
State:
15.7% (25,788)
Number of families with income $100k - 125k:
Rutland:
12.8% (483)
State:
12.7% (20,949)
Number of families with income $125k - 150k:
Rutland:
9.0% (340)
Vermont:
9.6% (15,752)
Number of families with income $150k - 200k:
Rutland:
11.6% (438)
Vermont:
13.2% (21,675)
Number of families with income > $200k:
Rutland:
5.8% (219)
State:
12.0% (19,773)
Median non-family income in Rutland in 2022:
Rutland:
$32,803
State:
$46,022
Change in median non-family income between 2000 and 2022:
Rutland, Vermont:
+78.5%
Vermont:
+87.4%
Median per capita income in Rutland in 2022:
Rutland:
$35,543
State:
$42,251
Change in median per capita income between 2000 and 2022:
Rutland, Vermont:
+108.2%
State:
+104.9%
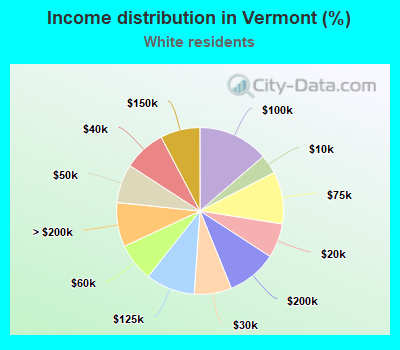
Income statistics for White residents
Median household income in Rutland, VT in 2022:
Rutland:
$52,583
Vermont:
$73,591
Change in median household income between 2000 and 2022:
Rutland, Vermont:
+70.3%
State:
+79.2%
Number of households with income < $10k:
Rutland:
4.3% (311)
State:
3.7% (9,508)
Number of households with income $10k - 20k:
Rutland:
14.2% (1,028)
State:
6.7% (17,064)
Number of households with income $20k - 30k:
Rutland:
11.5% (828)
State:
7.2% (18,552)
Number of households with income $30k - 40k:
Rutland:
6.9% (496)
State:
8.2% (20,886)
Number of households with income $40k - 50k:
Rutland:
10.8% (782)
Vermont:
7.5% (19,216)
Number of households with income $50k - 60k:
Rutland:
8.7% (625)
State:
7.4% (18,898)
Number of households with income $60k - 75k:
Rutland:
10.8% (782)
State:
10.1% (25,944)
Number of households with income $75k - 100k:
Rutland:
9.7% (704)
State:
13.7% (34,991)
Number of households with income $100k - 125k:
Rutland:
6.4% (460)
State:
9.5% (24,409)
Number of households with income $125k - 150k:
Rutland:
5.3% (384)
Vermont:
7.7% (19,710)
Number of households with income $150k - 200k:
Rutland:
8.3% (599)
State:
9.7% (24,802)
Number of households with income > $200k:
Rutland:
3.1% (226)
State:
8.6% (21,983)
Aggregate household income in Rutland in 2022: $501,609,662
Median family income in Rutland in 2022:
Rutland:
$80,045
Vermont:
$96,147
Number of families with income < $10k:
Rutland:
2.2% (76)
State:
1.8% (2,669)
Number of families with income $10k - 20k:
Rutland:
8.0% (282)
Vermont:
3.1% (4,686)
Number of families with income $20k - 30k:
Rutland:
6.4% (226)
State:
4.1% (6,266)
Number of families with income $30k - 40k:
Rutland:
4.2% (147)
State:
6.1% (9,273)
Number of families with income $40k - 50k:
Rutland:
8.8% (307)
Vermont:
6.4% (9,714)
Number of families with income $50k - 60k:
Rutland:
7.9% (275)
Vermont:
6.1% (9,310)
Number of families with income $60k - 75k:
Rutland:
9.0% (314)
State:
9.3% (14,175)
Number of families with income $75k - 100k:
Rutland:
13.9% (487)
State:
15.5% (23,673)
Number of families with income $100k - 125k:
Rutland:
11.9% (418)
State:
12.7% (19,323)
Number of families with income $125k - 150k:
Rutland:
9.4% (330)
Vermont:
9.7% (14,805)
Number of families with income $150k - 200k:
Rutland:
12.2% (426)
State:
13.1% (20,018)
Number of families with income > $200k:
Rutland:
6.1% (213)
State:
12.1% (18,463)
Median non-family income in Rutland in 2022:
Rutland:
$33,367
State:
$45,952
Change in median non-family income between 2000 and 2022:
Rutland, Vermont:
+79.4%
Vermont:
+86.1%
Median per capita income in Rutland in 2022:
Rutland:
$35,547
State:
$43,031
Change in median per capita income between 2000 and 2022:
Rutland, Vermont:
+106.2%
State:
+106.0%
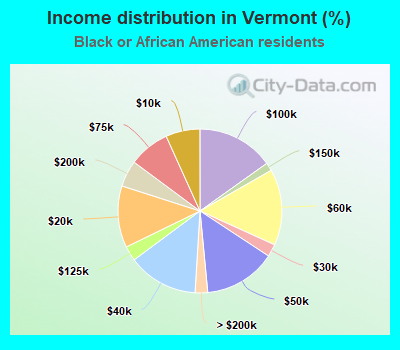
Income statistics for Black or African American residents
Median household income in Rutland, VT in 2022:
Rutland:
$119,097
Vermont:
$78,611
Number of households with income < $10k:
Rutland:
0.0% (0)
State:
6.8% (152)
Number of households with income $10k - 20k:
Rutland:
23.3% (14)
State:
12.2% (274)
Number of households with income $20k - 30k:
Rutland:
0.0% (0)
State:
2.5% (56)
Number of households with income $30k - 40k:
Rutland:
0.0% (0)
State:
13.9% (312)
Number of households with income $40k - 50k:
Rutland:
6.7% (4)
Vermont:
14.2% (320)
Number of households with income $50k - 60k:
Rutland:
0.0% (0)
State:
15.0% (338)
Number of households with income $60k - 75k:
Rutland:
0.0% (0)
Vermont:
8.1% (182)
Number of households with income $75k - 100k:
Rutland:
70.0% (42)
State:
15.2% (341)
Number of households with income $100k - 125k:
Rutland:
0.0% (0)
State:
2.9% (66)
Number of households with income $125k - 150k:
Rutland:
0.0% (0)
Vermont:
1.6% (36)
Number of households with income $150k - 200k:
Rutland:
0.0% (0)
State:
5.2% (117)
Number of households with income > $200k:
Rutland:
0.0% (0)
Vermont:
2.5% (56)
Aggregate household income in Rutland in 2022: $5,425,307
Median per capita income in Rutland in 2022:
Rutland:
$45,461
State:
$40,315
Income statistics for Asian residents
Number of households with income < $10k:
Rutland:
100.0% (96)
Vermont:
8.9% (278)
Number of households with income $10k - 20k:
Rutland:
0.0% (0)
State:
5.9% (184)
Number of households with income $20k - 30k:
Rutland:
0.0% (0)
Vermont:
8.3% (258)
Number of households with income $30k - 40k:
Rutland:
0.0% (0)
State:
8.8% (273)
Number of households with income $40k - 50k:
Rutland:
0.0% (0)
State:
9.7% (302)
Number of households with income $50k - 60k:
Rutland:
0.0% (0)
State:
3.4% (106)
Number of households with income $60k - 75k:
Rutland:
0.0% (0)
State:
6.5% (202)
Number of households with income $75k - 100k:
Rutland:
0.0% (0)
Vermont:
14.6% (455)
Number of households with income $100k - 125k:
Rutland:
0.0% (0)
State:
9.8% (305)
Number of households with income $125k - 150k:
Rutland:
0.0% (0)
Vermont:
2.7% (85)
Number of households with income $150k - 200k:
Rutland:
0.0% (0)
State:
11.8% (369)
Number of households with income > $200k:
Rutland:
0.0% (0)
Vermont:
9.6% (299)
Aggregate household income in Rutland in 2022: $7,378,396
Median per capita income in Rutland in 2022:
Rutland:
$19,950
State:
$32,037
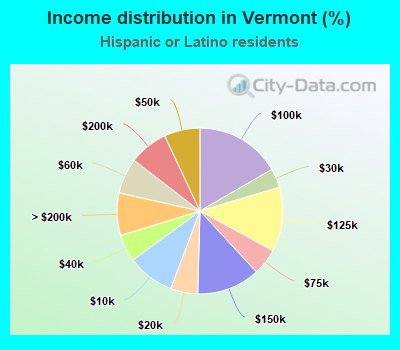
Income statistics for Hispanic or Latino residents
Median household income in Rutland, VT in 2022:
Rutland:
$97,786
State:
$90,490
Number of households with income < $10k:
Rutland:
0.0% (0)
State:
9.2% (500)
Number of households with income $10k - 20k:
Rutland:
0.0% (0)
State:
5.3% (288)
Number of households with income $20k - 30k:
Rutland:
0.0% (0)
State:
3.7% (203)
Number of households with income $30k - 40k:
Rutland:
7.1% (18)
State:
5.3% (288)
Number of households with income $40k - 50k:
Rutland:
15.7% (40)
State:
7.0% (379)
Number of households with income $50k - 60k:
Rutland:
10.6% (27)
Vermont:
6.9% (376)
Number of households with income $60k - 75k:
Rutland:
0.0% (0)
State:
5.2% (282)
Number of households with income $75k - 100k:
Rutland:
56.7% (144)
State:
16.7% (905)
Number of households with income $100k - 125k:
Rutland:
9.8% (25)
State:
12.6% (682)
Number of households with income $125k - 150k:
Rutland:
0.0% (0)
State:
12.3% (669)
Number of households with income $150k - 200k:
Rutland:
0.0% (0)
State:
7.6% (412)
Number of households with income > $200k:
Rutland:
0.0% (0)
Vermont:
8.3% (450)
Aggregate household income in Rutland in 2022: $16,240,405
Median family income in Rutland in 2022:
Rutland:
$94,990
State:
$116,955
Number of families with income < $10k:
Rutland:
34.9% (56)
State:
12.9% (469)
Number of families with income $75k - 100k:
Rutland:
48.4% (78)
State:
9.0% (326)
Number of families with income $100k - 125k:
Rutland:
16.8% (27)
Vermont:
16.6% (604)
Median per capita income in Rutland in 2022:
Rutland:
$37,899
Vermont:
$36,311
Income statistics for American Indian and Alaska Native residents
Median per capita income in Rutland in 2022:
Rutland:
$20,886
State:
$19,747
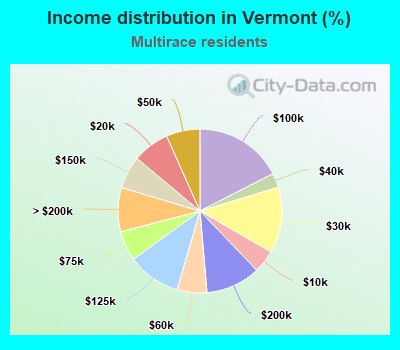
Income statistics for Multirace residents
Median household income in Rutland, VT in 2022:
Rutland:
$82,288
State:
$81,819
Number of households with income < $10k:
Rutland:
0.0% (0)
Vermont:
4.5% (613)
Number of households with income $10k - 20k:
Rutland:
7.1% (40)
Vermont:
7.3% (988)
Number of households with income $20k - 30k:
Rutland:
9.2% (52)
Vermont:
13.0% (1,770)
Number of households with income $30k - 40k:
Rutland:
0.0% (0)
State:
2.8% (386)
Number of households with income $40k - 50k:
Rutland:
18.5% (104)
Vermont:
6.7% (904)
Number of households with income $50k - 60k:
Rutland:
2.8% (16)
State:
5.9% (797)
Number of households with income $60k - 75k:
Rutland:
6.0% (34)
State:
5.9% (804)
Number of households with income $75k - 100k:
Rutland:
42.8% (241)
State:
17.5% (2,376)
Number of households with income $100k - 125k:
Rutland:
13.5% (76)
State:
10.5% (1,427)
Number of households with income $125k - 150k:
Rutland:
0.0% (0)
Vermont:
6.5% (877)
Number of households with income $150k - 200k:
Rutland:
0.0% (0)
State:
10.8% (1,467)
Number of households with income > $200k:
Rutland:
0.0% (0)
State:
8.7% (1,180)
Aggregate household income in Rutland in 2022: $37,054,280
Median family income in Rutland in 2022:
Rutland:
$86,078
Vermont:
$98,198
Number of families with income $75k - 100k:
Rutland:
78.3% (236)
State:
19.2% (1,562)
Number of families with income $100k - 125k:
Rutland:
21.7% (65)
Vermont:
11.7% (952)
Median non-family income in Rutland in 2022:
Rutland:
$43,016
State:
$44,940
Median per capita income in Rutland in 2022:
Rutland:
$41,768
Vermont:
$34,567
Income statistics for other residents
Median per capita income in Rutland in 2022:
Rutland:
$22,921
Vermont:
$36,770
Change in median per capita income between 2000 and 2022:: -19.7%
Rutland, Vermont:
-19.7%
State:
+234.5%
Discuss Rutland, Vermont (VT) on our hugely popular Vermont forum.