Ross Valley, California (CA) income map, earnings map, and wages data
The median household income in Ross Valley, CA in 2022 was $140,479, which was 34.8% greater than the median annual income of $91,551 across the entire state of California. Compared to the median income of $73,539 in 2000 this represents an increase of 47.7%. The per capita income in 2022 was $89,505, which means an increase of 48.7% compared to 2000 when it was $45,905.
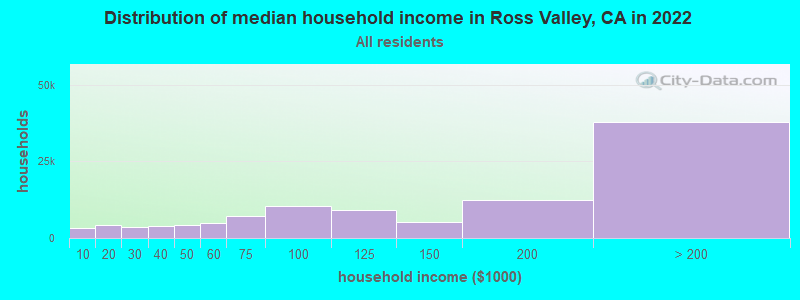
Income statistics for all residents
Median household income in Ross Valley, CA in 2022:| Ross Valley: | $140,480 |
| State: | $91,551 |
Change in median household income between 2000 and 2022:| Ross Valley, California: | +91.0% |
| State: | +92.8% |
Number of households with income < $10k:| Ross Valley: | 3.1% (3,285) |
| State: | 4.8% (654,370) |
Number of households with income $10k - 20k:| Ross Valley: | 3.9% (4,153) |
| California: | 5.8% (789,493) |
Number of households with income $20k - 30k:| Ross Valley: | 3.5% (3,717) |
| State: | 5.7% (778,318) |
Number of households with income $30k - 40k:| Ross Valley: | 3.8% (4,078) |
| State: | 5.8% (783,170) |
Number of households with income $40k - 50k:| Ross Valley: | 4.0% (4,244) |
| California: | 5.8% (781,352) |
Number of households with income $50k - 60k:| Ross Valley: | 4.5% (4,783) |
| State: | 5.6% (760,175) |
Number of households with income $60k - 75k:| Ross Valley: | 6.7% (7,135) |
| State: | 8.2% (1,104,699) |
Number of households with income $75k - 100k:| Ross Valley: | 9.8% (10,405) |
| California: | 12.0% (1,627,633) |
Number of households with income $100k - 125k:| Ross Valley: | 8.6% (9,161) |
| California: | 10.0% (1,358,619) |
Number of households with income $125k - 150k:| Ross Valley: | 5.0% (5,274) |
| California: | 7.6% (1,027,455) |
Number of households with income $150k - 200k:| Ross Valley: | 11.6% (12,378) |
| State: | 10.6% (1,439,811) |
Number of households with income > $200k:| Ross Valley: | 35.6% (37,907) |
| California: | 18.0% (2,445,491) |
Aggregate household income in Ross Valley in 2022: $22,237,640,700
Median family income in Ross Valley in 2022:| Ross Valley: | $202,639 |
| California: | $104,823 |
Median non-family income in Ross Valley in 2022:| Ross Valley: | $71,999 |
| State: | $59,348 |
Change in median non-family income between 2000 and 2022:| Ross Valley, California: | +44.5% |
| California: | +85.3% |
Median per capita income in Ross Valley in 2022:| Ross Valley: | $89,506 |
| California: | $46,661 |
Change in median per capita income between 2000 and 2022:| Ross Valley, California: | +95.0% |
| State: | +105.5% |
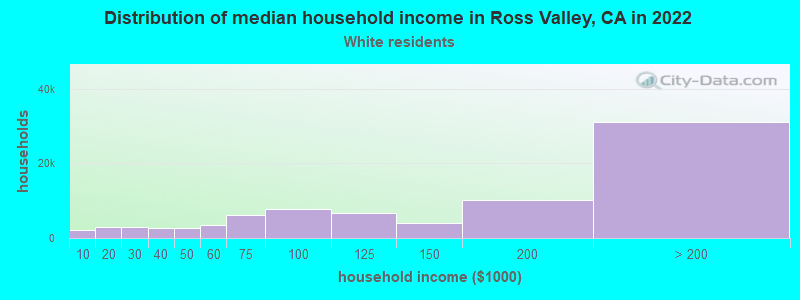
Income statistics for White residents
Median household income in Ross Valley, CA in 2022:| Ross Valley: | $150,556 |
| State: | $100,917 |
Change in median household income between 2000 and 2022:| Ross Valley, California: | +102.2% |
| State: | +96.8% |
Number of households with income < $10k:| Ross Valley: | 2.6% (2,175) |
| State: | 4.4% (284,109) |
Number of households with income $10k - 20k:| Ross Valley: | 3.6% (2,998) |
| California: | 5.3% (340,330) |
Number of households with income $20k - 30k:| Ross Valley: | 3.5% (2,873) |
| State: | 5.3% (343,145) |
Number of households with income $30k - 40k:| Ross Valley: | 3.4% (2,803) |
| State: | 5.1% (330,146) |
Number of households with income $40k - 50k:| Ross Valley: | 3.2% (2,671) |
| State: | 5.2% (335,310) |
Number of households with income $50k - 60k:| Ross Valley: | 4.3% (3,541) |
| State: | 5.1% (326,299) |
Number of households with income $60k - 75k:| Ross Valley: | 7.3% (6,081) |
| California: | 7.6% (487,640) |
Number of households with income $75k - 100k:| Ross Valley: | 9.4% (7,792) |
| State: | 11.5% (736,578) |
Number of households with income $100k - 125k:| Ross Valley: | 8.0% (6,663) |
| State: | 10.1% (648,782) |
Number of households with income $125k - 150k:| Ross Valley: | 4.7% (3,917) |
| California: | 7.8% (499,671) |
Number of households with income $150k - 200k:| Ross Valley: | 12.4% (10,292) |
| State: | 11.4% (729,603) |
Number of households with income > $200k:| Ross Valley: | 37.5% (31,123) |
| California: | 21.2% (1,364,246) |
Aggregate household income in Ross Valley in 2022: $18,780,577,400
Median family income in Ross Valley in 2022:| Ross Valley: | $216,413 |
| State: | $125,379 |
Number of families with income < $10k:| Ross Valley: | 0.2% (30) |
| State: | 2.2% (87,079) |
Number of families with income $10k - 20k:| Ross Valley: | 0.8% (103) |
| State: | 2.5% (97,716) |
Number of families with income $20k - 30k:| Ross Valley: | 1.0% (132) |
| State: | 3.5% (137,295) |
Number of families with income $30k - 40k:| Ross Valley: | 1.3% (172) |
| State: | 3.9% (152,947) |
Number of families with income $40k - 50k:| Ross Valley: | 2.4% (306) |
| California: | 4.3% (169,197) |
Number of families with income $50k - 60k:| Ross Valley: | 1.8% (239) |
| State: | 4.5% (176,192) |
Number of families with income $60k - 75k:| Ross Valley: | 6.5% (846) |
| California: | 7.0% (274,752) |
Number of families with income $75k - 100k:| Ross Valley: | 6.3% (818) |
| State: | 11.3% (445,632) |
Number of families with income $100k - 125k:| Ross Valley: | 6.7% (871) |
| State: | 10.7% (423,630) |
Number of families with income $125k - 150k:| Ross Valley: | 3.8% (489) |
| California: | 9.1% (357,408) |
Number of families with income $150k - 200k:| Ross Valley: | 14.7% (1,896) |
| State: | 13.5% (532,693) |
Number of families with income > $200k:| Ross Valley: | 54.4% (7,035) |
| State: | 27.6% (1,086,948) |
Median non-family income in Ross Valley in 2022:| Ross Valley: | $71,787 |
| State: | $62,819 |
Change in median non-family income between 2000 and 2022:| Ross Valley, California: | +45.7% |
| State: | +84.4% |
Median per capita income in Ross Valley in 2022:| Ross Valley: | $106,465 |
| State: | $61,706 |
Change in median per capita income between 2000 and 2022:| Ross Valley, California: | +114.8% |
| California: | +122.7% |
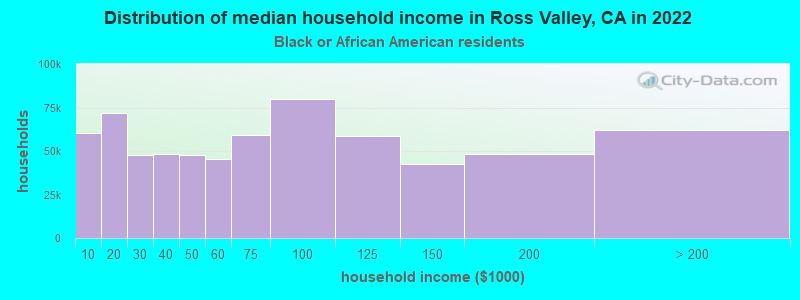
Income statistics for Black or African American residents
Median household income in Ross Valley, CA in 2022:| Ross Valley: | $137,395 |
| California: | $63,268 |
Change in median household income between 2000 and 2022:| Ross Valley, California: | +137.8% |
| California: | +81.0% |
Number of households with income < $10k:| Ross Valley: | 9.0% (60,484) |
| State: | 9.0% (73,219) |
Number of households with income $10k - 20k:| Ross Valley: | 10.6% (71,589) |
| California: | 10.6% (86,666) |
Number of households with income $20k - 30k:| Ross Valley: | 7.1% (47,672) |
| State: | 7.1% (57,719) |
Number of households with income $30k - 40k:| Ross Valley: | 7.2% (48,537) |
| State: | 7.2% (58,714) |
Number of households with income $40k - 50k:| Ross Valley: | 7.1% (47,948) |
| California: | 7.1% (58,075) |
Number of households with income $50k - 60k:| Ross Valley: | 6.8% (45,665) |
| State: | 6.8% (55,229) |
Number of households with income $60k - 75k:| Ross Valley: | 8.8% (59,342) |
| State: | 8.8% (71,895) |
Number of households with income $75k - 100k:| Ross Valley: | 11.9% (80,028) |
| State: | 11.9% (96,893) |
Number of households with income $100k - 125k:| Ross Valley: | 8.7% (58,369) |
| State: | 8.7% (70,729) |
Number of households with income $125k - 150k:| Ross Valley: | 6.3% (42,322) |
| State: | 6.3% (51,211) |
Number of households with income $150k - 200k:| Ross Valley: | 7.2% (48,480) |
| State: | 7.2% (58,687) |
Number of households with income > $200k:| Ross Valley: | 9.3% (62,308) |
| California: | 9.3% (75,487) |
Aggregate household income in Ross Valley in 2022: $18,933,023
Median family income in Ross Valley in 2022:| Ross Valley: | $187,251 |
| California: | $77,263 |
Number of families with income $10k - 20k:| Ross Valley: | 1.4% (2) |
| California: | 6.4% (29,505) |
Number of families with income $20k - 30k:| Ross Valley: | 3.3% (6) |
| State: | 5.6% (25,755) |
Number of families with income $40k - 50k:| Ross Valley: | 23.7% (41) |
| State: | 8.3% (38,171) |
Number of families with income $50k - 60k:| Ross Valley: | 7.4% (13) |
| California: | 7.0% (31,860) |
Number of families with income $60k - 75k:| Ross Valley: | 3.8% (7) |
| California: | 8.7% (40,021) |
Number of families with income $75k - 100k:| Ross Valley: | 5.6% (10) |
| State: | 12.4% (56,846) |
Number of families with income $100k - 125k:| Ross Valley: | 30.8% (54) |
| California: | 9.8% (44,911) |
Number of families with income $125k - 150k:| Ross Valley: | 8.1% (14) |
| State: | 7.5% (34,434) |
Number of families with income $150k - 200k:| Ross Valley: | 15.7% (28) |
| State: | 9.3% (42,807) |
Median non-family income in Ross Valley in 2022:| Ross Valley: | $88,482 |
| State: | $41,942 |
Change in median non-family income between 2000 and 2022:| Ross Valley, California: | +89.8% |
| State: | +72.0% |
Median per capita income in Ross Valley in 2022:| Ross Valley: | $20,587 |
| State: | $36,708 |
Change in median per capita income between 2000 and 2022:| Ross Valley, California: | +119.3% |
| California: | +110.4% |
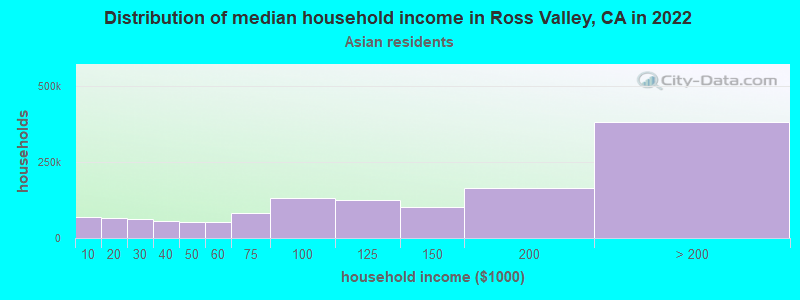
Income statistics for Asian residents
Median household income in Ross Valley, CA in 2022:| Ross Valley: | $174,747 |
| State: | $119,861 |
Change in median household income between 2000 and 2022:| Ross Valley, California: | +142.0% |
| State: | +116.5% |
Number of households with income < $10k:| Ross Valley: | 5.1% (69,285) |
| State: | 5.1% (106,273) |
Number of households with income $10k - 20k:| Ross Valley: | 4.9% (66,410) |
| State: | 4.9% (101,815) |
Number of households with income $20k - 30k:| Ross Valley: | 4.6% (61,555) |
| California: | 4.6% (94,414) |
Number of households with income $30k - 40k:| Ross Valley: | 4.1% (55,100) |
| California: | 4.1% (84,491) |
Number of households with income $40k - 50k:| Ross Valley: | 4.0% (53,308) |
| State: | 4.0% (81,758) |
Number of households with income $50k - 60k:| Ross Valley: | 3.9% (52,771) |
| State: | 3.9% (80,971) |
Number of households with income $60k - 75k:| Ross Valley: | 6.0% (80,965) |
| State: | 6.0% (124,194) |
Number of households with income $75k - 100k:| Ross Valley: | 9.7% (130,670) |
| California: | 9.7% (200,337) |
Number of households with income $100k - 125k:| Ross Valley: | 9.4% (126,147) |
| State: | 9.4% (193,488) |
Number of households with income $125k - 150k:| Ross Valley: | 7.7% (103,200) |
| California: | 7.7% (158,253) |
Number of households with income $150k - 200k:| Ross Valley: | 12.2% (164,377) |
| State: | 12.2% (252,139) |
Number of households with income > $200k:| Ross Valley: | 28.4% (382,423) |
| State: | 28.4% (586,641) |
Aggregate household income in Ross Valley in 2022: $191,940,562
Median family income in Ross Valley in 2022:| Ross Valley: | $202,079 |
| State: | $136,040 |
Number of families with income < $10k:| Ross Valley: | 1.0% (9) |
| State: | 2.8% (42,046) |
Number of families with income $10k - 20k:| Ross Valley: | 1.6% (15) |
| State: | 3.1% (46,821) |
Number of families with income $20k - 30k:| Ross Valley: | 1.7% (16) |
| California: | 4.1% (61,519) |
Number of families with income $30k - 40k:| Ross Valley: | 2.6% (25) |
| State: | 3.7% (55,234) |
Number of families with income $40k - 50k:| Ross Valley: | 0.8% (7) |
| State: | 3.9% (58,471) |
Number of families with income $50k - 60k:| Ross Valley: | 6.4% (60) |
| State: | 3.9% (58,911) |
Number of families with income $60k - 75k:| Ross Valley: | 7.0% (66) |
| State: | 5.9% (88,675) |
Number of families with income $75k - 100k:| Ross Valley: | 7.4% (69) |
| California: | 9.5% (143,103) |
Number of families with income $100k - 125k:| Ross Valley: | 10.1% (95) |
| State: | 9.4% (142,085) |
Number of families with income $125k - 150k:| Ross Valley: | 6.1% (57) |
| State: | 8.0% (120,635) |
Number of families with income $150k - 200k:| Ross Valley: | 15.3% (144) |
| State: | 13.2% (198,099) |
Number of families with income > $200k:| Ross Valley: | 39.8% (374) |
| State: | 32.5% (489,303) |
Median non-family income in Ross Valley in 2022:| Ross Valley: | $130,974 |
| California: | $74,216 |
Change in median non-family income between 2000 and 2022:| Ross Valley, California: | +114.1% |
| California: | +136.3% |
Median per capita income in Ross Valley in 2022:| Ross Valley: | $75,616 |
| State: | $58,824 |
Change in median per capita income between 2000 and 2022:| Ross Valley, California: | +100.0% |
| California: | +166.8% |
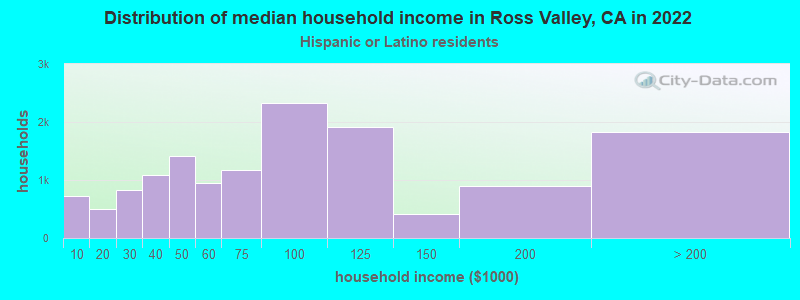
Income statistics for Hispanic or Latino residents
Median household income in Ross Valley, CA in 2022:| Ross Valley: | $106,155 |
| State: | $75,698 |
Change in median household income between 2000 and 2022:| Ross Valley, California: | +52.7% |
| State: | +107.2% |
Number of households with income < $10k:| Ross Valley: | 5.2% (728) |
| State: | 4.3% (183,294) |
Number of households with income $10k - 20k:| Ross Valley: | 3.5% (495) |
| State: | 6.0% (253,903) |
Number of households with income $20k - 30k:| Ross Valley: | 5.9% (835) |
| California: | 6.8% (286,386) |
Number of households with income $30k - 40k:| Ross Valley: | 7.7% (1,080) |
| California: | 7.4% (313,728) |
Number of households with income $40k - 50k:| Ross Valley: | 10.0% (1,411) |
| State: | 7.4% (313,199) |
Number of households with income $50k - 60k:| Ross Valley: | 6.7% (944) |
| California: | 7.2% (305,366) |
Number of households with income $60k - 75k:| Ross Valley: | 8.4% (1,178) |
| State: | 10.3% (434,937) |
Number of households with income $75k - 100k:| Ross Valley: | 16.6% (2,332) |
| State: | 14.4% (607,302) |
Number of households with income $100k - 125k:| Ross Valley: | 13.7% (1,920) |
| California: | 10.6% (447,424) |
Number of households with income $125k - 150k:| Ross Valley: | 2.9% (408) |
| State: | 7.5% (316,022) |
Number of households with income $150k - 200k:| Ross Valley: | 6.4% (901) |
| State: | 9.2% (386,269) |
Number of households with income > $200k:| Ross Valley: | 13.0% (1,830) |
| State: | 8.8% (372,651) |
Aggregate household income in Ross Valley in 2022: $179,019,069
Median family income in Ross Valley in 2022:| Ross Valley: | $119,150 |
| State: | $77,589 |
Number of families with income < $10k:| Ross Valley: | 6.6% (119) |
| California: | 3.9% (129,468) |
Number of families with income $10k - 20k:| Ross Valley: | 5.6% (102) |
| State: | 4.6% (151,997) |
Number of families with income $20k - 30k:| Ross Valley: | 4.4% (81) |
| California: | 6.6% (216,764) |
Number of families with income $30k - 40k:| Ross Valley: | 7.2% (130) |
| State: | 7.6% (249,849) |
Number of families with income $40k - 50k:| Ross Valley: | 6.8% (123) |
| State: | 7.7% (254,822) |
Number of families with income $50k - 60k:| Ross Valley: | 6.8% (124) |
| California: | 7.4% (244,815) |
Number of families with income $60k - 75k:| Ross Valley: | 7.1% (128) |
| State: | 10.5% (345,838) |
Number of families with income $75k - 100k:| Ross Valley: | 22.2% (402) |
| State: | 14.9% (491,589) |
Number of families with income $100k - 125k:| Ross Valley: | 6.5% (117) |
| California: | 10.7% (355,400) |
Number of families with income $125k - 150k:| Ross Valley: | 3.3% (60) |
| California: | 7.8% (259,317) |
Number of families with income $150k - 200k:| Ross Valley: | 5.4% (97) |
| California: | 9.3% (306,566) |
Number of families with income > $200k:| Ross Valley: | 18.1% (327) |
| State: | 9.1% (299,984) |
Median non-family income in Ross Valley in 2022:| Ross Valley: | $66,236 |
| State: | $49,746 |
Change in median non-family income between 2000 and 2022:| Ross Valley, California: | +31.8% |
| State: | +100.7% |
Median per capita income in Ross Valley in 2022:| Ross Valley: | $37,510 |
| California: | $27,240 |
Change in median per capita income between 2000 and 2022:| Ross Valley, California: | +96.5% |
| California: | +133.3% |
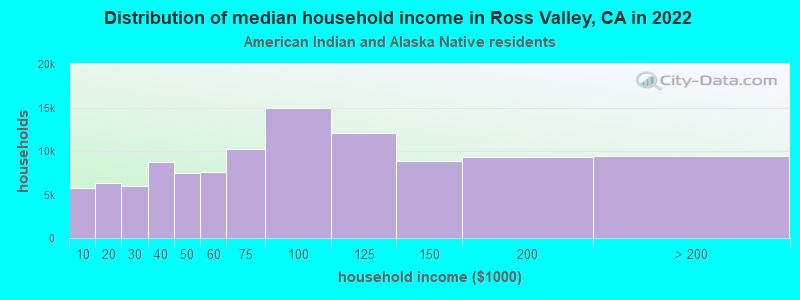
Income statistics for American Indian and Alaska Native residents
Median household income in Ross Valley, CA in 2022:| Ross Valley: | $97,846 |
| State: | $76,752 |
Change in median household income between 2000 and 2022:| Ross Valley, California: | +95.7% |
| State: | +110.0% |
Number of households with income < $10k:| Ross Valley: | 5.4% (5,769) |
| State: | 5.4% (8,471) |
Number of households with income $10k - 20k:| Ross Valley: | 6.0% (6,366) |
| California: | 6.0% (9,381) |
Number of households with income $20k - 30k:| Ross Valley: | 5.6% (5,980) |
| State: | 5.5% (8,668) |
Number of households with income $30k - 40k:| Ross Valley: | 8.2% (8,773) |
| California: | 8.3% (13,030) |
Number of households with income $40k - 50k:| Ross Valley: | 7.0% (7,424) |
| State: | 6.9% (10,908) |
Number of households with income $50k - 60k:| Ross Valley: | 7.1% (7,588) |
| California: | 7.1% (11,198) |
Number of households with income $60k - 75k:| Ross Valley: | 9.6% (10,249) |
| State: | 9.6% (15,190) |
Number of households with income $75k - 100k:| Ross Valley: | 14.0% (14,971) |
| California: | 14.1% (22,274) |
Number of households with income $100k - 125k:| Ross Valley: | 11.3% (12,028) |
| State: | 11.2% (17,643) |
Number of households with income $125k - 150k:| Ross Valley: | 8.3% (8,813) |
| State: | 8.3% (13,117) |
Number of households with income $150k - 200k:| Ross Valley: | 8.8% (9,366) |
| State: | 8.8% (13,853) |
Number of households with income > $200k:| Ross Valley: | 8.8% (9,404) |
| California: | 8.8% (13,925) |
Aggregate household income in Ross Valley in 2022: $3,434,429
Median family income in Ross Valley in 2022:| Ross Valley: | $102,482 |
| State: | $81,108 |
Number of families with income $30k - 40k:| Ross Valley: | 24.4% (6) |
| State: | 8.8% (9,994) |
Number of families with income $60k - 75k:| Ross Valley: | 27.8% (7) |
| California: | 9.1% (10,247) |
Number of families with income $75k - 100k:| Ross Valley: | 47.8% (12) |
| California: | 14.8% (16,731) |
Median per capita income in Ross Valley in 2022:| Ross Valley: | $68,452 |
| State: | $30,289 |
Change in median per capita income between 2000 and 2022:| Ross Valley, California: | +11.8% |
| California: | +98.9% |
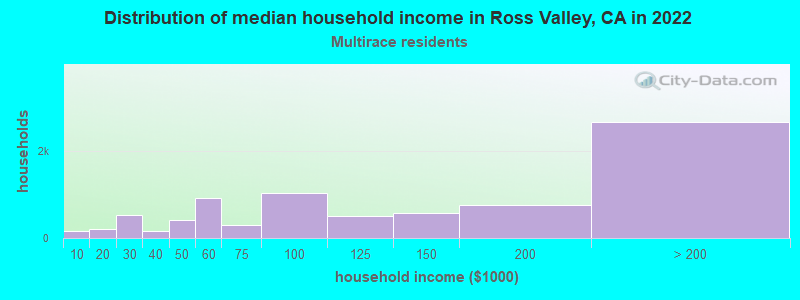
Income statistics for Multirace residents
Median household income in Ross Valley, CA in 2022:| Ross Valley: | $131,643 |
| State: | $83,153 |
Change in median household income between 2000 and 2022:| Ross Valley, California: | +131.5% |
| State: | +106.0% |
Number of households with income < $10k:| Ross Valley: | 1.9% (153) |
| California: | 4.2% (85,299) |
Number of households with income $10k - 20k:| Ross Valley: | 2.7% (218) |
| State: | 6.1% (122,966) |
Number of households with income $20k - 30k:| Ross Valley: | 6.5% (533) |
| California: | 6.4% (129,328) |
Number of households with income $30k - 40k:| Ross Valley: | 2.0% (161) |
| State: | 6.4% (130,070) |
Number of households with income $40k - 50k:| Ross Valley: | 4.9% (403) |
| California: | 6.5% (131,254) |
Number of households with income $50k - 60k:| Ross Valley: | 11.2% (920) |
| State: | 6.5% (132,382) |
Number of households with income $60k - 75k:| Ross Valley: | 3.6% (293) |
| State: | 9.4% (191,472) |
Number of households with income $75k - 100k:| Ross Valley: | 12.6% (1,035) |
| State: | 13.3% (269,691) |
Number of households with income $100k - 125k:| Ross Valley: | 6.1% (499) |
| California: | 10.2% (207,286) |
Number of households with income $125k - 150k:| Ross Valley: | 6.9% (566) |
| State: | 7.8% (158,259) |
Number of households with income $150k - 200k:| Ross Valley: | 9.2% (757) |
| State: | 10.3% (209,227) |
Number of households with income > $200k:| Ross Valley: | 32.5% (2,664) |
| California: | 13.0% (263,210) |
Aggregate household income in Ross Valley in 2022: $362,287,947
Median family income in Ross Valley in 2022:| Ross Valley: | $111,452 |
| State: | $87,642 |
Number of families with income $10k - 20k:| Ross Valley: | 1.9% (39) |
| State: | 4.1% (60,419) |
Number of families with income $20k - 30k:| Ross Valley: | 4.7% (99) |
| State: | 6.1% (89,742) |
Number of families with income $30k - 40k:| Ross Valley: | 7.1% (149) |
| State: | 6.2% (91,415) |
Number of families with income $40k - 50k:| Ross Valley: | 3.9% (81) |
| State: | 6.8% (100,085) |
Number of families with income $50k - 60k:| Ross Valley: | 3.6% (76) |
| State: | 6.7% (98,298) |
Number of families with income $60k - 75k:| Ross Valley: | 4.6% (96) |
| State: | 9.5% (140,131) |
Number of families with income $75k - 100k:| Ross Valley: | 10.0% (209) |
| California: | 13.8% (203,439) |
Number of families with income $100k - 125k:| Ross Valley: | 2.8% (59) |
| State: | 10.4% (153,515) |
Number of families with income $125k - 150k:| Ross Valley: | 9.4% (196) |
| State: | 8.4% (124,115) |
Number of families with income $150k - 200k:| Ross Valley: | 19.5% (408) |
| State: | 10.9% (161,643) |
Number of families with income > $200k:| Ross Valley: | 32.6% (682) |
| California: | 14.0% (207,317) |
Median non-family income in Ross Valley in 2022:| Ross Valley: | $106,416 |
| State: | $56,558 |
Change in median non-family income between 2000 and 2022:| Ross Valley, California: | +64.2% |
| California: | +100.2% |
Median per capita income in Ross Valley in 2022:| Ross Valley: | $56,184 |
| State: | $32,124 |
Income statistics for other residents
Number of households with income < $10k:| Ross Valley: | 5.8% (39) |
| State: | 4.6% (93,035) |
Number of households with income $10k - 20k:| Ross Valley: | 6.3% (42) |
| State: | 6.3% (126,222) |
Number of households with income $20k - 30k:| Ross Valley: | 2.1% (14) |
| State: | 7.1% (142,656) |
Number of households with income $30k - 40k:| Ross Valley: | 11.8% (79) |
| State: | 8.2% (165,018) |
Number of households with income $40k - 50k:| Ross Valley: | 13.9% (93) |
| California: | 8.0% (161,732) |
Number of households with income $50k - 60k:| Ross Valley: | 1.3% (9) |
| State: | 7.6% (152,152) |
Number of households with income $60k - 75k:| Ross Valley: | 7.6% (51) |
| State: | 10.4% (209,951) |
Number of households with income $75k - 100k:| Ross Valley: | 14.4% (96) |
| State: | 14.7% (296,102) |
Number of households with income $100k - 125k:| Ross Valley: | 20.2% (135) |
| State: | 10.7% (214,281) |
Number of households with income $125k - 150k:| Ross Valley: | 2.4% (16) |
| State: | 7.1% (143,092) |
Number of households with income $150k - 200k:| Ross Valley: | 6.3% (42) |
| State: | 8.6% (172,215) |
Number of households with income > $200k:| Ross Valley: | 7.8% (52) |
| State: | 6.7% (134,102) |
Aggregate household income in Ross Valley in 2022: $65,172,871
Median family income in Ross Valley in 2022:| Ross Valley: | $113,040 |
| State: | $72,756 |
Number of families with income < $10k:| Ross Valley: | 0.9% (6) |
| State: | 4.3% (69,090) |
Number of families with income $10k - 20k:| Ross Valley: | 1.7% (12) |
| State: | 5.1% (82,116) |
Number of families with income $20k - 30k:| Ross Valley: | 0.7% (5) |
| California: | 7.0% (112,854) |
Number of families with income $30k - 40k:| Ross Valley: | 1.9% (14) |
| State: | 8.4% (135,938) |
Number of families with income $40k - 50k:| Ross Valley: | 4.0% (28) |
| State: | 8.4% (135,353) |
Number of families with income $50k - 60k:| Ross Valley: | 4.5% (32) |
| State: | 7.7% (124,826) |
Number of families with income $60k - 75k:| Ross Valley: | 4.8% (34) |
| State: | 10.7% (173,628) |
Number of families with income $75k - 100k:| Ross Valley: | 19.7% (140) |
| California: | 15.2% (245,724) |
Number of families with income $100k - 125k:| Ross Valley: | 8.2% (58) |
| State: | 10.9% (176,716) |
Number of families with income $125k - 150k:| Ross Valley: | 20.1% (143) |
| California: | 7.4% (119,985) |
Number of families with income $150k - 200k:| Ross Valley: | 33.3% (237) |
| State: | 8.5% (137,332) |
Median non-family income in Ross Valley in 2022:| Ross Valley: | $48,026 |
| State: | $43,881 |
Change in median non-family income between 2000 and 2022:| Ross Valley, California: | +16.4% |
| State: | +84.6% |
Median per capita income in Ross Valley in 2022:| Ross Valley: | $40,944 |
| State: | $25,164 |
Change in median per capita income between 2000 and 2022:| Ross Valley, California: | +105.3% |
| California: | +137.9% |