The median household income in Robinwood, MD in 2022 was $80,516, which was 18.0% less than the median annual income of $94,991 across the entire state of Maryland. Compared to the median income of $50,615 in 2000 this represents an increase of 37.1%. The per capita income in 2022 was $38,825, which means an increase of 31.5% compared to 2000 when it was $26,608.
Whole page based on the data from 2000 / 2022 when the population of Robinwood, Maryland was 4,731 / 8,051
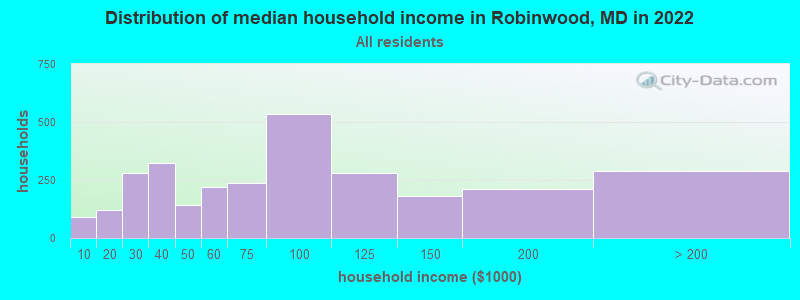
Income statistics for all residents
Median household income in Robinwood, MD in 2022:
Robinwood:
$80,517
State:
$94,991
Change in median household income between 2000 and 2022:
Robinwood, Maryland:
+59.1%
State:
+79.7%
Number of households with income < $10k:
Robinwood:
3.1% (89)
State:
4.8% (114,450)
Number of households with income $10k - 20k:
Robinwood:
4.1% (119)
State:
5.0% (117,883)
Number of households with income $20k - 30k:
Robinwood:
9.7% (282)
State:
5.2% (123,350)
Number of households with income $30k - 40k:
Robinwood:
11.2% (325)
State:
5.6% (134,104)
Number of households with income $40k - 50k:
Robinwood:
4.9% (142)
State:
5.6% (132,932)
Number of households with income $50k - 60k:
Robinwood:
7.6% (220)
State:
5.6% (132,707)
Number of households with income $60k - 75k:
Robinwood:
8.1% (236)
State:
7.9% (188,335)
Number of households with income $75k - 100k:
Robinwood:
18.3% (533)
Maryland:
12.5% (297,873)
Number of households with income $100k - 125k:
Robinwood:
9.7% (281)
Maryland:
10.5% (250,497)
Number of households with income $125k - 150k:
Robinwood:
6.3% (183)
State:
8.1% (193,208)
Number of households with income $150k - 200k:
Robinwood:
7.2% (211)
State:
11.6% (274,905)
Number of households with income > $200k:
Robinwood:
10.0% (290)
State:
17.5% (415,740)
Aggregate household income in Robinwood in 2022: $285,235,523
Median family income in Robinwood in 2022:
Robinwood:
$94,185
Maryland:
$117,294
Number of families with income < $10k:
Robinwood:
1.1% (21)
State:
2.7% (41,433)
Number of families with income $10k - 20k:
Robinwood:
4.4% (86)
State:
2.6% (40,126)
Number of families with income $20k - 30k:
Robinwood:
6.0% (116)
State:
3.4% (52,891)
Number of families with income $30k - 40k:
Robinwood:
9.0% (174)
State:
4.5% (70,252)
Number of families with income $40k - 50k:
Robinwood:
3.0% (58)
State:
4.8% (74,112)
Number of families with income $50k - 60k:
Robinwood:
7.4% (143)
State:
5.0% (77,590)
Number of families with income $60k - 75k:
Robinwood:
10.7% (208)
State:
7.1% (109,924)
Number of families with income $75k - 100k:
Robinwood:
14.7% (286)
State:
12.0% (185,255)
Number of families with income $100k - 125k:
Robinwood:
13.0% (252)
State:
11.2% (173,203)
Number of families with income $125k - 150k:
Robinwood:
6.3% (123)
State:
9.3% (143,453)
Number of families with income $150k - 200k:
Robinwood:
10.5% (203)
State:
14.2% (218,861)
Number of families with income > $200k:
Robinwood:
14.0% (271)
Maryland:
23.2% (359,182)
Median non-family income in Robinwood in 2022:
Robinwood:
$45,873
State:
$57,179
Change in median non-family income between 2000 and 2022:
Robinwood, Maryland:
+78.6%
Maryland:
+75.1%
Median per capita income in Robinwood in 2022:
Robinwood:
$38,826
State:
$49,236
Change in median per capita income between 2000 and 2022:
Robinwood, Maryland:
+45.9%
State:
+92.2%
Income statistics for White residents
Median household income in Robinwood, MD in 2022:
Robinwood:
$83,999
State:
$107,160
Change in median household income between 2000 and 2022:
Robinwood, Maryland:
+64.0%
State:
+85.3%
Number of households with income < $10k:
Robinwood:
4.0% (83)
Maryland:
3.7% (47,387)
Number of households with income $10k - 20k:
Robinwood:
2.6% (53)
Maryland:
4.1% (52,102)
Number of households with income $20k - 30k:
Robinwood:
6.9% (143)
State:
4.6% (58,758)
Number of households with income $30k - 40k:
Robinwood:
10.7% (222)
Maryland:
4.7% (59,745)
Number of households with income $40k - 50k:
Robinwood:
5.6% (116)
Maryland:
5.0% (62,576)
Number of households with income $50k - 60k:
Robinwood:
9.1% (189)
State:
5.1% (64,484)
Number of households with income $60k - 75k:
Robinwood:
5.5% (114)
Maryland:
7.7% (97,019)
Number of households with income $75k - 100k:
Robinwood:
20.5% (423)
Maryland:
11.8% (149,205)
Number of households with income $100k - 125k:
Robinwood:
13.7% (284)
State:
10.6% (134,231)
Number of households with income $125k - 150k:
Robinwood:
7.0% (144)
State:
8.8% (111,081)
Number of households with income $150k - 200k:
Robinwood:
8.4% (173)
State:
12.9% (162,966)
Number of households with income > $200k:
Robinwood:
6.0% (123)
Maryland:
20.9% (264,377)
Aggregate household income in Robinwood in 2022: $186,786,448
Median family income in Robinwood in 2022:
Robinwood:
$88,823
Maryland:
$134,708
Number of families with income < $10k:
Robinwood:
1.4% (19)
State:
1.6% (13,064)
Number of families with income $10k - 20k:
Robinwood:
6.3% (86)
State:
2.0% (16,048)
Number of families with income $30k - 40k:
Robinwood:
6.6% (91)
State:
3.3% (26,886)
Number of families with income $40k - 50k:
Robinwood:
4.2% (58)
Maryland:
3.6% (29,194)
Number of families with income $50k - 60k:
Robinwood:
11.2% (153)
State:
4.1% (33,120)
Number of families with income $60k - 75k:
Robinwood:
6.9% (94)
Maryland:
6.6% (53,501)
Number of families with income $75k - 100k:
Robinwood:
19.4% (265)
State:
11.3% (91,779)
Number of families with income $100k - 125k:
Robinwood:
18.1% (247)
State:
11.3% (91,483)
Number of families with income $125k - 150k:
Robinwood:
7.2% (98)
State:
9.9% (80,832)
Number of families with income $150k - 200k:
Robinwood:
12.0% (165)
State:
16.0% (130,295)
Number of families with income > $200k:
Robinwood:
6.6% (91)
State:
28.1% (228,324)
Median non-family income in Robinwood in 2022:
Robinwood:
$41,268
Maryland:
$61,991
Change in median non-family income between 2000 and 2022:
Robinwood, Maryland:
+83.8%
State:
+76.8%
Median per capita income in Robinwood in 2022:
Robinwood:
$40,677
State:
$59,750
Change in median per capita income between 2000 and 2022:
Robinwood, Maryland:
+44.3%
State:
+104.5%
Income statistics for Black or African American residents
Median household income in Robinwood, MD in 2022:
Robinwood:
$76,179
Maryland:
$77,368
Change in median household income between 2000 and 2022:
Robinwood, Maryland:
+25.1%
Maryland:
+85.7%
Number of households with income < $10k:
Robinwood:
0.0% (0)
Maryland:
7.0% (50,093)
Number of households with income $10k - 20k:
Robinwood:
12.8% (60)
State:
7.2% (51,849)
Number of households with income $20k - 30k:
Robinwood:
18.8% (88)
Maryland:
5.8% (41,510)
Number of households with income $30k - 40k:
Robinwood:
7.3% (34)
State:
6.9% (49,466)
Number of households with income $40k - 50k:
Robinwood:
0.0% (0)
State:
6.6% (47,557)
Number of households with income $50k - 60k:
Robinwood:
6.6% (31)
State:
6.2% (44,818)
Number of households with income $60k - 75k:
Robinwood:
14.1% (66)
State:
8.6% (61,728)
Number of households with income $75k - 100k:
Robinwood:
12.0% (56)
Maryland:
13.2% (95,107)
Number of households with income $100k - 125k:
Robinwood:
1.1% (5)
Maryland:
10.2% (73,579)
Number of households with income $125k - 150k:
Robinwood:
0.0% (0)
State:
7.2% (51,970)
Number of households with income $150k - 200k:
Robinwood:
0.0% (0)
State:
9.4% (67,623)
Number of households with income > $200k:
Robinwood:
27.4% (128)
State:
11.7% (83,862)
Aggregate household income in Robinwood in 2022: $50,830,996
Median per capita income in Robinwood in 2022:
Robinwood:
$35,666
Maryland:
$40,756
Change in median per capita income between 2000 and 2022:
Robinwood, Maryland:
+107.6%
State:
+113.5%
Income statistics for Asian residents
Number of households with income < $10k:
Robinwood:
0.0% (0)
State:
4.6% (6,395)
Number of households with income $10k - 20k:
Robinwood:
0.0% (0)
State:
3.6% (4,994)
Number of households with income $20k - 30k:
Robinwood:
0.0% (0)
Maryland:
4.6% (6,399)
Number of households with income $30k - 40k:
Robinwood:
0.0% (0)
Maryland:
3.4% (4,682)
Number of households with income $40k - 50k:
Robinwood:
0.0% (0)
State:
4.6% (6,382)
Number of households with income $50k - 60k:
Robinwood:
0.0% (0)
State:
4.6% (6,402)
Number of households with income $60k - 75k:
Robinwood:
19.8% (21)
State:
5.4% (7,426)
Number of households with income $75k - 100k:
Robinwood:
0.0% (0)
State:
11.1% (15,313)
Number of households with income $100k - 125k:
Robinwood:
0.0% (0)
Maryland:
10.6% (14,640)
Number of households with income $125k - 150k:
Robinwood:
0.0% (0)
Maryland:
8.3% (11,465)
Number of households with income $150k - 200k:
Robinwood:
31.1% (33)
State:
13.4% (18,490)
Number of households with income > $200k:
Robinwood:
49.1% (52)
Maryland:
25.6% (35,377)
Aggregate household income in Robinwood in 2022: $31,094,686
Median per capita income in Robinwood in 2022:
Robinwood:
$151,547
State:
$53,546
Income statistics for Hispanic or Latino residents
Median household income in Robinwood, MD in 2022:
Robinwood:
$203,182
Maryland:
$82,138
Number of households with income < $10k:
Robinwood:
0.0% (0)
State:
3.7% (6,871)
Number of households with income $10k - 20k:
Robinwood:
0.0% (0)
Maryland:
2.9% (5,465)
Number of households with income $20k - 30k:
Robinwood:
0.0% (0)
Maryland:
5.9% (11,012)
Number of households with income $30k - 40k:
Robinwood:
20.3% (31)
Maryland:
7.9% (14,668)
Number of households with income $40k - 50k:
Robinwood:
0.0% (0)
State:
7.6% (14,074)
Number of households with income $50k - 60k:
Robinwood:
0.0% (0)
State:
7.6% (14,166)
Number of households with income $60k - 75k:
Robinwood:
0.0% (0)
State:
9.9% (18,486)
Number of households with income $75k - 100k:
Robinwood:
27.5% (42)
Maryland:
16.1% (30,032)
Number of households with income $100k - 125k:
Robinwood:
0.0% (0)
State:
9.4% (17,432)
Number of households with income $125k - 150k:
Robinwood:
0.0% (0)
State:
7.5% (13,963)
Number of households with income $150k - 200k:
Robinwood:
0.0% (0)
Maryland:
10.1% (18,750)
Number of households with income > $200k:
Robinwood:
52.3% (80)
Maryland:
11.4% (21,133)
Aggregate household income in Robinwood in 2022: $19,020,498
Median family income in Robinwood in 2022:
Robinwood:
$244,035
State:
$80,127
Number of families with income $30k - 40k:
Robinwood:
13.0% (18)
Maryland:
7.6% (11,123)
Number of families with income $60k - 75k:
Robinwood:
13.1% (18)
State:
10.2% (15,051)
Number of families with income $75k - 100k:
Robinwood:
16.0% (22)
State:
14.6% (21,440)
Number of families with income $125k - 150k:
Robinwood:
8.3% (11)
Maryland:
6.9% (10,202)
Number of families with income > $200k:
Robinwood:
49.6% (67)
State:
11.6% (17,028)
Median per capita income in Robinwood in 2022:
Robinwood:
$12,551
State:
$29,024
Change in median per capita income between 2000 and 2022:
Robinwood, Maryland:
+12.9%
State:
+79.2%
Income statistics for American Indian and Alaska Native residents
Median per capita income in Robinwood in 2022:
Robinwood:
$69,862
Maryland:
$35,089
Income statistics for Multirace residents
Number of households with income < $10k:
Robinwood:
0.0% (0)
Maryland:
4.8% (6,469)
Number of households with income $10k - 20k:
Robinwood:
0.0% (0)
Maryland:
3.3% (4,464)
Number of households with income $20k - 30k:
Robinwood:
0.0% (0)
Maryland:
5.8% (7,826)
Number of households with income $30k - 40k:
Robinwood:
15.5% (30)
State:
8.1% (11,077)
Number of households with income $40k - 50k:
Robinwood:
0.0% (0)
State:
4.3% (5,895)
Number of households with income $50k - 60k:
Robinwood:
0.0% (0)
Maryland:
3.9% (5,346)
Number of households with income $60k - 75k:
Robinwood:
0.0% (0)
Maryland:
6.7% (9,159)
Number of households with income $75k - 100k:
Robinwood:
31.1% (60)
State:
13.6% (18,420)
Number of households with income $100k - 125k:
Robinwood:
0.0% (0)
State:
12.9% (17,488)
Number of households with income $125k - 150k:
Robinwood:
8.8% (17)
State:
8.1% (11,039)
Number of households with income $150k - 200k:
Robinwood:
0.0% (0)
State:
11.5% (15,675)
Number of households with income > $200k:
Robinwood:
44.6% (86)
State:
17.0% (23,059)
Aggregate household income in Robinwood in 2022: $32,888,913
Median family income in Robinwood in 2022:
Robinwood:
$215,618
Maryland:
$110,784
Number of families with income $30k - 40k:
Robinwood:
20.4% (34)
Maryland:
7.8% (7,382)
Number of families with income $75k - 100k:
Robinwood:
15.7% (26)
Maryland:
11.7% (11,110)
Number of families with income $125k - 150k:
Robinwood:
10.7% (18)
State:
9.0% (8,509)
Number of families with income > $200k:
Robinwood:
53.3% (89)
State:
20.9% (19,875)
Median per capita income in Robinwood in 2022:
Robinwood:
$12,963
State:
$35,630
Income statistics for other residents
Aggregate household income in Robinwood in 2022: $670,247
Median per capita income in Robinwood in 2022:
Robinwood:
$8,723
State:
$24,415
Change in median per capita income between 2000 and 2022:: -9.1%
Robinwood, Maryland:
-9.1%
State:
+73.6%
Discuss Robinwood, Maryland (MD) on our hugely popular Maryland forum.