Richmond, Rhode Island (RI) income map, earnings map, and wages data
The median household income in Richmond, RI in 2022 was $113,203, which was 27.7% greater than the median annual income of $81,854 across the entire state of Rhode Island. Compared to the median income of $59,840 in 2000 this represents an increase of 47.1%. The per capita income in 2022 was $45,905, which means an increase of 51.3% compared to 2000 when it was $22,351.
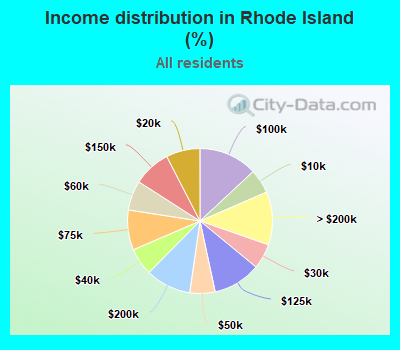
Income statistics for all residents
Median household income in Richmond, RI in 2022:| Richmond: | $113,204 |
| State: | $81,854 |
Change in median household income between 2000 and 2022:| Richmond, Rhode Island: | +89.2% |
| Rhode Island: | +94.5% |
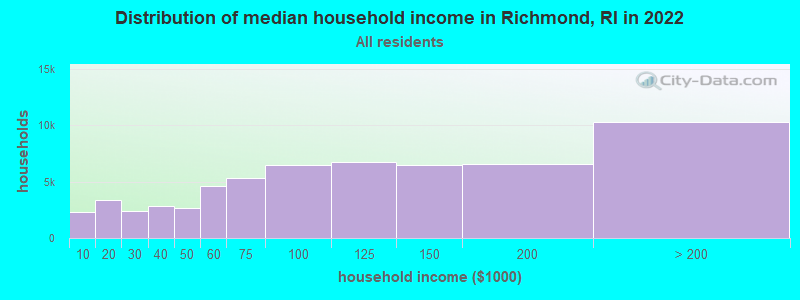
Number of households with income < $10k:| Richmond: | 3.8% (2,268) |
| State: | 5.4% (24,165) |
Number of households with income $10k - 20k:| Richmond: | 5.6% (3,353) |
| Rhode Island: | 7.6% (33,817) |
Number of households with income $20k - 30k:| Richmond: | 4.0% (2,392) |
| State: | 5.6% (25,137) |
Number of households with income $30k - 40k:| Richmond: | 4.8% (2,866) |
| State: | 6.1% (27,221) |
Number of households with income $40k - 50k:| Richmond: | 4.4% (2,629) |
| Rhode Island: | 5.6% (25,200) |
Number of households with income $50k - 60k:| Richmond: | 7.6% (4,580) |
| Rhode Island: | 6.6% (29,522) |
Number of households with income $60k - 75k:| Richmond: | 8.9% (5,309) |
| Rhode Island: | 8.9% (39,922) |
Number of households with income $75k - 100k:| Richmond: | 10.8% (6,441) |
| State: | 13.1% (58,406) |
Number of households with income $100k - 125k:| Richmond: | 11.3% (6,779) |
| Rhode Island: | 10.7% (47,690) |
Number of households with income $125k - 150k:| Richmond: | 10.8% (6,440) |
| State: | 8.4% (37,334) |
Number of households with income $150k - 200k:| Richmond: | 10.9% (6,528) |
| Rhode Island: | 10.1% (45,318) |
Number of households with income > $200k:| Richmond: | 17.2% (10,295) |
| State: | 11.9% (52,956) |
Aggregate household income in Richmond in 2022: $498,570,817
Median family income in Richmond in 2022:| Richmond: | $130,054 |
| Rhode Island: | $105,989 |
Median non-family income in Richmond in 2022:| Richmond: | $59,708 |
| State: | $48,459 |
Change in median non-family income between 2000 and 2022:| Richmond, Rhode Island: | +91.2% |
| State: | +105.7% |
Median per capita income in Richmond in 2022:| Richmond: | $45,906 |
| State: | $44,538 |
Change in median per capita income between 2000 and 2022:| Richmond, Rhode Island: | +105.4% |
| State: | +105.4% |
Income statistics for White residents
Median household income in Richmond, RI in 2022:| Richmond: | $114,881 |
| State: | $86,507 |
Change in median household income between 2000 and 2022:| Richmond, Rhode Island: | +92.7% |
| Rhode Island: | +93.9% |
Number of households with income < $10k:| Richmond: | 3.6% (1,943) |
| Rhode Island: | 4.1% (14,023) |
Number of households with income $10k - 20k:| Richmond: | 3.7% (2,017) |
| State: | 6.3% (21,775) |
Number of households with income $20k - 30k:| Richmond: | 4.1% (2,213) |
| State: | 5.6% (19,359) |
Number of households with income $30k - 40k:| Richmond: | 4.2% (2,278) |
| State: | 5.8% (20,001) |
Number of households with income $40k - 50k:| Richmond: | 4.5% (2,446) |
| State: | 5.8% (20,112) |
Number of households with income $50k - 60k:| Richmond: | 7.9% (4,248) |
| State: | 6.8% (23,542) |
Number of households with income $60k - 75k:| Richmond: | 9.1% (4,917) |
| Rhode Island: | 8.8% (30,321) |
Number of households with income $75k - 100k:| Richmond: | 11.3% (6,075) |
| Rhode Island: | 13.0% (44,807) |
Number of households with income $100k - 125k:| Richmond: | 11.8% (6,367) |
| State: | 10.9% (37,478) |
Number of households with income $125k - 150k:| Richmond: | 11.5% (6,199) |
| Rhode Island: | 9.3% (32,110) |
Number of households with income $150k - 200k:| Richmond: | 11.2% (6,059) |
| State: | 10.5% (36,226) |
Number of households with income > $200k:| Richmond: | 17.1% (9,234) |
| State: | 13.1% (45,303) |
Aggregate household income in Richmond in 2022: $453,671,755
Median family income in Richmond in 2022:| Richmond: | $128,198 |
| Rhode Island: | $116,800 |
Number of families with income < $10k:| Richmond: | 0.5% (7) |
| Rhode Island: | 1.7% (3,325) |
Number of families with income $10k - 20k:| Richmond: | 0.5% (7) |
| Rhode Island: | 2.0% (3,971) |
Number of families with income $20k - 30k:| Richmond: | 2.4% (34) |
| Rhode Island: | 2.3% (4,461) |
Number of families with income $30k - 40k:| Richmond: | 2.0% (29) |
| State: | 3.7% (7,222) |
Number of families with income $40k - 50k:| Richmond: | 6.9% (98) |
| State: | 3.8% (7,533) |
Number of families with income $50k - 60k:| Richmond: | 9.9% (141) |
| Rhode Island: | 6.0% (11,742) |
Number of families with income $60k - 75k:| Richmond: | 17.5% (250) |
| State: | 9.1% (17,914) |
Number of families with income $75k - 100k:| Richmond: | 16.9% (242) |
| State: | 12.9% (25,502) |
Number of families with income $100k - 125k:| Richmond: | 14.7% (210) |
| State: | 13.2% (25,978) |
Number of families with income $125k - 150k:| Richmond: | 7.4% (106) |
| State: | 11.5% (22,743) |
Number of families with income $150k - 200k:| Richmond: | 13.7% (195) |
| Rhode Island: | 14.6% (28,758) |
Number of families with income > $200k:| Richmond: | 7.6% (109) |
| Rhode Island: | 19.3% (38,074) |
Median non-family income in Richmond in 2022:| Richmond: | $61,991 |
| State: | $51,671 |
Change in median non-family income between 2000 and 2022:| Richmond, Rhode Island: | +98.2% |
| Rhode Island: | +111.1% |
Median per capita income in Richmond in 2022:| Richmond: | $46,189 |
| Rhode Island: | $50,823 |
Change in median per capita income between 2000 and 2022:| Richmond, Rhode Island: | +107.6% |
| Rhode Island: | +116.7% |
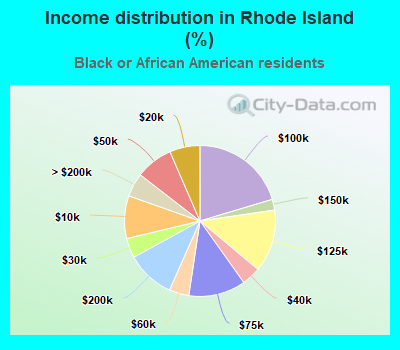
Income statistics for Black or African American residents
Number of households with income < $10k:| Richmond: | 8.0% (2) |
| State: | 9.2% (1,807) |
Number of households with income $10k - 20k:| Richmond: | 8.0% (2) |
| Rhode Island: | 6.5% (1,283) |
Number of households with income $20k - 30k:| Richmond: | 4.0% (1) |
| State: | 4.2% (834) |
Number of households with income $30k - 40k:| Richmond: | 4.0% (1) |
| Rhode Island: | 4.1% (802) |
Number of households with income $40k - 50k:| Richmond: | 8.0% (2) |
| State: | 8.0% (1,581) |
Number of households with income $50k - 60k:| Richmond: | 4.0% (1) |
| State: | 4.2% (833) |
Number of households with income $60k - 75k:| Richmond: | 12.0% (3) |
| Rhode Island: | 12.2% (2,416) |
Number of households with income $75k - 100k:| Richmond: | 20.0% (5) |
| State: | 20.4% (4,023) |
Number of households with income $100k - 125k:| Richmond: | 12.0% (3) |
| State: | 13.4% (2,648) |
Number of households with income $125k - 150k:| Richmond: | 4.0% (1) |
| State: | 2.3% (456) |
Number of households with income $150k - 200k:| Richmond: | 12.0% (3) |
| State: | 10.4% (2,057) |
Number of households with income > $200k:| Richmond: | 4.0% (1) |
| State: | 5.1% (1,003) |
Aggregate household income in Richmond in 2022: $1,354,809
Median per capita income in Richmond in 2022:| Richmond: | $26,346 |
| Rhode Island: | $29,819 |
Change in median per capita income between 2000 and 2022:| Richmond, Rhode Island: | +16.6% |
| State: | +135.9% |
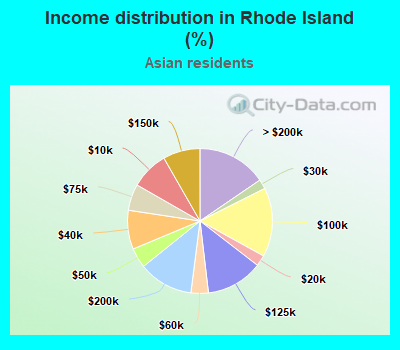
Income statistics for Asian residents
Median household income in Richmond, RI in 2022:| Richmond: | $409,881 |
| State: | $97,307 |
Number of households with income < $10k:| Richmond: | 8.4% (4,486) |
| State: | 8.4% (1,084) |
Number of households with income $10k - 20k:| Richmond: | 2.5% (1,304) |
| Rhode Island: | 2.5% (315) |
Number of households with income $20k - 30k:| Richmond: | 2.1% (1,134) |
| State: | 2.1% (274) |
Number of households with income $30k - 40k:| Richmond: | 8.7% (4,619) |
| State: | 8.7% (1,116) |
Number of households with income $40k - 50k:| Richmond: | 4.5% (2,376) |
| Rhode Island: | 4.5% (574) |
Number of households with income $50k - 60k:| Richmond: | 3.9% (2,065) |
| State: | 3.9% (499) |
Number of households with income $60k - 75k:| Richmond: | 5.9% (3,125) |
| State: | 5.9% (755) |
Number of households with income $75k - 100k:| Richmond: | 15.4% (8,190) |
| Rhode Island: | 15.4% (1,979) |
Number of households with income $100k - 125k:| Richmond: | 12.7% (6,725) |
| Rhode Island: | 12.7% (1,625) |
Number of households with income $125k - 150k:| Richmond: | 8.3% (4,395) |
| State: | 8.3% (1,062) |
Number of households with income $150k - 200k:| Richmond: | 12.2% (6,477) |
| State: | 12.2% (1,565) |
Number of households with income > $200k:| Richmond: | 15.5% (8,215) |
| State: | 15.5% (1,985) |
Aggregate household income in Richmond in 2022: $19,646,613
Median family income in Richmond in 2022:| Richmond: | $651,880 |
| State: | $114,184 |
Number of families with income $125k - 150k:| Richmond: | 24.1% (28) |
| State: | 9.3% (739) |
Number of families with income $150k - 200k:| Richmond: | 75.9% (87) |
| Rhode Island: | 15.6% (1,237) |
Median per capita income in Richmond in 2022:| Richmond: | $125,309 |
| State: | $43,866 |
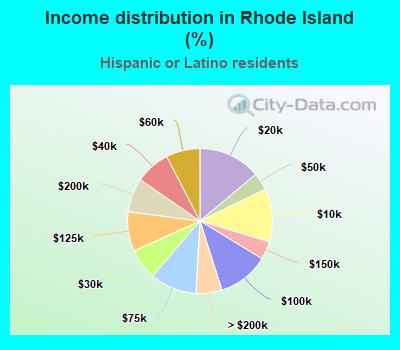
Income statistics for Hispanic or Latino residents
Median household income in Richmond, RI in 2022:| Richmond: | $54,732 |
| State: | $56,119 |
Change in median household income between 2000 and 2022:| Richmond, Rhode Island: | +75.1% |
| State: | +145.6% |
Number of households with income < $10k:| Richmond: | 11.9% (9,474) |
| State: | 11.9% (6,928) |
Number of households with income $10k - 20k:| Richmond: | 13.9% (11,113) |
| Rhode Island: | 13.9% (8,126) |
Number of households with income $20k - 30k:| Richmond: | 6.9% (5,527) |
| State: | 6.9% (4,042) |
Number of households with income $30k - 40k:| Richmond: | 7.8% (6,216) |
| Rhode Island: | 7.8% (4,546) |
Number of households with income $40k - 50k:| Richmond: | 3.9% (3,116) |
| State: | 3.9% (2,279) |
Number of households with income $50k - 60k:| Richmond: | 7.6% (6,056) |
| Rhode Island: | 7.6% (4,428) |
Number of households with income $60k - 75k:| Richmond: | 10.4% (8,320) |
| State: | 10.4% (6,084) |
Number of households with income $75k - 100k:| Richmond: | 11.4% (9,124) |
| State: | 11.4% (6,672) |
Number of households with income $100k - 125k:| Richmond: | 8.8% (7,065) |
| State: | 8.8% (5,166) |
Number of households with income $125k - 150k:| Richmond: | 4.1% (3,242) |
| Rhode Island: | 4.1% (2,371) |
Number of households with income $150k - 200k:| Richmond: | 7.6% (6,054) |
| State: | 7.6% (4,427) |
Number of households with income > $200k:| Richmond: | 5.8% (4,635) |
| State: | 5.8% (3,389) |
Aggregate household income in Richmond in 2022: $925,005
Median family income in Richmond in 2022:| Richmond: | $40,925 |
| Rhode Island: | $64,267 |
Number of families with income < $10k:| Richmond: | 5.7% (19) |
| State: | 9.7% (3,983) |
Number of families with income $10k - 20k:| Richmond: | 1.2% (4) |
| Rhode Island: | 5.6% (2,310) |
Number of families with income $20k - 30k:| Richmond: | 5.2% (17) |
| State: | 7.0% (2,878) |
Number of families with income $30k - 40k:| Richmond: | 6.3% (20) |
| State: | 9.9% (4,068) |
Number of families with income $40k - 50k:| Richmond: | 7.5% (24) |
| State: | 6.3% (2,564) |
Number of families with income $50k - 60k:| Richmond: | 11.9% (38) |
| State: | 8.2% (3,370) |
Number of families with income $60k - 75k:| Richmond: | 17.3% (56) |
| State: | 10.5% (4,297) |
Number of families with income $75k - 100k:| Richmond: | 19.9% (65) |
| State: | 13.2% (5,397) |
Number of families with income $100k - 125k:| Richmond: | 11.8% (38) |
| Rhode Island: | 10.1% (4,157) |
Number of families with income $125k - 150k:| Richmond: | 2.9% (9) |
| Rhode Island: | 4.2% (1,733) |
Number of families with income $150k - 200k:| Richmond: | 8.6% (28) |
| Rhode Island: | 9.8% (4,031) |
Number of families with income > $200k:| Richmond: | 1.7% (6) |
| Rhode Island: | 5.4% (2,228) |
Median per capita income in Richmond in 2022:| Richmond: | $31,301 |
| Rhode Island: | $25,485 |
Change in median per capita income between 2000 and 2022:| Richmond, Rhode Island: | +82.9% |
| State: | +168.3% |
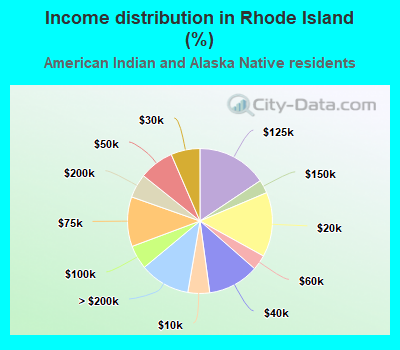
Income statistics for American Indian and Alaska Native residents
Number of households with income < $10k:| Richmond: | 8.5% (20) |
| State: | 4.9% (60) |
Number of households with income $10k - 20k:| Richmond: | 9.7% (23) |
| Rhode Island: | 14.4% (178) |
Number of households with income $20k - 30k:| Richmond: | 8.5% (20) |
| State: | 6.5% (80) |
Number of households with income $30k - 40k:| Richmond: | 8.9% (21) |
| State: | 11.4% (141) |
Number of households with income $40k - 50k:| Richmond: | 8.1% (19) |
| Rhode Island: | 7.8% (96) |
Number of households with income $50k - 60k:| Richmond: | 8.1% (19) |
| State: | 3.4% (42) |
Number of households with income $60k - 75k:| Richmond: | 9.7% (23) |
| Rhode Island: | 11.1% (137) |
Number of households with income $75k - 100k:| Richmond: | 12.7% (30) |
| State: | 5.3% (66) |
Number of households with income $100k - 125k:| Richmond: | 9.3% (22) |
| State: | 15.6% (193) |
Number of households with income $125k - 150k:| Richmond: | 5.5% (13) |
| State: | 3.0% (37) |
Number of households with income $150k - 200k:| Richmond: | 5.9% (14) |
| State: | 5.3% (66) |
Number of households with income > $200k:| Richmond: | 5.1% (12) |
| State: | 11.3% (139) |
Aggregate household income in Richmond in 2022: $1,518,560
Median per capita income in Richmond in 2022:| Richmond: | $50,145 |
| Rhode Island: | $31,547 |
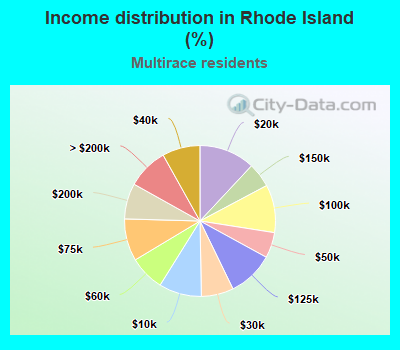
Income statistics for Multirace residents
Median household income in Richmond, RI in 2022:| Richmond: | $122,522 |
| State: | $62,970 |
Change in median household income between 2000 and 2022:| Richmond, Rhode Island: | +62.3% |
| State: | +131.0% |
Number of households with income < $10k:| Richmond: | 9.1% (9,967) |
| Rhode Island: | 9.1% (3,599) |
Number of households with income $10k - 20k:| Richmond: | 12.0% (13,035) |
| Rhode Island: | 12.0% (4,707) |
Number of households with income $20k - 30k:| Richmond: | 6.9% (7,541) |
| State: | 6.9% (2,723) |
Number of households with income $30k - 40k:| Richmond: | 8.1% (8,829) |
| State: | 8.1% (3,188) |
Number of households with income $40k - 50k:| Richmond: | 5.5% (5,977) |
| State: | 5.5% (2,158) |
Number of households with income $50k - 60k:| Richmond: | 7.5% (8,208) |
| State: | 7.5% (2,964) |
Number of households with income $60k - 75k:| Richmond: | 9.1% (9,870) |
| State: | 9.1% (3,564) |
Number of households with income $75k - 100k:| Richmond: | 10.2% (11,169) |
| State: | 10.2% (4,033) |
Number of households with income $100k - 125k:| Richmond: | 9.8% (10,723) |
| Rhode Island: | 9.8% (3,872) |
Number of households with income $125k - 150k:| Richmond: | 5.3% (5,752) |
| State: | 5.3% (2,077) |
Number of households with income $150k - 200k:| Richmond: | 7.6% (8,336) |
| State: | 7.6% (3,010) |
Number of households with income > $200k:| Richmond: | 8.8% (9,590) |
| State: | 8.8% (3,463) |
Aggregate household income in Richmond in 2022: $5,019,145
Median family income in Richmond in 2022:| Richmond: | $360,380 |
| State: | $78,140 |
Number of families with income $75k - 100k:| Richmond: | 100.0% (45) |
| State: | 10.3% (2,728) |
Median per capita income in Richmond in 2022:| Richmond: | $58,098 |
| Rhode Island: | $28,809 |