Putnam District, Connecticut (CT) income map, earnings map, and wages data
The median household income in Putnam District, CT in 2022 was $65,957, which was 34.1% less than the median annual income of $88,429 across the entire state of Connecticut. Compared to the median income of $38,979 in 2000 this represents an increase of 40.9%. The per capita income in 2022 was $35,175, which means an increase of 45.3% compared to 2000 when it was $19,229.
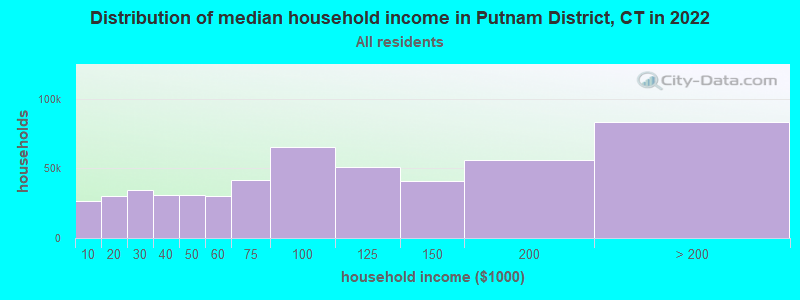
Income statistics for all residents
Median household income in Putnam District, CT in 2022:| Putnam District: | $65,958 |
| State: | $88,429 |
Change in median household income between 2000 and 2022:| Putnam District, Connecticut: | +69.2% |
| Connecticut: | +64.0% |
Number of households with income < $10k:| Putnam District: | 5.2% (26,866) |
| Connecticut: | 5.1% (72,746) |
Number of households with income $10k - 20k:| Putnam District: | 5.8% (30,296) |
| State: | 5.7% (81,643) |
Number of households with income $20k - 30k:| Putnam District: | 6.6% (34,291) |
| State: | 6.5% (92,844) |
Number of households with income $30k - 40k:| Putnam District: | 5.9% (30,774) |
| State: | 5.9% (83,934) |
Number of households with income $40k - 50k:| Putnam District: | 5.9% (30,577) |
| State: | 5.8% (83,025) |
Number of households with income $50k - 60k:| Putnam District: | 5.8% (29,983) |
| Connecticut: | 5.7% (81,788) |
Number of households with income $60k - 75k:| Putnam District: | 8.1% (42,009) |
| State: | 8.1% (115,651) |
Number of households with income $75k - 100k:| Putnam District: | 12.6% (65,609) |
| State: | 12.6% (180,173) |
Number of households with income $100k - 125k:| Putnam District: | 9.8% (51,076) |
| State: | 9.9% (141,231) |
Number of households with income $125k - 150k:| Putnam District: | 7.8% (40,789) |
| State: | 7.9% (112,826) |
Number of households with income $150k - 200k:| Putnam District: | 10.7% (55,796) |
| State: | 10.8% (154,641) |
Number of households with income > $200k:| Putnam District: | 16.0% (83,356) |
| Connecticut: | 16.3% (233,133) |
Aggregate household income in Putnam District in 2022: $5,525,547,077
Median family income in Putnam District in 2022:| Putnam District: | $87,067 |
| State: | $115,183 |
Median non-family income in Putnam District in 2022:| Putnam District: | $38,224 |
| State: | $50,964 |
Change in median non-family income between 2000 and 2022:| Putnam District, Connecticut: | +71.5% |
| Connecticut: | +65.1% |
Median per capita income in Putnam District in 2022:| Putnam District: | $35,176 |
| State: | $51,581 |
Change in median per capita income between 2000 and 2022:| Putnam District, Connecticut: | +82.9% |
| State: | +79.3% |
Income statistics for White residents
Median household income in Putnam District, CT in 2022:| Putnam District: | $66,894 |
| Connecticut: | $96,890 |
Change in median household income between 2000 and 2022:| Putnam District, Connecticut: | +69.4% |
| State: | +68.5% |
Number of households with income < $10k:| Putnam District: | 4.2% (14,631) |
| State: | 4.2% (42,265) |
Number of households with income $10k - 20k:| Putnam District: | 4.9% (16,822) |
| State: | 4.8% (48,323) |
Number of households with income $20k - 30k:| Putnam District: | 5.8% (20,006) |
| State: | 5.7% (57,716) |
Number of households with income $30k - 40k:| Putnam District: | 5.4% (18,518) |
| Connecticut: | 5.3% (53,827) |
Number of households with income $40k - 50k:| Putnam District: | 5.3% (18,441) |
| State: | 5.3% (53,301) |
Number of households with income $50k - 60k:| Putnam District: | 5.6% (19,192) |
| Connecticut: | 5.5% (55,690) |
Number of households with income $60k - 75k:| Putnam District: | 7.9% (27,426) |
| State: | 8.0% (80,329) |
Number of households with income $75k - 100k:| Putnam District: | 12.7% (43,947) |
| State: | 12.7% (128,070) |
Number of households with income $100k - 125k:| Putnam District: | 10.0% (34,509) |
| State: | 10.0% (101,210) |
Number of households with income $125k - 150k:| Putnam District: | 8.0% (27,704) |
| Connecticut: | 8.0% (81,250) |
Number of households with income $150k - 200k:| Putnam District: | 11.8% (40,737) |
| State: | 11.8% (119,527) |
Number of households with income > $200k:| Putnam District: | 18.4% (63,771) |
| State: | 18.6% (187,875) |
Aggregate household income in Putnam District in 2022: $4,092,559,225
Median family income in Putnam District in 2022:| Putnam District: | $90,590 |
| Connecticut: | $128,955 |
Number of families with income < $10k:| Putnam District: | 7.5% (66) |
| State: | 1.9% (11,537) |
Number of families with income $10k - 20k:| Putnam District: | 4.2% (38) |
| State: | 1.8% (11,289) |
Number of families with income $20k - 30k:| Putnam District: | 8.6% (76) |
| Connecticut: | 3.0% (18,506) |
Number of families with income $30k - 40k:| Putnam District: | 8.6% (76) |
| Connecticut: | 2.9% (18,160) |
Number of families with income $40k - 50k:| Putnam District: | 10.8% (96) |
| State: | 3.9% (24,550) |
Number of families with income $50k - 60k:| Putnam District: | 8.2% (73) |
| State: | 4.3% (26,723) |
Number of families with income $60k - 75k:| Putnam District: | 12.6% (112) |
| State: | 7.1% (44,075) |
Number of families with income $75k - 100k:| Putnam District: | 16.0% (142) |
| State: | 12.5% (77,679) |
Number of families with income $100k - 125k:| Putnam District: | 7.5% (66) |
| State: | 11.1% (69,086) |
Number of families with income $125k - 150k:| Putnam District: | 5.6% (50) |
| Connecticut: | 9.6% (59,616) |
Number of families with income $150k - 200k:| Putnam District: | 3.1% (28) |
| Connecticut: | 15.7% (97,890) |
Number of families with income > $200k:| Putnam District: | 7.1% (63) |
| State: | 26.3% (163,417) |
Median non-family income in Putnam District in 2022:| Putnam District: | $38,670 |
| Connecticut: | $54,067 |
Change in median non-family income between 2000 and 2022:| Putnam District, Connecticut: | +73.7% |
| Connecticut: | +68.7% |
Median per capita income in Putnam District in 2022:| Putnam District: | $37,723 |
| State: | $59,916 |
Change in median per capita income between 2000 and 2022:| Putnam District, Connecticut: | +92.1% |
| Connecticut: | +90.2% |
Income statistics for Black or African American residents
Median household income in Putnam District, CT in 2022:| Putnam District: | $31,108 |
| State: | $61,803 |
Change in median household income between 2000 and 2022:| Putnam District, Connecticut: | +60.9% |
| State: | +76.1% |
Number of households with income < $10k:| Putnam District: | 6.8% (5,229) |
| Connecticut: | 6.8% (9,494) |
Number of households with income $10k - 20k:| Putnam District: | 7.9% (6,060) |
| State: | 7.9% (11,003) |
Number of households with income $20k - 30k:| Putnam District: | 10.8% (8,286) |
| State: | 10.8% (15,045) |
Number of households with income $30k - 40k:| Putnam District: | 8.2% (6,334) |
| Connecticut: | 8.2% (11,501) |
Number of households with income $40k - 50k:| Putnam District: | 7.4% (5,736) |
| Connecticut: | 7.4% (10,416) |
Number of households with income $50k - 60k:| Putnam District: | 7.5% (5,801) |
| State: | 7.5% (10,534) |
Number of households with income $60k - 75k:| Putnam District: | 8.0% (6,192) |
| Connecticut: | 8.0% (11,244) |
Number of households with income $75k - 100k:| Putnam District: | 9.6% (7,363) |
| State: | 9.6% (13,370) |
Number of households with income $100k - 125k:| Putnam District: | 10.2% (7,845) |
| State: | 10.2% (14,244) |
Number of households with income $125k - 150k:| Putnam District: | 8.0% (6,194) |
| Connecticut: | 8.0% (11,246) |
Number of households with income $150k - 200k:| Putnam District: | 7.7% (5,908) |
| Connecticut: | 7.7% (10,727) |
Number of households with income > $200k:| Putnam District: | 7.9% (6,105) |
| State: | 7.9% (11,086) |
Aggregate household income in Putnam District in 2022: $8,102,481
Median family income in Putnam District in 2022:| Putnam District: | $41,353 |
| State: | $87,228 |
Number of families with income $10k - 20k:| Putnam District: | 55.9% (15) |
| State: | 4.8% (4,026) |
Number of families with income $20k - 30k:| Putnam District: | 16.4% (4) |
| Connecticut: | 6.0% (5,015) |
Number of families with income $50k - 60k:| Putnam District: | 27.7% (7) |
| State: | 5.4% (4,480) |
Median non-family income in Putnam District in 2022:| Putnam District: | $44,799 |
| Connecticut: | $38,608 |
Change in median non-family income between 2000 and 2022:| Putnam District, Connecticut: | +77.0% |
| State: | +77.0% |
Median per capita income in Putnam District in 2022:| Putnam District: | $17,687 |
| State: | $36,289 |
Change in median per capita income between 2000 and 2022:| Putnam District, Connecticut: | +115.2% |
| State: | +117.5% |
Income statistics for Asian residents
Median household income in Putnam District, CT in 2022:| Putnam District: | $44,644 |
| State: | $110,568 |
Change in median household income between 2000 and 2022:| Putnam District, Connecticut: | +110.1% |
| State: | +79.5% |
Number of households with income < $10k:| Putnam District: | 7.1% (1,465) |
| State: | 7.1% (4,245) |
Number of households with income $10k - 20k:| Putnam District: | 3.5% (720) |
| Connecticut: | 3.5% (2,087) |
Number of households with income $20k - 30k:| Putnam District: | 4.1% (850) |
| State: | 4.1% (2,464) |
Number of households with income $30k - 40k:| Putnam District: | 4.1% (855) |
| State: | 4.1% (2,478) |
Number of households with income $40k - 50k:| Putnam District: | 3.3% (685) |
| State: | 3.3% (1,983) |
Number of households with income $50k - 60k:| Putnam District: | 3.9% (803) |
| State: | 3.9% (2,328) |
Number of households with income $60k - 75k:| Putnam District: | 7.0% (1,459) |
| Connecticut: | 7.0% (4,228) |
Number of households with income $75k - 100k:| Putnam District: | 11.5% (2,385) |
| State: | 11.5% (6,911) |
Number of households with income $100k - 125k:| Putnam District: | 10.2% (2,114) |
| State: | 10.2% (6,127) |
Number of households with income $125k - 150k:| Putnam District: | 8.5% (1,752) |
| Connecticut: | 8.5% (5,079) |
Number of households with income $150k - 200k:| Putnam District: | 12.4% (2,565) |
| State: | 12.4% (7,434) |
Number of households with income > $200k:| Putnam District: | 24.4% (5,059) |
| State: | 24.4% (14,661) |
Aggregate household income in Putnam District in 2022: $603,906
Median family income in Putnam District in 2022:| Putnam District: | $44,160 |
| Connecticut: | $134,548 |
Median per capita income in Putnam District in 2022:| Putnam District: | $20,364 |
| State: | $55,295 |
Change in median per capita income between 2000 and 2022:| Putnam District, Connecticut: | +103.6% |
| Connecticut: | +97.8% |
Income statistics for Hispanic or Latino residents
Median household income in Putnam District, CT in 2022:| Putnam District: | $88,617 |
| State: | $60,275 |
Change in median household income between 2000 and 2022:| Putnam District, Connecticut: | +67.8% |
| Connecticut: | +87.9% |
Number of households with income < $10k:| Putnam District: | 8.7% (30,599) |
| State: | 8.7% (18,584) |
Number of households with income $10k - 20k:| Putnam District: | 9.1% (31,671) |
| Connecticut: | 9.1% (19,235) |
Number of households with income $20k - 30k:| Putnam District: | 8.9% (31,266) |
| State: | 8.9% (18,989) |
Number of households with income $30k - 40k:| Putnam District: | 7.5% (26,290) |
| State: | 7.5% (15,967) |
Number of households with income $40k - 50k:| Putnam District: | 8.7% (30,406) |
| Connecticut: | 8.7% (18,466) |
Number of households with income $50k - 60k:| Putnam District: | 6.9% (24,214) |
| State: | 6.9% (14,706) |
Number of households with income $60k - 75k:| Putnam District: | 8.9% (31,100) |
| State: | 8.9% (18,888) |
Number of households with income $75k - 100k:| Putnam District: | 13.5% (47,205) |
| Connecticut: | 13.5% (28,669) |
Number of households with income $100k - 125k:| Putnam District: | 8.2% (28,706) |
| Connecticut: | 8.2% (17,434) |
Number of households with income $125k - 150k:| Putnam District: | 6.5% (22,643) |
| State: | 6.5% (13,752) |
Number of households with income $150k - 200k:| Putnam District: | 6.6% (23,239) |
| State: | 6.6% (14,114) |
Number of households with income > $200k:| Putnam District: | 6.4% (22,442) |
| Connecticut: | 6.4% (13,630) |
Aggregate household income in Putnam District in 2022: $4,143,699
Median family income in Putnam District in 2022:| Putnam District: | $90,353 |
| Connecticut: | $68,336 |
Number of families with income < $10k:| Putnam District: | 9.7% (33) |
| State: | 5.2% (7,456) |
Number of families with income $10k - 20k:| Putnam District: | 8.0% (28) |
| State: | 6.0% (8,616) |
Number of families with income $20k - 30k:| Putnam District: | 18.3% (63) |
| State: | 8.9% (12,680) |
Number of families with income $30k - 40k:| Putnam District: | 12.4% (43) |
| Connecticut: | 8.5% (12,090) |
Number of families with income $40k - 50k:| Putnam District: | 14.6% (50) |
| State: | 8.8% (12,624) |
Number of families with income $50k - 60k:| Putnam District: | 9.6% (33) |
| State: | 8.4% (11,924) |
Number of families with income $60k - 75k:| Putnam District: | 8.8% (30) |
| Connecticut: | 8.9% (12,677) |
Number of families with income $75k - 100k:| Putnam District: | 10.9% (37) |
| State: | 14.3% (20,457) |
Number of families with income $100k - 125k:| Putnam District: | 3.1% (11) |
| State: | 8.2% (11,720) |
Number of families with income $125k - 150k:| Putnam District: | 2.8% (9) |
| State: | 8.2% (11,729) |
Number of families with income $150k - 200k:| Putnam District: | 0.8% (3) |
| State: | 7.1% (10,096) |
Number of families with income > $200k:| Putnam District: | 1.0% (4) |
| Connecticut: | 7.4% (10,622) |
Median per capita income in Putnam District in 2022:| Putnam District: | $5,540 |
| Connecticut: | $28,507 |
Change in median per capita income between 2000 and 2022:| Putnam District, Connecticut: | +80.3% |
| State: | +117.2% |
Income statistics for Multirace residents
Median household income in Putnam District, CT in 2022:| Putnam District: | $64,461 |
| State: | $77,277 |
Change in median household income between 2000 and 2022:| Putnam District, Connecticut: | +119.4% |
| State: | +113.6% |
Number of households with income < $10k:| Putnam District: | 6.0% (6,053) |
| State: | 6.0% (7,457) |
Number of households with income $10k - 20k:| Putnam District: | 8.1% (8,231) |
| Connecticut: | 8.1% (10,139) |
Number of households with income $20k - 30k:| Putnam District: | 7.0% (7,064) |
| Connecticut: | 7.0% (8,702) |
Number of households with income $30k - 40k:| Putnam District: | 6.9% (6,937) |
| State: | 6.9% (8,546) |
Number of households with income $40k - 50k:| Putnam District: | 7.0% (7,072) |
| Connecticut: | 7.0% (8,712) |
Number of households with income $50k - 60k:| Putnam District: | 5.9% (5,951) |
| State: | 5.9% (7,331) |
Number of households with income $60k - 75k:| Putnam District: | 8.5% (8,632) |
| Connecticut: | 8.5% (10,634) |
Number of households with income $75k - 100k:| Putnam District: | 14.1% (14,287) |
| Connecticut: | 14.1% (17,600) |
Number of households with income $100k - 125k:| Putnam District: | 9.9% (10,052) |
| State: | 9.9% (12,383) |
Number of households with income $125k - 150k:| Putnam District: | 7.2% (7,242) |
| Connecticut: | 7.2% (8,921) |
Number of households with income $150k - 200k:| Putnam District: | 8.8% (8,866) |
| Connecticut: | 8.8% (10,922) |
Number of households with income > $200k:| Putnam District: | 10.6% (10,754) |
| Connecticut: | 10.6% (13,247) |
Aggregate household income in Putnam District in 2022: $26,134,703
Median family income in Putnam District in 2022:| Putnam District: | $63,171 |
| Connecticut: | $84,255 |
Number of families with income $20k - 30k:| Putnam District: | 44.9% (43) |
| Connecticut: | 6.9% (5,812) |
Number of families with income $60k - 75k:| Putnam District: | 55.1% (53) |
| Connecticut: | 7.8% (6,550) |
Median non-family income in Putnam District in 2022:| Putnam District: | $58,832 |
| State: | $44,462 |
Change in median non-family income between 2000 and 2022:| Putnam District, Connecticut: | +81.0% |
| State: | +97.6% |
Median per capita income in Putnam District in 2022:| Putnam District: | $30,474 |
| State: | $32,794 |
Change in median per capita income between 2000 and 2022:| Putnam District, Connecticut: | +95.5% |
| State: | +117.2% |
Income statistics for other residents
Number of households with income < $10k:| Putnam District: | 9.0% (10,783) |
| State: | 9.0% (8,596) |
Number of households with income $10k - 20k:| Putnam District: | 10.2% (12,260) |
| State: | 10.2% (9,773) |
Number of households with income $20k - 30k:| Putnam District: | 9.1% (10,902) |
| State: | 9.1% (8,691) |
Number of households with income $30k - 40k:| Putnam District: | 7.8% (9,342) |
| Connecticut: | 7.8% (7,447) |
Number of households with income $40k - 50k:| Putnam District: | 8.2% (9,860) |
| State: | 8.2% (7,860) |
Number of households with income $50k - 60k:| Putnam District: | 6.0% (7,222) |
| State: | 6.0% (5,757) |
Number of households with income $60k - 75k:| Putnam District: | 9.3% (11,217) |
| State: | 9.3% (8,942) |
Number of households with income $75k - 100k:| Putnam District: | 14.3% (17,185) |
| State: | 14.3% (13,700) |
Number of households with income $100k - 125k:| Putnam District: | 7.2% (8,663) |
| State: | 7.2% (6,906) |
Number of households with income $125k - 150k:| Putnam District: | 6.5% (7,796) |
| State: | 6.5% (6,215) |
Number of households with income $150k - 200k:| Putnam District: | 6.1% (7,357) |
| State: | 6.1% (5,865) |
Number of households with income > $200k:| Putnam District: | 6.3% (7,608) |
| State: | 6.3% (6,065) |
Median per capita income in Putnam District in 2022:| Putnam District: | $36,352 |
| Connecticut: | $29,353 |