Plymouth, Connecticut (CT) income map, earnings map, and wages data
The median household income in Plymouth, CT in 2022 was $90,952, which was 2.8% greater than the median annual income of $88,429 across the entire state of Connecticut. Compared to the median income of $53,750 in 2000 this represents an increase of 40.9%. The per capita income in 2022 was $42,520, which means an increase of 45.3% compared to 2000 when it was $23,244.
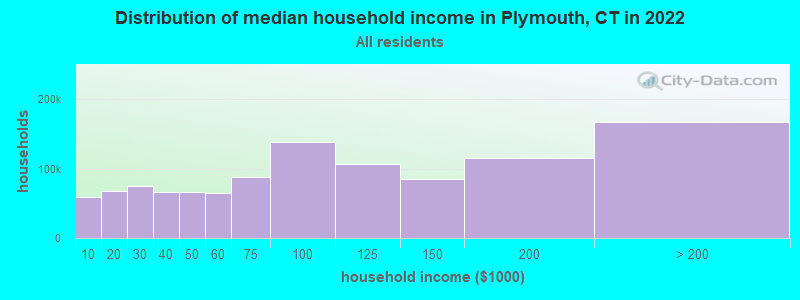
Income statistics for all residents
Median household income in Plymouth, CT in 2022:| Plymouth: | $90,952 |
| Connecticut: | $88,429 |
Change in median household income between 2000 and 2022:| Plymouth, Connecticut: | +69.2% |
| Connecticut: | +64.0% |
Number of households with income < $10k:| Plymouth: | 5.2% (37,047) |
| State: | 5.1% (72,746) |
Number of households with income $10k - 20k:| Plymouth: | 5.8% (41,775) |
| State: | 5.7% (81,643) |
Number of households with income $20k - 30k:| Plymouth: | 6.6% (47,286) |
| State: | 6.5% (92,844) |
Number of households with income $30k - 40k:| Plymouth: | 5.9% (42,436) |
| State: | 5.9% (83,934) |
Number of households with income $40k - 50k:| Plymouth: | 5.9% (42,164) |
| State: | 5.8% (83,025) |
Number of households with income $50k - 60k:| Plymouth: | 5.8% (41,344) |
| Connecticut: | 5.7% (81,788) |
Number of households with income $60k - 75k:| Plymouth: | 8.1% (57,929) |
| State: | 8.1% (115,651) |
Number of households with income $75k - 100k:| Plymouth: | 12.6% (90,472) |
| Connecticut: | 12.6% (180,173) |
Number of households with income $100k - 125k:| Plymouth: | 9.8% (70,431) |
| Connecticut: | 9.9% (141,231) |
Number of households with income $125k - 150k:| Plymouth: | 7.8% (56,246) |
| Connecticut: | 7.9% (112,826) |
Number of households with income $150k - 200k:| Plymouth: | 10.7% (76,940) |
| Connecticut: | 10.8% (154,641) |
Number of households with income > $200k:| Plymouth: | 16.0% (114,944) |
| State: | 16.3% (233,133) |
Aggregate household income in Plymouth in 2022: $11,393,762,083
Median family income in Plymouth in 2022:| Plymouth: | $111,821 |
| State: | $115,183 |
Median non-family income in Plymouth in 2022:| Plymouth: | $50,209 |
| Connecticut: | $50,964 |
Change in median non-family income between 2000 and 2022:| Plymouth, Connecticut: | +71.5% |
| Connecticut: | +65.1% |
Median per capita income in Plymouth in 2022:| Plymouth: | $42,520 |
| State: | $51,581 |
Change in median per capita income between 2000 and 2022:| Plymouth, Connecticut: | +82.9% |
| State: | +79.3% |
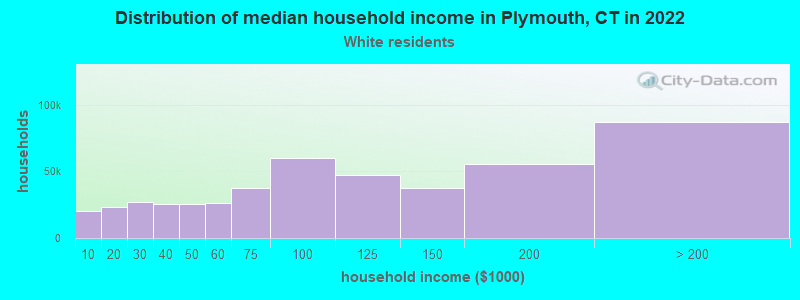
Income statistics for White residents
Median household income in Plymouth, CT in 2022:| Plymouth: | $91,260 |
| State: | $96,890 |
Change in median household income between 2000 and 2022:| Plymouth, Connecticut: | +69.4% |
| State: | +68.5% |
Number of households with income < $10k:| Plymouth: | 4.2% (19,960) |
| State: | 4.2% (42,265) |
Number of households with income $10k - 20k:| Plymouth: | 4.9% (22,949) |
| State: | 4.8% (48,323) |
Number of households with income $20k - 30k:| Plymouth: | 5.8% (27,292) |
| Connecticut: | 5.7% (57,716) |
Number of households with income $30k - 40k:| Plymouth: | 5.4% (25,262) |
| State: | 5.3% (53,827) |
Number of households with income $40k - 50k:| Plymouth: | 5.3% (25,159) |
| State: | 5.3% (53,301) |
Number of households with income $50k - 60k:| Plymouth: | 5.6% (26,182) |
| State: | 5.5% (55,690) |
Number of households with income $60k - 75k:| Plymouth: | 7.9% (37,416) |
| Connecticut: | 8.0% (80,329) |
Number of households with income $75k - 100k:| Plymouth: | 12.7% (59,954) |
| State: | 12.7% (128,070) |
Number of households with income $100k - 125k:| Plymouth: | 10.0% (47,078) |
| Connecticut: | 10.0% (101,210) |
Number of households with income $125k - 150k:| Plymouth: | 8.0% (37,796) |
| State: | 8.0% (81,250) |
Number of households with income $150k - 200k:| Plymouth: | 11.8% (55,575) |
| Connecticut: | 11.8% (119,527) |
Number of households with income > $200k:| Plymouth: | 18.4% (87,000) |
| State: | 18.6% (187,875) |
Aggregate household income in Plymouth in 2022: $8,523,455,870
Median family income in Plymouth in 2022:| Plymouth: | $114,512 |
| State: | $128,955 |
Number of families with income < $10k:| Plymouth: | 4.1% (81) |
| Connecticut: | 1.9% (11,537) |
Number of families with income $10k - 20k:| Plymouth: | 2.3% (46) |
| State: | 1.8% (11,289) |
Number of families with income $20k - 30k:| Plymouth: | 4.3% (85) |
| State: | 3.0% (18,506) |
Number of families with income $30k - 40k:| Plymouth: | 6.0% (119) |
| Connecticut: | 2.9% (18,160) |
Number of families with income $40k - 50k:| Plymouth: | 7.0% (140) |
| State: | 3.9% (24,550) |
Number of families with income $50k - 60k:| Plymouth: | 6.6% (132) |
| Connecticut: | 4.3% (26,723) |
Number of families with income $60k - 75k:| Plymouth: | 15.8% (315) |
| State: | 7.1% (44,075) |
Number of families with income $75k - 100k:| Plymouth: | 17.0% (339) |
| Connecticut: | 12.5% (77,679) |
Number of families with income $100k - 125k:| Plymouth: | 13.4% (266) |
| State: | 11.1% (69,086) |
Number of families with income $125k - 150k:| Plymouth: | 7.1% (141) |
| State: | 9.6% (59,616) |
Number of families with income $150k - 200k:| Plymouth: | 12.7% (254) |
| Connecticut: | 15.7% (97,890) |
Number of families with income > $200k:| Plymouth: | 3.7% (74) |
| State: | 26.3% (163,417) |
Median non-family income in Plymouth in 2022:| Plymouth: | $52,238 |
| State: | $54,067 |
Change in median non-family income between 2000 and 2022:| Plymouth, Connecticut: | +73.7% |
| State: | +68.7% |
Median per capita income in Plymouth in 2022:| Plymouth: | $44,804 |
| Connecticut: | $59,916 |
Change in median per capita income between 2000 and 2022:| Plymouth, Connecticut: | +92.1% |
| Connecticut: | +90.2% |
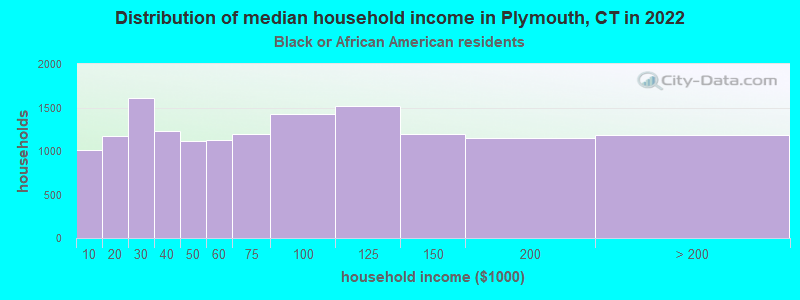
Income statistics for Black or African American residents
Median household income in Plymouth, CT in 2022:| Plymouth: | $6,034 |
| State: | $61,803 |
Change in median household income between 2000 and 2022:| Plymouth, Connecticut: | +60.9% |
| State: | +76.1% |
Number of households with income < $10k:| Plymouth: | 6.8% (1,014) |
| State: | 6.8% (9,494) |
Number of households with income $10k - 20k:| Plymouth: | 7.9% (1,175) |
| State: | 7.9% (11,003) |
Number of households with income $20k - 30k:| Plymouth: | 10.8% (1,607) |
| Connecticut: | 10.8% (15,045) |
Number of households with income $30k - 40k:| Plymouth: | 8.2% (1,228) |
| State: | 8.2% (11,501) |
Number of households with income $40k - 50k:| Plymouth: | 7.4% (1,113) |
| State: | 7.4% (10,416) |
Number of households with income $50k - 60k:| Plymouth: | 7.5% (1,125) |
| State: | 7.5% (10,534) |
Number of households with income $60k - 75k:| Plymouth: | 8.0% (1,201) |
| State: | 8.0% (11,244) |
Number of households with income $75k - 100k:| Plymouth: | 9.6% (1,428) |
| State: | 9.6% (13,370) |
Number of households with income $100k - 125k:| Plymouth: | 10.2% (1,522) |
| Connecticut: | 10.2% (14,244) |
Number of households with income $125k - 150k:| Plymouth: | 8.0% (1,201) |
| State: | 8.0% (11,246) |
Number of households with income $150k - 200k:| Plymouth: | 7.7% (1,146) |
| State: | 7.7% (10,727) |
Number of households with income > $200k:| Plymouth: | 7.9% (1,184) |
| Connecticut: | 7.9% (11,086) |
Aggregate household income in Plymouth in 2022: $184,388
Median non-family income in Plymouth in 2022:| Plymouth: | $6,637 |
| State: | $38,608 |
Change in median non-family income between 2000 and 2022:| Plymouth, Connecticut: | +77.0% |
| State: | +77.0% |
Median per capita income in Plymouth in 2022:| Plymouth: | $15,559 |
| Connecticut: | $36,289 |
Change in median per capita income between 2000 and 2022:| Plymouth, Connecticut: | +115.2% |
| State: | +117.5% |
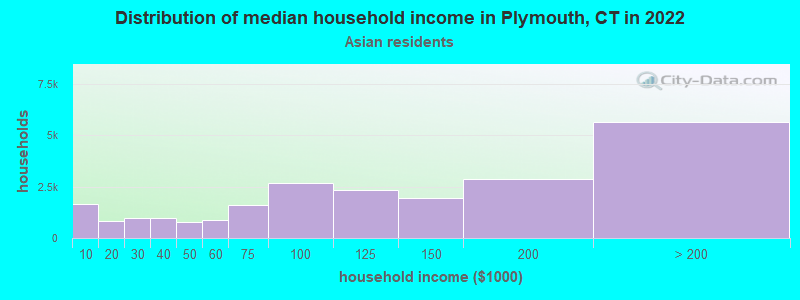
Income statistics for Asian residents
Median household income in Plymouth, CT in 2022:| Plymouth: | $49,896 |
| State: | $110,568 |
Change in median household income between 2000 and 2022:| Plymouth, Connecticut: | +110.1% |
| State: | +79.5% |
Number of households with income < $10k:| Plymouth: | 7.1% (1,637) |
| State: | 7.1% (4,245) |
Number of households with income $10k - 20k:| Plymouth: | 3.5% (805) |
| Connecticut: | 3.5% (2,087) |
Number of households with income $20k - 30k:| Plymouth: | 4.1% (951) |
| State: | 4.1% (2,464) |
Number of households with income $30k - 40k:| Plymouth: | 4.1% (955) |
| Connecticut: | 4.1% (2,478) |
Number of households with income $40k - 50k:| Plymouth: | 3.3% (765) |
| State: | 3.3% (1,983) |
Number of households with income $50k - 60k:| Plymouth: | 3.9% (898) |
| State: | 3.9% (2,328) |
Number of households with income $60k - 75k:| Plymouth: | 7.0% (1,630) |
| State: | 7.0% (4,228) |
Number of households with income $75k - 100k:| Plymouth: | 11.5% (2,665) |
| Connecticut: | 11.5% (6,911) |
Number of households with income $100k - 125k:| Plymouth: | 10.2% (2,363) |
| State: | 10.2% (6,127) |
Number of households with income $125k - 150k:| Plymouth: | 8.5% (1,959) |
| State: | 8.5% (5,079) |
Number of households with income $150k - 200k:| Plymouth: | 12.4% (2,867) |
| Connecticut: | 12.4% (7,434) |
Number of households with income > $200k:| Plymouth: | 24.4% (5,654) |
| State: | 24.4% (14,661) |
Aggregate household income in Plymouth in 2022: $796,149
Median non-family income in Plymouth in 2022:| Plymouth: | $59,040 |
| State: | $63,785 |
Change in median non-family income between 2000 and 2022:| Plymouth, Connecticut: | +148.6% |
| Connecticut: | +77.9% |
Median per capita income in Plymouth in 2022:| Plymouth: | $23,011 |
| Connecticut: | $55,295 |
Change in median per capita income between 2000 and 2022:| Plymouth, Connecticut: | +103.6% |
| State: | +97.8% |
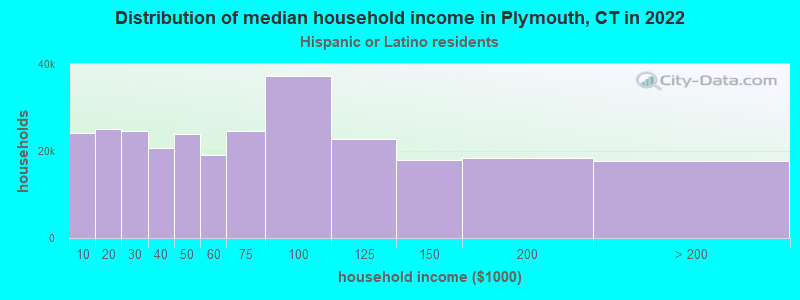
Income statistics for Hispanic or Latino residents
Median household income in Plymouth, CT in 2022:| Plymouth: | $69,915 |
| State: | $60,275 |
Change in median household income between 2000 and 2022:| Plymouth, Connecticut: | +67.8% |
| State: | +87.9% |
Number of households with income < $10k:| Plymouth: | 8.7% (24,142) |
| State: | 8.7% (18,584) |
Number of households with income $10k - 20k:| Plymouth: | 9.1% (24,987) |
| State: | 9.1% (19,235) |
Number of households with income $20k - 30k:| Plymouth: | 8.9% (24,667) |
| Connecticut: | 8.9% (18,989) |
Number of households with income $30k - 40k:| Plymouth: | 7.5% (20,742) |
| Connecticut: | 7.5% (15,967) |
Number of households with income $40k - 50k:| Plymouth: | 8.7% (23,988) |
| State: | 8.7% (18,466) |
Number of households with income $50k - 60k:| Plymouth: | 6.9% (19,104) |
| Connecticut: | 6.9% (14,706) |
Number of households with income $60k - 75k:| Plymouth: | 8.9% (24,536) |
| Connecticut: | 8.9% (18,888) |
Number of households with income $75k - 100k:| Plymouth: | 13.5% (37,242) |
| State: | 13.5% (28,669) |
Number of households with income $100k - 125k:| Plymouth: | 8.2% (22,648) |
| Connecticut: | 8.2% (17,434) |
Number of households with income $125k - 150k:| Plymouth: | 6.5% (17,865) |
| State: | 6.5% (13,752) |
Number of households with income $150k - 200k:| Plymouth: | 6.6% (18,335) |
| State: | 6.6% (14,114) |
Number of households with income > $200k:| Plymouth: | 6.4% (17,706) |
| Connecticut: | 6.4% (13,630) |
Aggregate household income in Plymouth in 2022: $28,103,443
Median family income in Plymouth in 2022:| Plymouth: | $54,176 |
| State: | $68,336 |
Number of families with income < $10k:| Plymouth: | 6.1% (37) |
| State: | 5.2% (7,456) |
Number of families with income $10k - 20k:| Plymouth: | 6.2% (38) |
| Connecticut: | 6.0% (8,616) |
Number of families with income $20k - 30k:| Plymouth: | 10.5% (64) |
| Connecticut: | 8.9% (12,680) |
Number of families with income $30k - 40k:| Plymouth: | 11.1% (67) |
| State: | 8.5% (12,090) |
Number of families with income $40k - 50k:| Plymouth: | 11.6% (70) |
| Connecticut: | 8.8% (12,624) |
Number of families with income $50k - 60k:| Plymouth: | 9.9% (60) |
| State: | 8.4% (11,924) |
Number of families with income $60k - 75k:| Plymouth: | 14.1% (85) |
| State: | 8.9% (12,677) |
Number of families with income $75k - 100k:| Plymouth: | 14.7% (89) |
| Connecticut: | 14.3% (20,457) |
Number of families with income $100k - 125k:| Plymouth: | 7.0% (42) |
| Connecticut: | 8.2% (11,720) |
Number of families with income $125k - 150k:| Plymouth: | 4.0% (24) |
| State: | 8.2% (11,729) |
Number of families with income $150k - 200k:| Plymouth: | 3.9% (24) |
| State: | 7.1% (10,096) |
Number of families with income > $200k:| Plymouth: | 0.7% (4) |
| State: | 7.4% (10,622) |
Median non-family income in Plymouth in 2022:| Plymouth: | $70,521 |
| Connecticut: | $36,714 |
Change in median non-family income between 2000 and 2022:| Plymouth, Connecticut: | +73.9% |
| State: | +90.0% |
Median per capita income in Plymouth in 2022:| Plymouth: | $25,767 |
| Connecticut: | $28,507 |
Change in median per capita income between 2000 and 2022:| Plymouth, Connecticut: | +80.3% |
| State: | +117.2% |
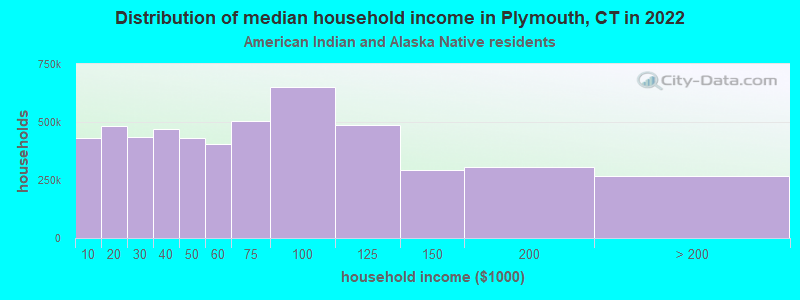
Income statistics for American Indian and Alaska Native residents
Median household income in Plymouth, CT in 2022:| Plymouth: | $171,936 |
| State: | $41,848 |
Change in median household income between 2000 and 2022:| Plymouth, Connecticut: | +12.9% |
| State: | +12.9% |
Number of households with income < $10k:| Plymouth: | 8.4% (433,182) |
| State: | 10.2% (340) |
Number of households with income $10k - 20k:| Plymouth: | 9.4% (483,420) |
| State: | 8.5% (283) |
Number of households with income $20k - 30k:| Plymouth: | 8.5% (437,259) |
| State: | 9.4% (314) |
Number of households with income $30k - 40k:| Plymouth: | 9.1% (468,470) |
| Connecticut: | 10.1% (337) |
Number of households with income $40k - 50k:| Plymouth: | 8.3% (429,711) |
| State: | 13.4% (447) |
Number of households with income $50k - 60k:| Plymouth: | 7.8% (405,183) |
| State: | 3.1% (104) |
Number of households with income $60k - 75k:| Plymouth: | 9.8% (505,042) |
| State: | 5.6% (188) |
Number of households with income $75k - 100k:| Plymouth: | 12.6% (651,928) |
| State: | 13.4% (447) |
Number of households with income $100k - 125k:| Plymouth: | 9.4% (487,512) |
| Connecticut: | 9.5% (317) |
Number of households with income $125k - 150k:| Plymouth: | 5.6% (291,871) |
| State: | 3.9% (131) |
Number of households with income $150k - 200k:| Plymouth: | 6.0% (307,688) |
| State: | 6.3% (212) |
Number of households with income > $200k:| Plymouth: | 5.2% (266,321) |
| Connecticut: | 6.8% (228) |
Aggregate household income in Plymouth in 2022: $596,300
Median family income in Plymouth in 2022:| Plymouth: | $208,159 |
| State: | $57,217 |
Number of families with income $150k - 200k:| Plymouth: | 100.0% (29) |
| State: | 10.3% (207) |
Median per capita income in Plymouth in 2022:| Plymouth: | $45,100 |
| Connecticut: | $25,355 |
Change in median per capita income between 2000 and 2022:| Plymouth, Connecticut: | +45.9% |
| State: | +39.4% |
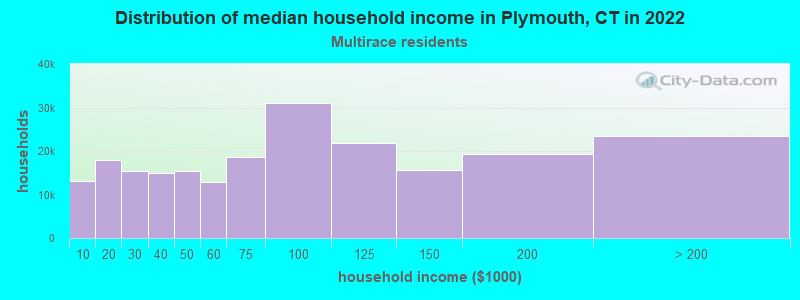
Income statistics for Multirace residents
Median household income in Plymouth, CT in 2022:| Plymouth: | $139,895 |
| Connecticut: | $77,277 |
Change in median household income between 2000 and 2022:| Plymouth, Connecticut: | +119.4% |
| State: | +113.6% |
Number of households with income < $10k:| Plymouth: | 6.0% (13,137) |
| Connecticut: | 6.0% (7,457) |
Number of households with income $10k - 20k:| Plymouth: | 8.1% (17,863) |
| State: | 8.1% (10,139) |
Number of households with income $20k - 30k:| Plymouth: | 7.0% (15,331) |
| Connecticut: | 7.0% (8,702) |
Number of households with income $30k - 40k:| Plymouth: | 6.9% (15,056) |
| State: | 6.9% (8,546) |
Number of households with income $40k - 50k:| Plymouth: | 7.0% (15,348) |
| State: | 7.0% (8,712) |
Number of households with income $50k - 60k:| Plymouth: | 5.9% (12,915) |
| Connecticut: | 5.9% (7,331) |
Number of households with income $60k - 75k:| Plymouth: | 8.5% (18,734) |
| State: | 8.5% (10,634) |
Number of households with income $75k - 100k:| Plymouth: | 14.1% (31,006) |
| State: | 14.1% (17,600) |
Number of households with income $100k - 125k:| Plymouth: | 9.9% (21,816) |
| Connecticut: | 9.9% (12,383) |
Number of households with income $125k - 150k:| Plymouth: | 7.2% (15,716) |
| Connecticut: | 7.2% (8,921) |
Number of households with income $150k - 200k:| Plymouth: | 8.8% (19,242) |
| State: | 8.8% (10,922) |
Number of households with income > $200k:| Plymouth: | 10.6% (23,338) |
| State: | 10.6% (13,247) |
Aggregate household income in Plymouth in 2022: $58,193,515
Median family income in Plymouth in 2022:| Plymouth: | $172,457 |
| Connecticut: | $84,255 |
Number of families with income $20k - 30k:| Plymouth: | 5.6% (24) |
| Connecticut: | 6.9% (5,812) |
Number of families with income $30k - 40k:| Plymouth: | 8.6% (37) |
| State: | 6.8% (5,759) |
Number of families with income $60k - 75k:| Plymouth: | 5.4% (23) |
| State: | 7.8% (6,550) |
Number of families with income $75k - 100k:| Plymouth: | 17.8% (76) |
| State: | 14.5% (12,236) |
Number of families with income $100k - 125k:| Plymouth: | 22.1% (94) |
| Connecticut: | 9.2% (7,787) |
Number of families with income $125k - 150k:| Plymouth: | 40.6% (173) |
| State: | 8.9% (7,503) |
Median non-family income in Plymouth in 2022:| Plymouth: | $47,518 |
| State: | $44,462 |
Change in median non-family income between 2000 and 2022:| Plymouth, Connecticut: | +81.0% |
| Connecticut: | +97.6% |
Median per capita income in Plymouth in 2022:| Plymouth: | $39,358 |
| State: | $32,794 |
Change in median per capita income between 2000 and 2022:| Plymouth, Connecticut: | +95.5% |
| State: | +117.2% |
Income statistics for other residents
Number of households with income < $10k:| Plymouth: | 9.0% (26,111) |
| State: | 9.0% (8,596) |
Number of households with income $10k - 20k:| Plymouth: | 10.2% (29,687) |
| State: | 10.2% (9,773) |
Number of households with income $20k - 30k:| Plymouth: | 9.1% (26,399) |
| Connecticut: | 9.1% (8,691) |
Number of households with income $30k - 40k:| Plymouth: | 7.8% (22,621) |
| Connecticut: | 7.8% (7,447) |
Number of households with income $40k - 50k:| Plymouth: | 8.2% (23,876) |
| State: | 8.2% (7,860) |
Number of households with income $50k - 60k:| Plymouth: | 6.0% (17,487) |
| State: | 6.0% (5,757) |
Number of households with income $60k - 75k:| Plymouth: | 9.3% (27,162) |
| State: | 9.3% (8,942) |
Number of households with income $75k - 100k:| Plymouth: | 14.3% (41,615) |
| State: | 14.3% (13,700) |
Number of households with income $100k - 125k:| Plymouth: | 7.2% (20,977) |
| Connecticut: | 7.2% (6,906) |
Number of households with income $125k - 150k:| Plymouth: | 6.5% (18,879) |
| Connecticut: | 6.5% (6,215) |
Number of households with income $150k - 200k:| Plymouth: | 6.1% (17,815) |
| State: | 6.1% (5,865) |
Number of households with income > $200k:| Plymouth: | 6.3% (18,423) |
| Connecticut: | 6.3% (6,065) |
Median per capita income in Plymouth in 2022:| Plymouth: | $88,027 |
| State: | $29,353 |