Plainville, Connecticut (CT) income map, earnings map, and wages data
The median household income in Plainville, CT in 2022 was $81,452, which was 8.6% less than the median annual income of $88,429 across the entire state of Connecticut. Compared to the median income of $48,136 in 2000 this represents an increase of 40.9%. The per capita income in 2022 was $42,543, which means an increase of 45.3% compared to 2000 when it was $23,257.
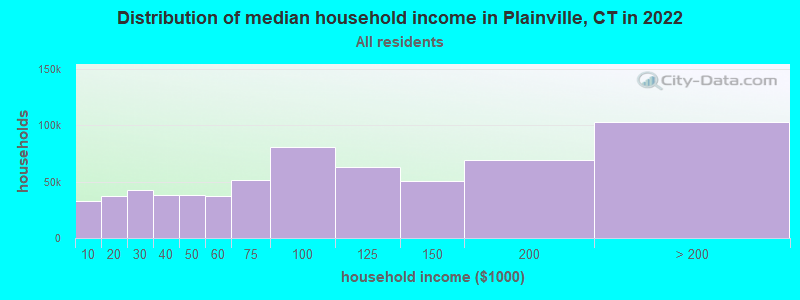
Income statistics for all residents
Median household income in Plainville, CT in 2022:| Plainville: | $81,453 |
| Connecticut: | $88,429 |
Change in median household income between 2000 and 2022:| Plainville, Connecticut: | +69.2% |
| State: | +64.0% |
Number of households with income < $10k:| Plainville: | 5.2% (33,177) |
| Connecticut: | 5.1% (72,746) |
Number of households with income $10k - 20k:| Plainville: | 5.8% (37,412) |
| State: | 5.7% (81,643) |
Number of households with income $20k - 30k:| Plainville: | 6.6% (42,348) |
| State: | 6.5% (92,844) |
Number of households with income $30k - 40k:| Plainville: | 5.9% (38,003) |
| State: | 5.9% (83,934) |
Number of households with income $40k - 50k:| Plainville: | 5.9% (37,760) |
| State: | 5.8% (83,025) |
Number of households with income $50k - 60k:| Plainville: | 5.8% (37,026) |
| State: | 5.7% (81,788) |
Number of households with income $60k - 75k:| Plainville: | 8.1% (51,878) |
| State: | 8.1% (115,651) |
Number of households with income $75k - 100k:| Plainville: | 12.6% (81,022) |
| Connecticut: | 12.6% (180,173) |
Number of households with income $100k - 125k:| Plainville: | 9.8% (63,075) |
| State: | 9.9% (141,231) |
Number of households with income $125k - 150k:| Plainville: | 7.8% (50,371) |
| State: | 7.9% (112,826) |
Number of households with income $150k - 200k:| Plainville: | 10.7% (68,904) |
| State: | 10.8% (154,641) |
Number of households with income > $200k:| Plainville: | 16.0% (102,938) |
| State: | 16.3% (233,133) |
Aggregate household income in Plainville in 2022: $17,091,224,918
Median family income in Plainville in 2022:| Plainville: | $108,206 |
| Connecticut: | $115,183 |
Median non-family income in Plainville in 2022:| Plainville: | $49,051 |
| State: | $50,964 |
Change in median non-family income between 2000 and 2022:| Plainville, Connecticut: | +71.5% |
| State: | +65.1% |
Median per capita income in Plainville in 2022:| Plainville: | $42,544 |
| Connecticut: | $51,581 |
Change in median per capita income between 2000 and 2022:| Plainville, Connecticut: | +82.9% |
| State: | +79.3% |
Income statistics for White residents
Median household income in Plainville, CT in 2022:| Plainville: | $80,469 |
| State: | $96,890 |
Change in median household income between 2000 and 2022:| Plainville, Connecticut: | +69.4% |
| Connecticut: | +68.5% |
Number of households with income < $10k:| Plainville: | 4.2% (17,600) |
| State: | 4.2% (42,265) |
Number of households with income $10k - 20k:| Plainville: | 4.9% (20,235) |
| Connecticut: | 4.8% (48,323) |
Number of households with income $20k - 30k:| Plainville: | 5.8% (24,065) |
| State: | 5.7% (57,716) |
Number of households with income $30k - 40k:| Plainville: | 5.4% (22,276) |
| Connecticut: | 5.3% (53,827) |
Number of households with income $40k - 50k:| Plainville: | 5.3% (22,184) |
| State: | 5.3% (53,301) |
Number of households with income $50k - 60k:| Plainville: | 5.6% (23,086) |
| Connecticut: | 5.5% (55,690) |
Number of households with income $60k - 75k:| Plainville: | 7.9% (32,991) |
| State: | 8.0% (80,329) |
Number of households with income $75k - 100k:| Plainville: | 12.7% (52,865) |
| State: | 12.7% (128,070) |
Number of households with income $100k - 125k:| Plainville: | 10.0% (41,511) |
| Connecticut: | 10.0% (101,210) |
Number of households with income $125k - 150k:| Plainville: | 8.0% (33,326) |
| State: | 8.0% (81,250) |
Number of households with income $150k - 200k:| Plainville: | 11.8% (49,003) |
| State: | 11.8% (119,527) |
Number of households with income > $200k:| Plainville: | 18.4% (76,712) |
| Connecticut: | 18.6% (187,875) |
Aggregate household income in Plainville in 2022: $12,216,969,166
Median family income in Plainville in 2022:| Plainville: | $111,317 |
| Connecticut: | $128,955 |
Number of families with income < $10k:| Plainville: | 4.7% (123) |
| State: | 1.9% (11,537) |
Number of families with income $10k - 20k:| Plainville: | 2.6% (69) |
| State: | 1.8% (11,289) |
Number of families with income $20k - 30k:| Plainville: | 4.9% (129) |
| Connecticut: | 3.0% (18,506) |
Number of families with income $30k - 40k:| Plainville: | 7.4% (195) |
| Connecticut: | 2.9% (18,160) |
Number of families with income $40k - 50k:| Plainville: | 6.6% (175) |
| State: | 3.9% (24,550) |
Number of families with income $50k - 60k:| Plainville: | 6.8% (180) |
| State: | 4.3% (26,723) |
Number of families with income $60k - 75k:| Plainville: | 12.4% (327) |
| State: | 7.1% (44,075) |
Number of families with income $75k - 100k:| Plainville: | 21.0% (555) |
| Connecticut: | 12.5% (77,679) |
Number of families with income $100k - 125k:| Plainville: | 15.4% (407) |
| State: | 11.1% (69,086) |
Number of families with income $125k - 150k:| Plainville: | 8.7% (230) |
| State: | 9.6% (59,616) |
Number of families with income $150k - 200k:| Plainville: | 4.7% (124) |
| Connecticut: | 15.7% (97,890) |
Number of families with income > $200k:| Plainville: | 4.8% (126) |
| State: | 26.3% (163,417) |
Median non-family income in Plainville in 2022:| Plainville: | $49,782 |
| State: | $54,067 |
Change in median non-family income between 2000 and 2022:| Plainville, Connecticut: | +73.7% |
| State: | +68.7% |
Median per capita income in Plainville in 2022:| Plainville: | $45,039 |
| State: | $59,916 |
Change in median per capita income between 2000 and 2022:| Plainville, Connecticut: | +92.1% |
| Connecticut: | +90.2% |
Income statistics for Black or African American residents
Median household income in Plainville, CT in 2022:| Plainville: | $99,140 |
| Connecticut: | $61,803 |
Change in median household income between 2000 and 2022:| Plainville, Connecticut: | +60.9% |
| State: | +76.1% |
Number of households with income < $10k:| Plainville: | 6.8% (16,663) |
| State: | 6.8% (9,494) |
Number of households with income $10k - 20k:| Plainville: | 7.9% (19,312) |
| State: | 7.9% (11,003) |
Number of households with income $20k - 30k:| Plainville: | 10.8% (26,407) |
| State: | 10.8% (15,045) |
Number of households with income $30k - 40k:| Plainville: | 8.2% (20,186) |
| Connecticut: | 8.2% (11,501) |
Number of households with income $40k - 50k:| Plainville: | 7.4% (18,281) |
| Connecticut: | 7.4% (10,416) |
Number of households with income $50k - 60k:| Plainville: | 7.5% (18,489) |
| State: | 7.5% (10,534) |
Number of households with income $60k - 75k:| Plainville: | 8.0% (19,735) |
| Connecticut: | 8.0% (11,244) |
Number of households with income $75k - 100k:| Plainville: | 9.6% (23,466) |
| State: | 9.6% (13,370) |
Number of households with income $100k - 125k:| Plainville: | 10.2% (25,000) |
| Connecticut: | 10.2% (14,244) |
Number of households with income $125k - 150k:| Plainville: | 8.0% (19,738) |
| Connecticut: | 8.0% (11,246) |
Number of households with income $150k - 200k:| Plainville: | 7.7% (18,828) |
| State: | 7.7% (10,727) |
Number of households with income > $200k:| Plainville: | 7.9% (19,458) |
| Connecticut: | 7.9% (11,086) |
Aggregate household income in Plainville in 2022: $64,225,879
Median family income in Plainville in 2022:| Plainville: | $135,376 |
| Connecticut: | $87,228 |
Number of families with income < $10k:| Plainville: | 2.2% (4) |
| Connecticut: | 3.8% (3,184) |
Number of families with income $20k - 30k:| Plainville: | 1.3% (2) |
| Connecticut: | 6.0% (5,015) |
Number of families with income $30k - 40k:| Plainville: | 7.4% (12) |
| Connecticut: | 7.7% (6,445) |
Number of families with income $40k - 50k:| Plainville: | 7.2% (12) |
| Connecticut: | 6.6% (5,531) |
Number of families with income $50k - 60k:| Plainville: | 5.0% (8) |
| State: | 5.4% (4,480) |
Number of families with income $60k - 75k:| Plainville: | 18.6% (30) |
| State: | 8.2% (6,861) |
Number of families with income $75k - 100k:| Plainville: | 13.9% (23) |
| State: | 12.7% (10,598) |
Number of families with income $100k - 125k:| Plainville: | 44.5% (73) |
| State: | 11.4% (9,482) |
Median non-family income in Plainville in 2022:| Plainville: | $119,461 |
| State: | $38,608 |
Change in median non-family income between 2000 and 2022:| Plainville, Connecticut: | +77.0% |
| State: | +77.0% |
Median per capita income in Plainville in 2022:| Plainville: | $57,737 |
| State: | $36,289 |
Change in median per capita income between 2000 and 2022:| Plainville, Connecticut: | +115.2% |
| Connecticut: | +117.5% |
Income statistics for Asian residents
Median household income in Plainville, CT in 2022:| Plainville: | $76,741 |
| State: | $110,568 |
Change in median household income between 2000 and 2022:| Plainville, Connecticut: | +110.1% |
| State: | +79.5% |
Number of households with income < $10k:| Plainville: | 7.1% (2,518) |
| State: | 7.1% (4,245) |
Number of households with income $10k - 20k:| Plainville: | 3.5% (1,238) |
| State: | 3.5% (2,087) |
Number of households with income $20k - 30k:| Plainville: | 4.1% (1,461) |
| State: | 4.1% (2,464) |
Number of households with income $30k - 40k:| Plainville: | 4.1% (1,470) |
| State: | 4.1% (2,478) |
Number of households with income $40k - 50k:| Plainville: | 3.3% (1,176) |
| State: | 3.3% (1,983) |
Number of households with income $50k - 60k:| Plainville: | 3.9% (1,381) |
| State: | 3.9% (2,328) |
Number of households with income $60k - 75k:| Plainville: | 7.0% (2,508) |
| Connecticut: | 7.0% (4,228) |
Number of households with income $75k - 100k:| Plainville: | 11.5% (4,099) |
| State: | 11.5% (6,911) |
Number of households with income $100k - 125k:| Plainville: | 10.2% (3,634) |
| State: | 10.2% (6,127) |
Number of households with income $125k - 150k:| Plainville: | 8.5% (3,012) |
| Connecticut: | 8.5% (5,079) |
Number of households with income $150k - 200k:| Plainville: | 12.4% (4,409) |
| State: | 12.4% (7,434) |
Number of households with income > $200k:| Plainville: | 24.4% (8,696) |
| Connecticut: | 24.4% (14,661) |
Aggregate household income in Plainville in 2022: $22,286,135
Median family income in Plainville in 2022:| Plainville: | $106,827 |
| State: | $134,548 |
Number of families with income < $10k:| Plainville: | 31.2% (29) |
| Connecticut: | 4.3% (1,875) |
Number of families with income $10k - 20k:| Plainville: | 8.9% (8) |
| State: | 1.6% (700) |
Number of families with income $50k - 60k:| Plainville: | 9.2% (9) |
| State: | 3.7% (1,635) |
Number of families with income $75k - 100k:| Plainville: | 18.2% (17) |
| State: | 11.0% (4,844) |
Number of families with income $100k - 125k:| Plainville: | 32.6% (31) |
| Connecticut: | 10.5% (4,621) |
Median non-family income in Plainville in 2022:| Plainville: | $87,697 |
| State: | $63,785 |
Change in median non-family income between 2000 and 2022:| Plainville, Connecticut: | +148.6% |
| State: | +77.9% |
Median per capita income in Plainville in 2022:| Plainville: | $41,465 |
| State: | $55,295 |
Change in median per capita income between 2000 and 2022:| Plainville, Connecticut: | +103.6% |
| Connecticut: | +97.8% |
Income statistics for Hispanic or Latino residents
Median household income in Plainville, CT in 2022:| Plainville: | $77,605 |
| State: | $60,275 |
Change in median household income between 2000 and 2022:| Plainville, Connecticut: | +67.8% |
| State: | +87.9% |
Number of households with income < $10k:| Plainville: | 8.7% (26,797) |
| State: | 8.7% (18,584) |
Number of households with income $10k - 20k:| Plainville: | 9.1% (27,735) |
| Connecticut: | 9.1% (19,235) |
Number of households with income $20k - 30k:| Plainville: | 8.9% (27,381) |
| State: | 8.9% (18,989) |
Number of households with income $30k - 40k:| Plainville: | 7.5% (23,024) |
| State: | 7.5% (15,967) |
Number of households with income $40k - 50k:| Plainville: | 8.7% (26,627) |
| State: | 8.7% (18,466) |
Number of households with income $50k - 60k:| Plainville: | 6.9% (21,205) |
| Connecticut: | 6.9% (14,706) |
Number of households with income $60k - 75k:| Plainville: | 8.9% (27,235) |
| State: | 8.9% (18,888) |
Number of households with income $75k - 100k:| Plainville: | 13.5% (41,339) |
| State: | 13.5% (28,669) |
Number of households with income $100k - 125k:| Plainville: | 8.2% (25,139) |
| State: | 8.2% (17,434) |
Number of households with income $125k - 150k:| Plainville: | 6.5% (19,829) |
| State: | 6.5% (13,752) |
Number of households with income $150k - 200k:| Plainville: | 6.6% (20,351) |
| Connecticut: | 6.6% (14,114) |
Number of households with income > $200k:| Plainville: | 6.4% (19,654) |
| Connecticut: | 6.4% (13,630) |
Aggregate household income in Plainville in 2022: $71,193,962
Median family income in Plainville in 2022:| Plainville: | $102,862 |
| Connecticut: | $68,336 |
Number of families with income < $10k:| Plainville: | 7.3% (62) |
| State: | 5.2% (7,456) |
Number of families with income $10k - 20k:| Plainville: | 5.6% (47) |
| Connecticut: | 6.0% (8,616) |
Number of families with income $20k - 30k:| Plainville: | 11.7% (99) |
| State: | 8.9% (12,680) |
Number of families with income $30k - 40k:| Plainville: | 13.1% (111) |
| Connecticut: | 8.5% (12,090) |
Number of families with income $40k - 50k:| Plainville: | 10.1% (86) |
| Connecticut: | 8.8% (12,624) |
Number of families with income $50k - 60k:| Plainville: | 10.0% (85) |
| Connecticut: | 8.4% (11,924) |
Number of families with income $60k - 75k:| Plainville: | 10.1% (86) |
| State: | 8.9% (12,677) |
Number of families with income $75k - 100k:| Plainville: | 16.9% (143) |
| Connecticut: | 14.3% (20,457) |
Number of families with income $100k - 125k:| Plainville: | 7.7% (65) |
| State: | 8.2% (11,720) |
Number of families with income $125k - 150k:| Plainville: | 5.1% (43) |
| Connecticut: | 8.2% (11,729) |
Number of families with income $150k - 200k:| Plainville: | 1.4% (12) |
| State: | 7.1% (10,096) |
Number of families with income > $200k:| Plainville: | 0.8% (7) |
| Connecticut: | 7.4% (10,622) |
Median non-family income in Plainville in 2022:| Plainville: | $29,887 |
| Connecticut: | $36,714 |
Change in median non-family income between 2000 and 2022:| Plainville, Connecticut: | +73.9% |
| State: | +90.0% |
Median per capita income in Plainville in 2022:| Plainville: | $37,372 |
| Connecticut: | $28,507 |
Change in median per capita income between 2000 and 2022:| Plainville, Connecticut: | +80.3% |
| State: | +117.2% |
Income statistics for American Indian and Alaska Native residents
Median household income in Plainville, CT in 2022:| Plainville: | $29,470 |
| State: | $41,848 |
Change in median household income between 2000 and 2022:| Plainville, Connecticut: | +12.9% |
| Connecticut: | +12.9% |
Number of households with income < $10k:| Plainville: | 8.4% (74,248) |
| State: | 10.2% (340) |
Number of households with income $10k - 20k:| Plainville: | 9.4% (82,859) |
| State: | 8.5% (283) |
Number of households with income $20k - 30k:| Plainville: | 8.5% (74,947) |
| State: | 9.4% (314) |
Number of households with income $30k - 40k:| Plainville: | 9.1% (80,296) |
| Connecticut: | 10.1% (337) |
Number of households with income $40k - 50k:| Plainville: | 8.3% (73,653) |
| State: | 13.4% (447) |
Number of households with income $50k - 60k:| Plainville: | 7.8% (69,449) |
| Connecticut: | 3.1% (104) |
Number of households with income $60k - 75k:| Plainville: | 9.8% (86,565) |
| State: | 5.6% (188) |
Number of households with income $75k - 100k:| Plainville: | 12.6% (111,742) |
| State: | 13.4% (447) |
Number of households with income $100k - 125k:| Plainville: | 9.4% (83,560) |
| Connecticut: | 9.5% (317) |
Number of households with income $125k - 150k:| Plainville: | 5.6% (50,027) |
| State: | 3.9% (131) |
Number of households with income $150k - 200k:| Plainville: | 6.0% (52,738) |
| State: | 6.3% (212) |
Number of households with income > $200k:| Plainville: | 5.2% (45,648) |
| Connecticut: | 6.8% (228) |
Aggregate household income in Plainville in 2022: $1,392,641
Median family income in Plainville in 2022:| Plainville: | $6,676 |
| State: | $57,217 |
Number of families with income < $10k:| Plainville: | 36.4% (7) |
| Connecticut: | 6.1% (123) |
Number of families with income $50k - 60k:| Plainville: | 63.6% (12) |
| State: | 2.3% (46) |
Median non-family income in Plainville in 2022:| Plainville: | $59,084 |
| State: | $40,310 |
Change in median non-family income between 2000 and 2022:| Plainville, Connecticut: | +125.1% |
| Connecticut: | +125.1% |
Median per capita income in Plainville in 2022:| Plainville: | $17,763 |
| Connecticut: | $25,355 |
Change in median per capita income between 2000 and 2022:| Plainville, Connecticut: | +45.9% |
| State: | +39.4% |
Income statistics for Multirace residents
Median household income in Plainville, CT in 2022:| Plainville: | $136,096 |
| Connecticut: | $77,277 |
Change in median household income between 2000 and 2022:| Plainville, Connecticut: | +119.4% |
| State: | +113.6% |
Number of households with income < $10k:| Plainville: | 6.0% (12,781) |
| State: | 6.0% (7,457) |
Number of households with income $10k - 20k:| Plainville: | 8.1% (17,377) |
| State: | 8.1% (10,139) |
Number of households with income $20k - 30k:| Plainville: | 7.0% (14,915) |
| Connecticut: | 7.0% (8,702) |
Number of households with income $30k - 40k:| Plainville: | 6.9% (14,647) |
| State: | 6.9% (8,546) |
Number of households with income $40k - 50k:| Plainville: | 7.0% (14,932) |
| State: | 7.0% (8,712) |
Number of households with income $50k - 60k:| Plainville: | 5.9% (12,565) |
| State: | 5.9% (7,331) |
Number of households with income $60k - 75k:| Plainville: | 8.5% (18,226) |
| Connecticut: | 8.5% (10,634) |
Number of households with income $75k - 100k:| Plainville: | 14.1% (30,165) |
| State: | 14.1% (17,600) |
Number of households with income $100k - 125k:| Plainville: | 9.9% (21,223) |
| State: | 9.9% (12,383) |
Number of households with income $125k - 150k:| Plainville: | 7.2% (15,290) |
| Connecticut: | 7.2% (8,921) |
Number of households with income $150k - 200k:| Plainville: | 8.8% (18,719) |
| State: | 8.8% (10,922) |
Number of households with income > $200k:| Plainville: | 10.6% (22,704) |
| State: | 10.6% (13,247) |
Aggregate household income in Plainville in 2022: $63,861,333
Median family income in Plainville in 2022:| Plainville: | $130,105 |
| State: | $84,255 |
Number of families with income < $10k:| Plainville: | 8.5% (30) |
| State: | 3.6% (3,027) |
Number of families with income $40k - 50k:| Plainville: | 4.1% (15) |
| State: | 6.9% (5,792) |
Number of families with income $50k - 60k:| Plainville: | 6.4% (23) |
| State: | 7.6% (6,420) |
Number of families with income $60k - 75k:| Plainville: | 10.7% (38) |
| State: | 7.8% (6,550) |
Number of families with income $75k - 100k:| Plainville: | 27.7% (99) |
| State: | 14.5% (12,236) |
Number of families with income $125k - 150k:| Plainville: | 42.5% (151) |
| Connecticut: | 8.9% (7,503) |
Median non-family income in Plainville in 2022:| Plainville: | $128,979 |
| State: | $44,462 |
Change in median non-family income between 2000 and 2022:| Plainville, Connecticut: | +81.0% |
| State: | +97.6% |
Median per capita income in Plainville in 2022:| Plainville: | $30,410 |
| Connecticut: | $32,794 |
Change in median per capita income between 2000 and 2022:| Plainville, Connecticut: | +95.5% |
| State: | +117.2% |
Income statistics for other residents
Number of households with income < $10k:| Plainville: | 9.1% (10) |
| State: | 9.0% (8,596) |
Number of households with income $10k - 20k:| Plainville: | 10.0% (11) |
| State: | 10.2% (9,773) |
Number of households with income $20k - 30k:| Plainville: | 9.1% (10) |
| State: | 9.1% (8,691) |
Number of households with income $30k - 40k:| Plainville: | 7.3% (8) |
| State: | 7.8% (7,447) |
Number of households with income $40k - 50k:| Plainville: | 8.2% (9) |
| State: | 8.2% (7,860) |
Number of households with income $50k - 60k:| Plainville: | 6.4% (7) |
| Connecticut: | 6.0% (5,757) |
Number of households with income $60k - 75k:| Plainville: | 9.1% (10) |
| Connecticut: | 9.3% (8,942) |
Number of households with income $75k - 100k:| Plainville: | 14.5% (16) |
| State: | 14.3% (13,700) |
Number of households with income $100k - 125k:| Plainville: | 7.3% (8) |
| State: | 7.2% (6,906) |
Number of households with income $125k - 150k:| Plainville: | 6.4% (7) |
| Connecticut: | 6.5% (6,215) |
Number of households with income $150k - 200k:| Plainville: | 6.4% (7) |
| Connecticut: | 6.1% (5,865) |
Number of households with income > $200k:| Plainville: | 6.4% (7) |
| State: | 6.3% (6,065) |
Aggregate household income in Plainville in 2022: $15,517,108
Median family income in Plainville in 2022:| Plainville: | $188,310 |
| State: | $67,610 |
Number of families with income $10k - 20k:| Plainville: | 10.3% (5) |
| State: | 7.5% (4,961) |
Number of families with income $75k - 100k:| Plainville: | 89.7% (48) |
| State: | 15.7% (10,362) |
Median non-family income in Plainville in 2022:| Plainville: | $31,466 |
| State: | $34,285 |
Change in median non-family income between 2000 and 2022:| Plainville, Connecticut: | +83.6% |
| State: | +83.6% |
Median per capita income in Plainville in 2022:| Plainville: | $37,289 |
| State: | $29,353 |