Picnic Point-North Lynnwood, Washington (WA) income map, earnings map, and wages data
The median household income in Picnic Point-North Lynnwood, WA in 2022 was $105,077, which was 13.1% greater than the median annual income of $91,306 across the entire state of Washington. Compared to the median income of $54,913 in 2000 this represents an increase of 47.7%. The per capita income in 2022 was $52,621, which means an increase of 54.4% compared to 2000 when it was $24,003.
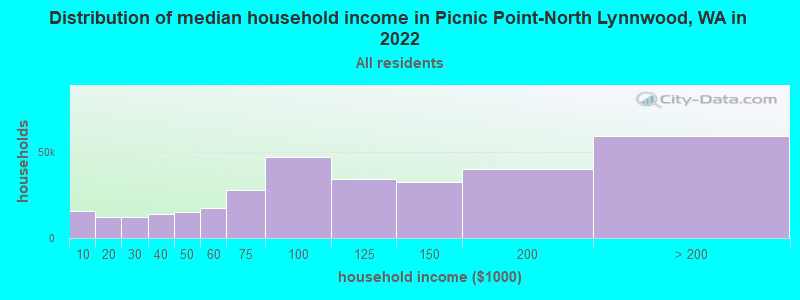
Income statistics for all residents
Median household income in Picnic Point-North Lynnwood, WA in 2022:| Picnic Point-North Lynnwood: | $105,078 |
| State: | $91,306 |
Change in median household income between 2000 and 2022:| Picnic Point-North Lynnwood, Washington: | +91.4% |
| State: | +99.5% |
Number of households with income < $10k:| Picnic Point-North Lynnwood: | 4.8% (15,567) |
| State: | 4.5% (139,331) |
Number of households with income $10k - 20k:| Picnic Point-North Lynnwood: | 3.8% (12,416) |
| State: | 5.0% (154,508) |
Number of households with income $20k - 30k:| Picnic Point-North Lynnwood: | 3.7% (12,051) |
| Washington: | 5.4% (166,555) |
Number of households with income $30k - 40k:| Picnic Point-North Lynnwood: | 4.3% (14,071) |
| State: | 5.5% (170,324) |
Number of households with income $40k - 50k:| Picnic Point-North Lynnwood: | 4.5% (14,751) |
| State: | 6.0% (183,941) |
Number of households with income $50k - 60k:| Picnic Point-North Lynnwood: | 5.3% (17,283) |
| Washington: | 6.1% (187,395) |
Number of households with income $60k - 75k:| Picnic Point-North Lynnwood: | 8.5% (27,640) |
| State: | 8.7% (266,771) |
Number of households with income $75k - 100k:| Picnic Point-North Lynnwood: | 14.3% (46,624) |
| Washington: | 13.1% (404,672) |
Number of households with income $100k - 125k:| Picnic Point-North Lynnwood: | 10.6% (34,394) |
| Washington: | 11.0% (337,911) |
Number of households with income $125k - 150k:| Picnic Point-North Lynnwood: | 9.9% (32,303) |
| Washington: | 8.0% (244,934) |
Number of households with income $150k - 200k:| Picnic Point-North Lynnwood: | 12.2% (39,809) |
| Washington: | 10.5% (323,812) |
Number of households with income > $200k:| Picnic Point-North Lynnwood: | 18.1% (58,975) |
| State: | 16.2% (499,799) |
Aggregate household income in Picnic Point-North Lynnwood in 2022: $10,614,155,821
Median family income in Picnic Point-North Lynnwood in 2022:| Picnic Point-North Lynnwood: | $131,301 |
| State: | $109,192 |
Median non-family income in Picnic Point-North Lynnwood in 2022:| Picnic Point-North Lynnwood: | $70,287 |
| State: | $57,299 |
Change in median non-family income between 2000 and 2022:| Picnic Point-North Lynnwood, Washington: | +89.1% |
| State: | +94.9% |
Median per capita income in Picnic Point-North Lynnwood in 2022:| Picnic Point-North Lynnwood: | $52,622 |
| Washington: | $50,764 |
Change in median per capita income between 2000 and 2022:| Picnic Point-North Lynnwood, Washington: | +119.2% |
| Washington: | +121.0% |
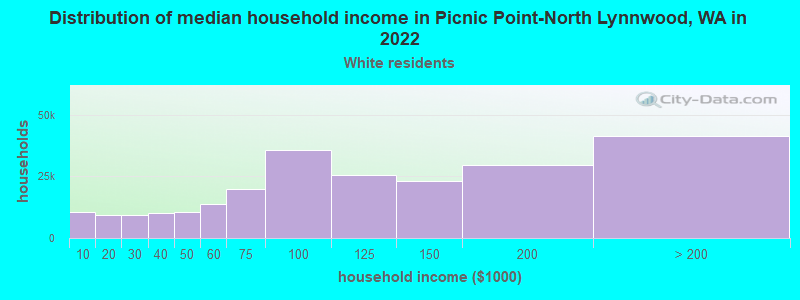
Income statistics for White residents
Median household income in Picnic Point-North Lynnwood, WA in 2022:| Picnic Point-North Lynnwood: | $104,900 |
| Washington: | $91,916 |
Change in median household income between 2000 and 2022:| Picnic Point-North Lynnwood, Washington: | +86.4% |
| State: | +95.4% |
Number of households with income < $10k:| Picnic Point-North Lynnwood: | 4.4% (10,524) |
| State: | 4.3% (95,850) |
Number of households with income $10k - 20k:| Picnic Point-North Lynnwood: | 3.9% (9,386) |
| State: | 4.8% (106,421) |
Number of households with income $20k - 30k:| Picnic Point-North Lynnwood: | 3.9% (9,438) |
| State: | 5.5% (122,860) |
Number of households with income $30k - 40k:| Picnic Point-North Lynnwood: | 4.2% (10,134) |
| Washington: | 5.4% (119,627) |
Number of households with income $40k - 50k:| Picnic Point-North Lynnwood: | 4.4% (10,510) |
| Washington: | 5.9% (132,276) |
Number of households with income $50k - 60k:| Picnic Point-North Lynnwood: | 5.9% (13,991) |
| State: | 6.1% (136,212) |
Number of households with income $60k - 75k:| Picnic Point-North Lynnwood: | 8.3% (19,795) |
| State: | 8.8% (196,086) |
Number of households with income $75k - 100k:| Picnic Point-North Lynnwood: | 14.9% (35,700) |
| Washington: | 13.4% (299,192) |
Number of households with income $100k - 125k:| Picnic Point-North Lynnwood: | 10.8% (25,729) |
| State: | 11.3% (252,209) |
Number of households with income $125k - 150k:| Picnic Point-North Lynnwood: | 9.6% (23,060) |
| Washington: | 7.9% (175,962) |
Number of households with income $150k - 200k:| Picnic Point-North Lynnwood: | 12.3% (29,484) |
| Washington: | 10.7% (239,156) |
Number of households with income > $200k:| Picnic Point-North Lynnwood: | 17.3% (41,375) |
| Washington: | 16.1% (359,917) |
Aggregate household income in Picnic Point-North Lynnwood in 2022: $6,417,252,328
Median family income in Picnic Point-North Lynnwood in 2022:| Picnic Point-North Lynnwood: | $136,030 |
| Washington: | $112,511 |
Number of families with income < $10k:| Picnic Point-North Lynnwood: | 1.8% (103) |
| State: | 2.4% (33,676) |
Number of families with income $10k - 20k:| Picnic Point-North Lynnwood: | 1.6% (90) |
| State: | 2.0% (28,228) |
Number of families with income $20k - 30k:| Picnic Point-North Lynnwood: | 1.5% (84) |
| Washington: | 2.9% (39,288) |
Number of families with income $30k - 40k:| Picnic Point-North Lynnwood: | 2.3% (130) |
| State: | 3.6% (50,190) |
Number of families with income $40k - 50k:| Picnic Point-North Lynnwood: | 2.0% (114) |
| State: | 4.6% (63,009) |
Number of families with income $50k - 60k:| Picnic Point-North Lynnwood: | 2.9% (168) |
| Washington: | 5.0% (69,270) |
Number of families with income $60k - 75k:| Picnic Point-North Lynnwood: | 6.8% (390) |
| State: | 8.2% (112,369) |
Number of families with income $75k - 100k:| Picnic Point-North Lynnwood: | 13.6% (779) |
| Washington: | 14.1% (194,214) |
Number of families with income $100k - 125k:| Picnic Point-North Lynnwood: | 14.5% (829) |
| State: | 13.2% (182,184) |
Number of families with income $125k - 150k:| Picnic Point-North Lynnwood: | 10.2% (584) |
| State: | 9.5% (130,928) |
Number of families with income $150k - 200k:| Picnic Point-North Lynnwood: | 14.9% (851) |
| State: | 13.7% (188,621) |
Number of families with income > $200k:| Picnic Point-North Lynnwood: | 27.8% (1,585) |
| State: | 20.8% (285,982) |
Median non-family income in Picnic Point-North Lynnwood in 2022:| Picnic Point-North Lynnwood: | $68,229 |
| Washington: | $56,103 |
Change in median non-family income between 2000 and 2022:| Picnic Point-North Lynnwood, Washington: | +87.4% |
| State: | +87.7% |
Median per capita income in Picnic Point-North Lynnwood in 2022:| Picnic Point-North Lynnwood: | $59,442 |
| State: | $55,212 |
Change in median per capita income between 2000 and 2022:| Picnic Point-North Lynnwood, Washington: | +128.1% |
| Washington: | +123.8% |
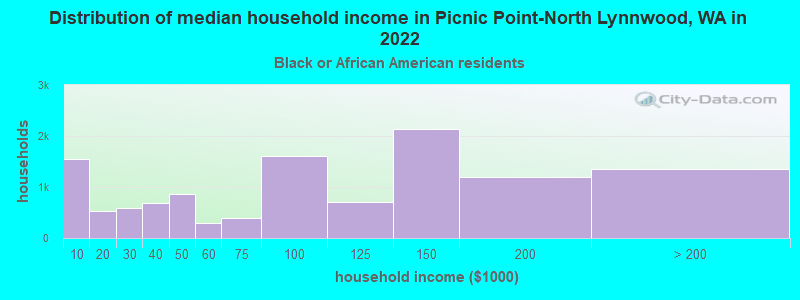
Income statistics for Black or African American residents
Median household income in Picnic Point-North Lynnwood, WA in 2022:| Picnic Point-North Lynnwood: | $102,093 |
| State: | $68,202 |
Change in median household income between 2000 and 2022:| Picnic Point-North Lynnwood, Washington: | +93.7% |
| Washington: | +89.9% |
Number of households with income < $10k:| Picnic Point-North Lynnwood: | 12.9% (1,541) |
| Washington: | 7.2% (8,014) |
Number of households with income $10k - 20k:| Picnic Point-North Lynnwood: | 4.5% (532) |
| Washington: | 8.0% (8,904) |
Number of households with income $20k - 30k:| Picnic Point-North Lynnwood: | 4.9% (583) |
| State: | 7.4% (8,207) |
Number of households with income $30k - 40k:| Picnic Point-North Lynnwood: | 5.8% (691) |
| State: | 5.6% (6,220) |
Number of households with income $40k - 50k:| Picnic Point-North Lynnwood: | 7.3% (866) |
| Washington: | 9.5% (10,585) |
Number of households with income $50k - 60k:| Picnic Point-North Lynnwood: | 2.5% (293) |
| State: | 7.3% (8,078) |
Number of households with income $60k - 75k:| Picnic Point-North Lynnwood: | 3.3% (396) |
| State: | 8.7% (9,704) |
Number of households with income $75k - 100k:| Picnic Point-North Lynnwood: | 13.5% (1,607) |
| Washington: | 12.9% (14,315) |
Number of households with income $100k - 125k:| Picnic Point-North Lynnwood: | 6.0% (712) |
| State: | 7.7% (8,592) |
Number of households with income $125k - 150k:| Picnic Point-North Lynnwood: | 18.0% (2,144) |
| Washington: | 8.9% (9,840) |
Number of households with income $150k - 200k:| Picnic Point-North Lynnwood: | 10.1% (1,199) |
| Washington: | 7.6% (8,434) |
Number of households with income > $200k:| Picnic Point-North Lynnwood: | 11.3% (1,349) |
| Washington: | 9.1% (10,075) |
Aggregate household income in Picnic Point-North Lynnwood in 2022: $93,020,508
Median family income in Picnic Point-North Lynnwood in 2022:| Picnic Point-North Lynnwood: | $114,481 |
| State: | $82,165 |
Number of families with income < $10k:| Picnic Point-North Lynnwood: | 3.3% (12) |
| State: | 5.5% (3,709) |
Number of families with income $20k - 30k:| Picnic Point-North Lynnwood: | 4.7% (17) |
| State: | 4.7% (3,151) |
Number of families with income $40k - 50k:| Picnic Point-North Lynnwood: | 3.5% (12) |
| State: | 6.8% (4,558) |
Number of families with income $50k - 60k:| Picnic Point-North Lynnwood: | 3.0% (11) |
| State: | 7.0% (4,687) |
Number of families with income $60k - 75k:| Picnic Point-North Lynnwood: | 6.4% (23) |
| Washington: | 9.3% (6,231) |
Number of families with income $75k - 100k:| Picnic Point-North Lynnwood: | 14.3% (51) |
| Washington: | 14.8% (9,876) |
Number of families with income $100k - 125k:| Picnic Point-North Lynnwood: | 9.9% (35) |
| State: | 9.0% (6,018) |
Number of families with income $125k - 150k:| Picnic Point-North Lynnwood: | 35.2% (126) |
| State: | 9.5% (6,348) |
Number of families with income $150k - 200k:| Picnic Point-North Lynnwood: | 19.6% (70) |
| Washington: | 8.6% (5,737) |
Median non-family income in Picnic Point-North Lynnwood in 2022:| Picnic Point-North Lynnwood: | $80,183 |
| Washington: | $49,169 |
Change in median non-family income between 2000 and 2022:| Picnic Point-North Lynnwood, Washington: | +67.8% |
| State: | +87.7% |
Median per capita income in Picnic Point-North Lynnwood in 2022:| Picnic Point-North Lynnwood: | $75,320 |
| State: | $38,209 |
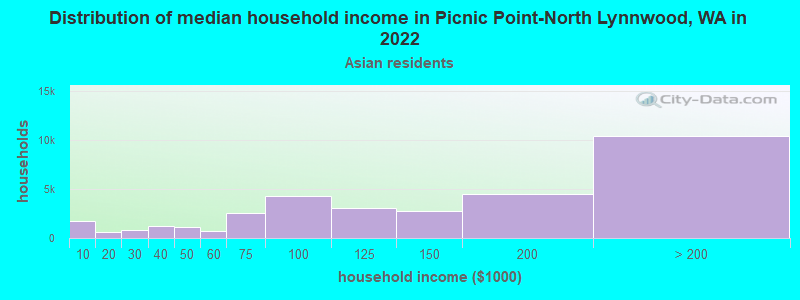
Income statistics for Asian residents
Median household income in Picnic Point-North Lynnwood, WA in 2022:| Picnic Point-North Lynnwood: | $119,947 |
| State: | $125,692 |
Change in median household income between 2000 and 2022:| Picnic Point-North Lynnwood, Washington: | +145.0% |
| Washington: | +164.5% |
Number of households with income < $10k:| Picnic Point-North Lynnwood: | 5.1% (1,703) |
| State: | 4.9% (14,099) |
Number of households with income $10k - 20k:| Picnic Point-North Lynnwood: | 1.7% (580) |
| State: | 3.5% (9,873) |
Number of households with income $20k - 30k:| Picnic Point-North Lynnwood: | 2.3% (766) |
| State: | 2.9% (8,352) |
Number of households with income $30k - 40k:| Picnic Point-North Lynnwood: | 3.6% (1,223) |
| State: | 4.0% (11,415) |
Number of households with income $40k - 50k:| Picnic Point-North Lynnwood: | 3.3% (1,126) |
| Washington: | 4.0% (11,421) |
Number of households with income $50k - 60k:| Picnic Point-North Lynnwood: | 2.1% (711) |
| State: | 4.2% (12,100) |
Number of households with income $60k - 75k:| Picnic Point-North Lynnwood: | 7.5% (2,537) |
| State: | 6.3% (17,903) |
Number of households with income $75k - 100k:| Picnic Point-North Lynnwood: | 12.7% (4,262) |
| Washington: | 10.4% (29,663) |
Number of households with income $100k - 125k:| Picnic Point-North Lynnwood: | 9.1% (3,051) |
| State: | 9.4% (26,839) |
Number of households with income $125k - 150k:| Picnic Point-North Lynnwood: | 8.3% (2,778) |
| State: | 8.5% (24,200) |
Number of households with income $150k - 200k:| Picnic Point-North Lynnwood: | 13.4% (4,524) |
| State: | 12.6% (35,976) |
Number of households with income > $200k:| Picnic Point-North Lynnwood: | 30.9% (10,394) |
| State: | 29.2% (83,109) |
Aggregate household income in Picnic Point-North Lynnwood in 2022: $432,439,612
Median family income in Picnic Point-North Lynnwood in 2022:| Picnic Point-North Lynnwood: | $120,852 |
| State: | $143,595 |
Number of families with income < $10k:| Picnic Point-North Lynnwood: | 5.8% (100) |
| State: | 2.9% (5,479) |
Number of families with income $10k - 20k:| Picnic Point-North Lynnwood: | 2.9% (50) |
| State: | 2.2% (4,150) |
Number of families with income $20k - 30k:| Picnic Point-North Lynnwood: | 4.6% (79) |
| State: | 1.9% (3,558) |
Number of families with income $30k - 40k:| Picnic Point-North Lynnwood: | 2.4% (41) |
| State: | 3.1% (5,734) |
Number of families with income $40k - 50k:| Picnic Point-North Lynnwood: | 0.8% (15) |
| State: | 3.6% (6,707) |
Number of families with income $50k - 60k:| Picnic Point-North Lynnwood: | 2.2% (39) |
| State: | 4.1% (7,663) |
Number of families with income $60k - 75k:| Picnic Point-North Lynnwood: | 9.2% (159) |
| State: | 5.1% (9,490) |
Number of families with income $75k - 100k:| Picnic Point-North Lynnwood: | 15.7% (272) |
| State: | 11.7% (21,919) |
Number of families with income $100k - 125k:| Picnic Point-North Lynnwood: | 14.7% (256) |
| State: | 9.3% (17,280) |
Number of families with income $125k - 150k:| Picnic Point-North Lynnwood: | 4.6% (80) |
| Washington: | 8.4% (15,602) |
Number of families with income $150k - 200k:| Picnic Point-North Lynnwood: | 23.3% (405) |
| State: | 13.3% (24,789) |
Number of families with income > $200k:| Picnic Point-North Lynnwood: | 13.8% (240) |
| State: | 34.4% (64,250) |
Median non-family income in Picnic Point-North Lynnwood in 2022:| Picnic Point-North Lynnwood: | $91,012 |
| Washington: | $84,971 |
Change in median non-family income between 2000 and 2022:| Picnic Point-North Lynnwood, Washington: | +119.9% |
| Washington: | +211.1% |
Median per capita income in Picnic Point-North Lynnwood in 2022:| Picnic Point-North Lynnwood: | $49,551 |
| State: | $67,666 |
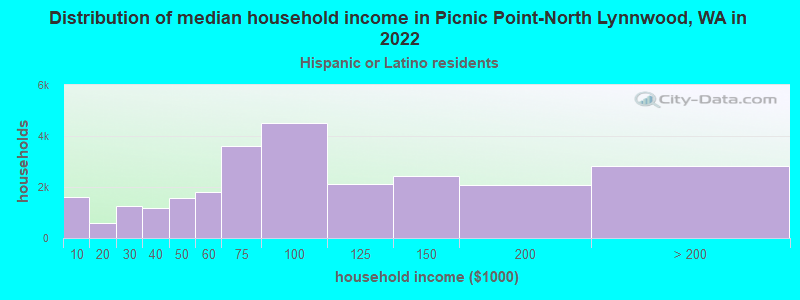
Income statistics for Hispanic or Latino residents
Median household income in Picnic Point-North Lynnwood, WA in 2022:| Picnic Point-North Lynnwood: | $89,912 |
| State: | $74,770 |
Change in median household income between 2000 and 2022:| Picnic Point-North Lynnwood, Washington: | +74.5% |
| State: | +128.3% |
Number of households with income < $10k:| Picnic Point-North Lynnwood: | 6.4% (1,622) |
| State: | 4.9% (14,456) |
Number of households with income $10k - 20k:| Picnic Point-North Lynnwood: | 2.3% (593) |
| State: | 5.3% (15,449) |
Number of households with income $20k - 30k:| Picnic Point-North Lynnwood: | 4.9% (1,241) |
| Washington: | 6.8% (20,016) |
Number of households with income $30k - 40k:| Picnic Point-North Lynnwood: | 4.6% (1,169) |
| State: | 7.7% (22,548) |
Number of households with income $40k - 50k:| Picnic Point-North Lynnwood: | 6.1% (1,553) |
| Washington: | 7.3% (21,450) |
Number of households with income $50k - 60k:| Picnic Point-North Lynnwood: | 7.0% (1,786) |
| State: | 7.7% (22,744) |
Number of households with income $60k - 75k:| Picnic Point-North Lynnwood: | 14.1% (3,594) |
| Washington: | 10.5% (30,737) |
Number of households with income $75k - 100k:| Picnic Point-North Lynnwood: | 17.7% (4,523) |
| State: | 14.9% (43,843) |
Number of households with income $100k - 125k:| Picnic Point-North Lynnwood: | 8.3% (2,110) |
| State: | 11.1% (32,554) |
Number of households with income $125k - 150k:| Picnic Point-North Lynnwood: | 9.5% (2,426) |
| State: | 7.4% (21,624) |
Number of households with income $150k - 200k:| Picnic Point-North Lynnwood: | 8.1% (2,065) |
| State: | 7.3% (21,360) |
Number of households with income > $200k:| Picnic Point-North Lynnwood: | 11.0% (2,817) |
| State: | 9.2% (27,055) |
Aggregate household income in Picnic Point-North Lynnwood in 2022: $83,384,953
Median family income in Picnic Point-North Lynnwood in 2022:| Picnic Point-North Lynnwood: | $93,058 |
| State: | $76,866 |
Number of families with income < $10k:| Picnic Point-North Lynnwood: | 6.0% (38) |
| State: | 4.4% (9,443) |
Number of families with income $10k - 20k:| Picnic Point-North Lynnwood: | 1.3% (8) |
| State: | 3.5% (7,524) |
Number of families with income $20k - 30k:| Picnic Point-North Lynnwood: | 2.7% (17) |
| State: | 5.6% (12,052) |
Number of families with income $30k - 40k:| Picnic Point-North Lynnwood: | 2.2% (14) |
| State: | 8.3% (17,803) |
Number of families with income $40k - 50k:| Picnic Point-North Lynnwood: | 4.7% (30) |
| State: | 7.7% (16,361) |
Number of families with income $50k - 60k:| Picnic Point-North Lynnwood: | 6.1% (38) |
| State: | 7.9% (16,852) |
Number of families with income $60k - 75k:| Picnic Point-North Lynnwood: | 15.9% (100) |
| Washington: | 11.4% (24,342) |
Number of families with income $75k - 100k:| Picnic Point-North Lynnwood: | 18.0% (113) |
| State: | 14.4% (30,698) |
Number of families with income $100k - 125k:| Picnic Point-North Lynnwood: | 10.8% (67) |
| Washington: | 11.4% (24,331) |
Number of families with income $125k - 150k:| Picnic Point-North Lynnwood: | 7.6% (48) |
| State: | 7.5% (16,099) |
Number of families with income $150k - 200k:| Picnic Point-North Lynnwood: | 8.7% (55) |
| Washington: | 8.2% (17,551) |
Number of families with income > $200k:| Picnic Point-North Lynnwood: | 16.0% (101) |
| State: | 9.7% (20,653) |
Median non-family income in Picnic Point-North Lynnwood in 2022:| Picnic Point-North Lynnwood: | $65,288 |
| State: | $54,173 |
Change in median non-family income between 2000 and 2022:| Picnic Point-North Lynnwood, Washington: | +122.3% |
| State: | +105.8% |
Median per capita income in Picnic Point-North Lynnwood in 2022:| Picnic Point-North Lynnwood: | $26,974 |
| Washington: | $28,252 |
Change in median per capita income between 2000 and 2022:| Picnic Point-North Lynnwood, Washington: | +89.2% |
| State: | +150.2% |
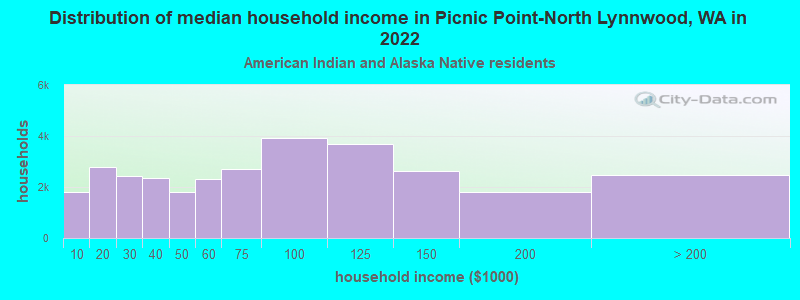
Income statistics for American Indian and Alaska Native residents
Median household income in Picnic Point-North Lynnwood, WA in 2022:| Picnic Point-North Lynnwood: | $241,278 |
| State: | $71,255 |
Number of households with income < $10k:| Picnic Point-North Lynnwood: | 5.9% (1,813) |
| State: | 5.9% (1,768) |
Number of households with income $10k - 20k:| Picnic Point-North Lynnwood: | 9.0% (2,768) |
| Washington: | 8.9% (2,694) |
Number of households with income $20k - 30k:| Picnic Point-North Lynnwood: | 8.0% (2,448) |
| Washington: | 8.0% (2,412) |
Number of households with income $30k - 40k:| Picnic Point-North Lynnwood: | 7.7% (2,372) |
| State: | 7.7% (2,327) |
Number of households with income $40k - 50k:| Picnic Point-North Lynnwood: | 5.9% (1,813) |
| State: | 5.8% (1,755) |
Number of households with income $50k - 60k:| Picnic Point-North Lynnwood: | 7.5% (2,306) |
| State: | 7.5% (2,259) |
Number of households with income $60k - 75k:| Picnic Point-North Lynnwood: | 8.8% (2,720) |
| State: | 8.8% (2,669) |
Number of households with income $75k - 100k:| Picnic Point-North Lynnwood: | 12.7% (3,920) |
| State: | 12.8% (3,861) |
Number of households with income $100k - 125k:| Picnic Point-North Lynnwood: | 12.0% (3,700) |
| State: | 12.0% (3,618) |
Number of households with income $125k - 150k:| Picnic Point-North Lynnwood: | 8.6% (2,643) |
| State: | 8.6% (2,580) |
Number of households with income $150k - 200k:| Picnic Point-North Lynnwood: | 5.9% (1,807) |
| Washington: | 5.9% (1,774) |
Number of households with income > $200k:| Picnic Point-North Lynnwood: | 8.0% (2,474) |
| State: | 8.1% (2,447) |
Aggregate household income in Picnic Point-North Lynnwood in 2022: $5,152,989
Median family income in Picnic Point-North Lynnwood in 2022:| Picnic Point-North Lynnwood: | $121,493 |
| Washington: | $79,010 |
Number of families with income $10k - 20k:| Picnic Point-North Lynnwood: | 8.3% (2) |
| State: | 5.2% (1,056) |
Number of families with income $40k - 50k:| Picnic Point-North Lynnwood: | 9.6% (2) |
| State: | 4.6% (927) |
Number of families with income $50k - 60k:| Picnic Point-North Lynnwood: | 36.9% (9) |
| State: | 9.7% (1,973) |
Number of families with income $60k - 75k:| Picnic Point-North Lynnwood: | 45.2% (11) |
| State: | 10.5% (2,124) |
Median non-family income in Picnic Point-North Lynnwood in 2022:| Picnic Point-North Lynnwood: | $435,183 |
| Washington: | $35,591 |
Median per capita income in Picnic Point-North Lynnwood in 2022:| Picnic Point-North Lynnwood: | $47,395 |
| State: | $27,053 |
Change in median per capita income between 2000 and 2022:| Picnic Point-North Lynnwood, Washington: | +85.4% |
| State: | +98.6% |
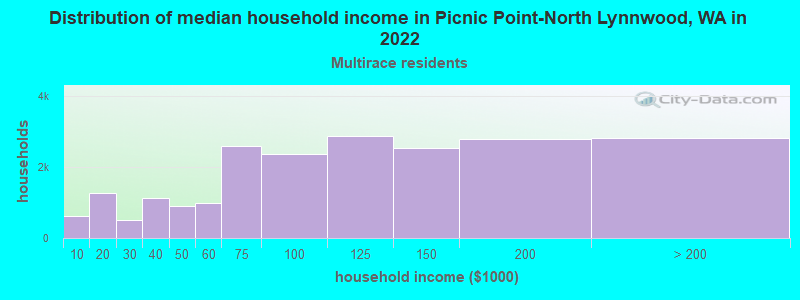
Income statistics for Multirace residents
Median household income in Picnic Point-North Lynnwood, WA in 2022:| Picnic Point-North Lynnwood: | $89,934 |
| Washington: | $84,303 |
Change in median household income between 2000 and 2022:| Picnic Point-North Lynnwood, Washington: | +103.5% |
| State: | +125.7% |
Number of households with income < $10k:| Picnic Point-North Lynnwood: | 2.9% (612) |
| Washington: | 4.3% (12,040) |
Number of households with income $10k - 20k:| Picnic Point-North Lynnwood: | 5.9% (1,260) |
| Washington: | 6.6% (18,437) |
Number of households with income $20k - 30k:| Picnic Point-North Lynnwood: | 2.4% (516) |
| State: | 5.2% (14,559) |
Number of households with income $30k - 40k:| Picnic Point-North Lynnwood: | 5.3% (1,133) |
| State: | 6.7% (18,491) |
Number of households with income $40k - 50k:| Picnic Point-North Lynnwood: | 4.2% (900) |
| State: | 6.3% (17,459) |
Number of households with income $50k - 60k:| Picnic Point-North Lynnwood: | 4.5% (972) |
| State: | 6.9% (19,086) |
Number of households with income $60k - 75k:| Picnic Point-North Lynnwood: | 12.2% (2,601) |
| State: | 9.1% (25,310) |
Number of households with income $75k - 100k:| Picnic Point-North Lynnwood: | 11.1% (2,362) |
| Washington: | 13.5% (37,493) |
Number of households with income $100k - 125k:| Picnic Point-North Lynnwood: | 13.4% (2,871) |
| State: | 10.7% (29,626) |
Number of households with income $125k - 150k:| Picnic Point-North Lynnwood: | 11.9% (2,543) |
| State: | 8.6% (23,899) |
Number of households with income $150k - 200k:| Picnic Point-North Lynnwood: | 13.1% (2,796) |
| Washington: | 10.2% (28,214) |
Number of households with income > $200k:| Picnic Point-North Lynnwood: | 13.1% (2,801) |
| State: | 11.9% (32,947) |
Aggregate household income in Picnic Point-North Lynnwood in 2022: $143,116,202
Median family income in Picnic Point-North Lynnwood in 2022:| Picnic Point-North Lynnwood: | $125,181 |
| Washington: | $95,629 |
Number of families with income < $10k:| Picnic Point-North Lynnwood: | 13.0% (75) |
| Washington: | 3.5% (6,121) |
Number of families with income $10k - 20k:| Picnic Point-North Lynnwood: | 1.1% (6) |
| Washington: | 4.3% (7,519) |
Number of families with income $20k - 30k:| Picnic Point-North Lynnwood: | 2.9% (17) |
| State: | 4.4% (7,775) |
Number of families with income $30k - 40k:| Picnic Point-North Lynnwood: | 3.3% (19) |
| State: | 5.8% (10,186) |
Number of families with income $40k - 50k:| Picnic Point-North Lynnwood: | 1.3% (8) |
| Washington: | 5.9% (10,412) |
Number of families with income $50k - 60k:| Picnic Point-North Lynnwood: | 4.9% (28) |
| State: | 5.6% (9,922) |
Number of families with income $60k - 75k:| Picnic Point-North Lynnwood: | 19.0% (109) |
| State: | 9.7% (17,113) |
Number of families with income $75k - 100k:| Picnic Point-North Lynnwood: | 18.7% (107) |
| Washington: | 13.6% (23,984) |
Number of families with income $125k - 150k:| Picnic Point-North Lynnwood: | 35.7% (205) |
| State: | 10.5% (18,481) |
Median non-family income in Picnic Point-North Lynnwood in 2022:| Picnic Point-North Lynnwood: | $72,122 |
| State: | $56,573 |
Change in median non-family income between 2000 and 2022:| Picnic Point-North Lynnwood, Washington: | +128.2% |
| State: | +115.0% |
Median per capita income in Picnic Point-North Lynnwood in 2022:| Picnic Point-North Lynnwood: | $29,984 |
| State: | $32,496 |
Change in median per capita income between 2000 and 2022:| Picnic Point-North Lynnwood, Washington: | +128.0% |
| State: | +156.8% |
Income statistics for other residents
Number of households with income < $10k:| Picnic Point-North Lynnwood: | 6.7% (48) |
| State: | 5.3% (6,540) |
Number of households with income $10k - 20k:| Picnic Point-North Lynnwood: | 2.5% (18) |
| State: | 6.0% (7,385) |
Number of households with income $20k - 30k:| Picnic Point-North Lynnwood: | 4.8% (34) |
| State: | 7.5% (9,289) |
Number of households with income $30k - 40k:| Picnic Point-North Lynnwood: | 4.6% (33) |
| Washington: | 8.9% (11,015) |
Number of households with income $40k - 50k:| Picnic Point-North Lynnwood: | 8.8% (63) |
| Washington: | 7.6% (9,399) |
Number of households with income $50k - 60k:| Picnic Point-North Lynnwood: | 9.0% (64) |
| State: | 7.2% (8,867) |
Number of households with income $60k - 75k:| Picnic Point-North Lynnwood: | 14.2% (101) |
| State: | 10.5% (13,032) |
Number of households with income $75k - 100k:| Picnic Point-North Lynnwood: | 16.2% (115) |
| State: | 14.6% (18,007) |
Number of households with income $100k - 125k:| Picnic Point-North Lynnwood: | 9.8% (70) |
| State: | 12.2% (15,128) |
Number of households with income $125k - 150k:| Picnic Point-North Lynnwood: | 8.7% (62) |
| State: | 5.6% (6,950) |
Number of households with income $150k - 200k:| Picnic Point-North Lynnwood: | 6.0% (43) |
| State: | 7.1% (8,749) |
Number of households with income > $200k:| Picnic Point-North Lynnwood: | 8.6% (61) |
| State: | 7.5% (9,208) |
Aggregate household income in Picnic Point-North Lynnwood in 2022: $69,424,907
Median family income in Picnic Point-North Lynnwood in 2022:| Picnic Point-North Lynnwood: | $89,640 |
| State: | $72,588 |
Number of families with income < $10k:| Picnic Point-North Lynnwood: | 10.5% (48) |
| State: | 5.5% (5,287) |
Number of families with income $10k - 20k:| Picnic Point-North Lynnwood: | 1.8% (8) |
| State: | 4.0% (3,814) |
Number of families with income $20k - 30k:| Picnic Point-North Lynnwood: | 3.7% (17) |
| State: | 6.6% (6,293) |
Number of families with income $30k - 40k:| Picnic Point-North Lynnwood: | 4.0% (18) |
| State: | 9.2% (8,827) |
Number of families with income $40k - 50k:| Picnic Point-North Lynnwood: | 21.3% (97) |
| State: | 8.0% (7,634) |
Number of families with income $50k - 60k:| Picnic Point-North Lynnwood: | 6.0% (27) |
| State: | 7.7% (7,357) |
Number of families with income $60k - 75k:| Picnic Point-North Lynnwood: | 17.7% (81) |
| Washington: | 10.3% (9,864) |
Number of families with income $75k - 100k:| Picnic Point-North Lynnwood: | 34.9% (160) |
| State: | 14.5% (13,800) |
Median non-family income in Picnic Point-North Lynnwood in 2022:| Picnic Point-North Lynnwood: | $96,825 |
| State: | $44,777 |
Change in median non-family income between 2000 and 2022:| Picnic Point-North Lynnwood, Washington: | +81.2% |
| State: | +84.2% |
Median per capita income in Picnic Point-North Lynnwood in 2022:| Picnic Point-North Lynnwood: | $29,130 |
| Washington: | $27,542 |
Change in median per capita income between 2000 and 2022:| Picnic Point-North Lynnwood, Washington: | +125.7% |
| Washington: | +167.8% |